Support and resistance levels are fundamental concepts in forex trading, providing a foundation for price action analysis. These levels represent psychological price points where buying and selling pressures will likely emerge. Understanding and effectively utilizing support and resistance can enhance trading strategies, improve entry and exit points, and boost profitability. This forex strategy for beginners is designed to help new traders grasp the essential principles of support and resistance, laying the groundwork for more advanced trading techniques.
Understanding Support and Resistance
What is Support?
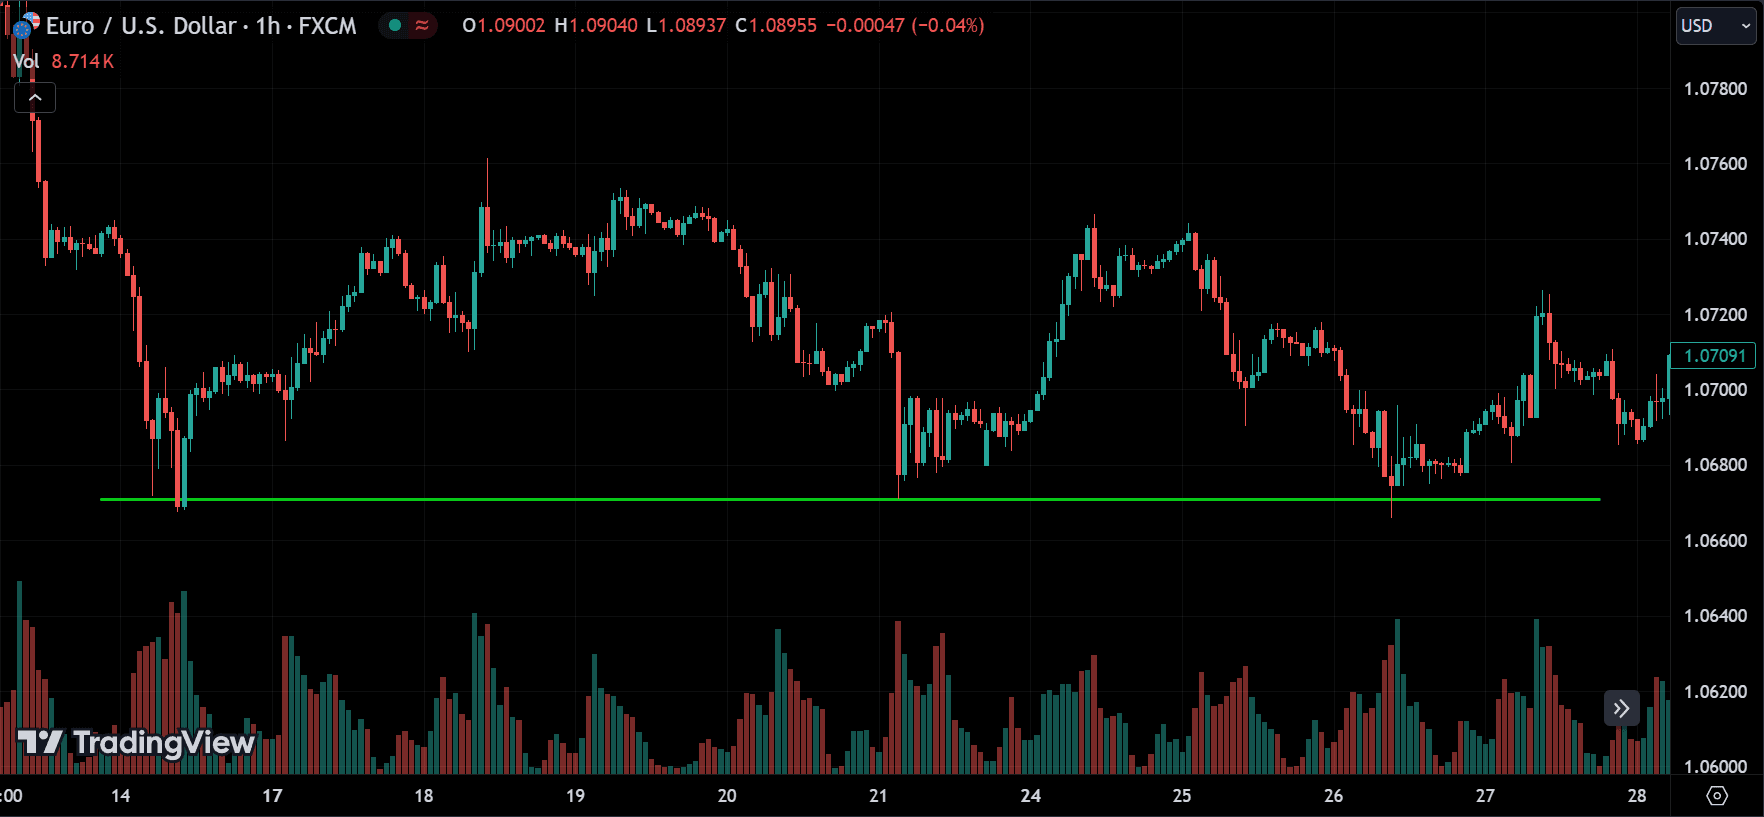
Support is a price level where a currency pair tends to find buying interest as it declines. At this level, demand is strong enough to prevent the price from falling further. Traders look for support levels to identify potential buying opportunities.
What is Resistance?
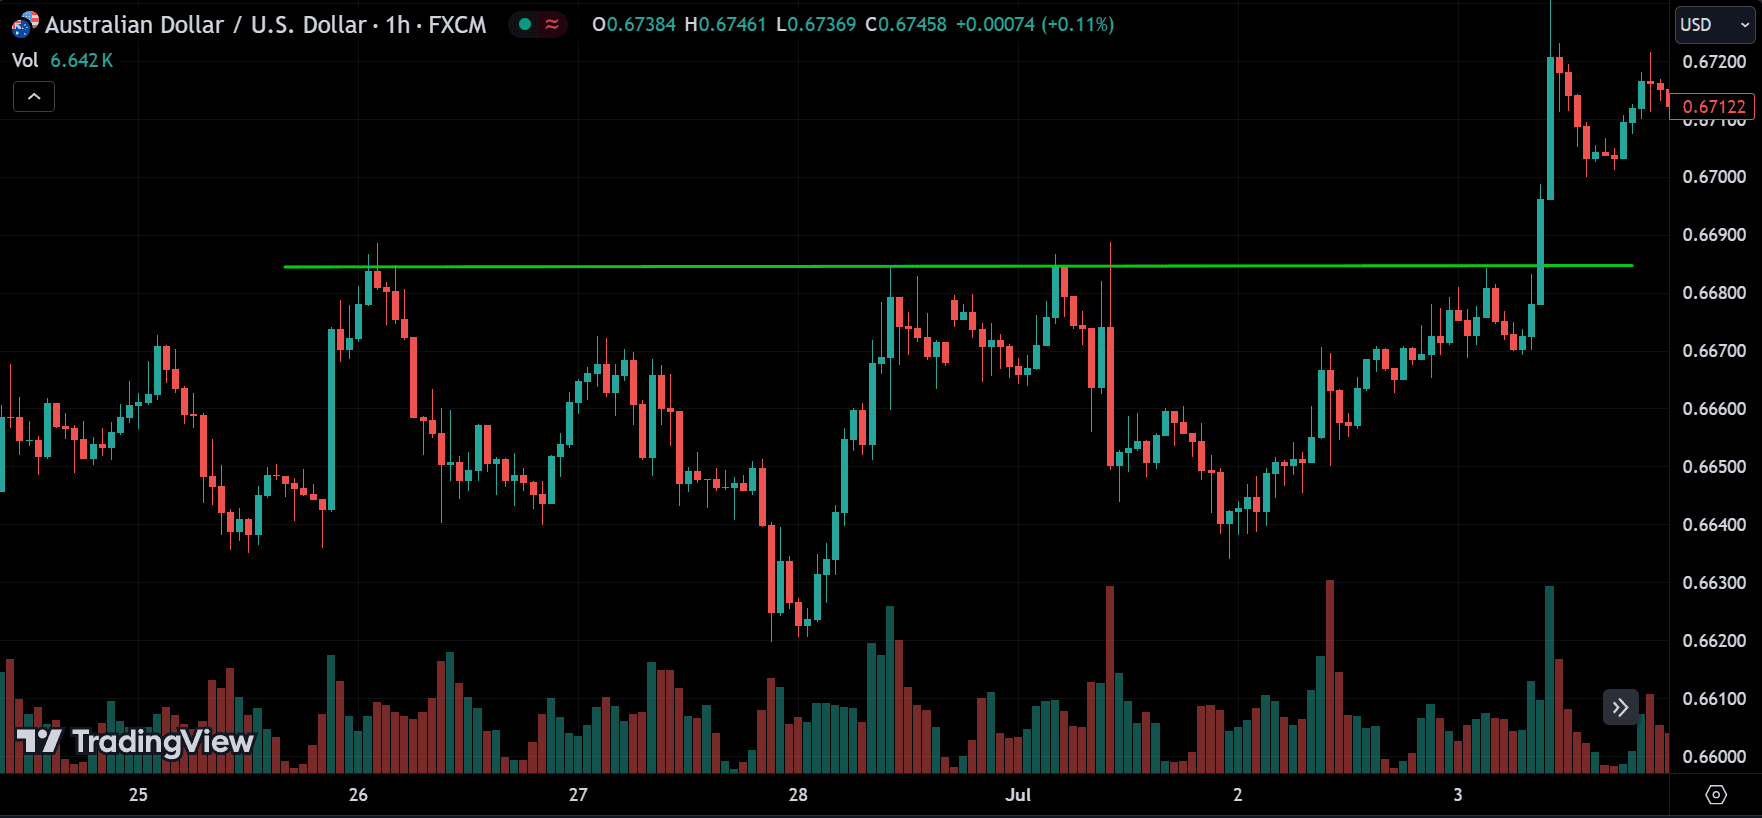
Resistance is a price level where a currency pair encounters selling pressure as it rises. At this level, supply is strong enough to prevent the price from increasing further. Traders look for resistance levels to identify potential selling opportunities.
Identifying Support and Resistance Levels
Historical Price Levels:
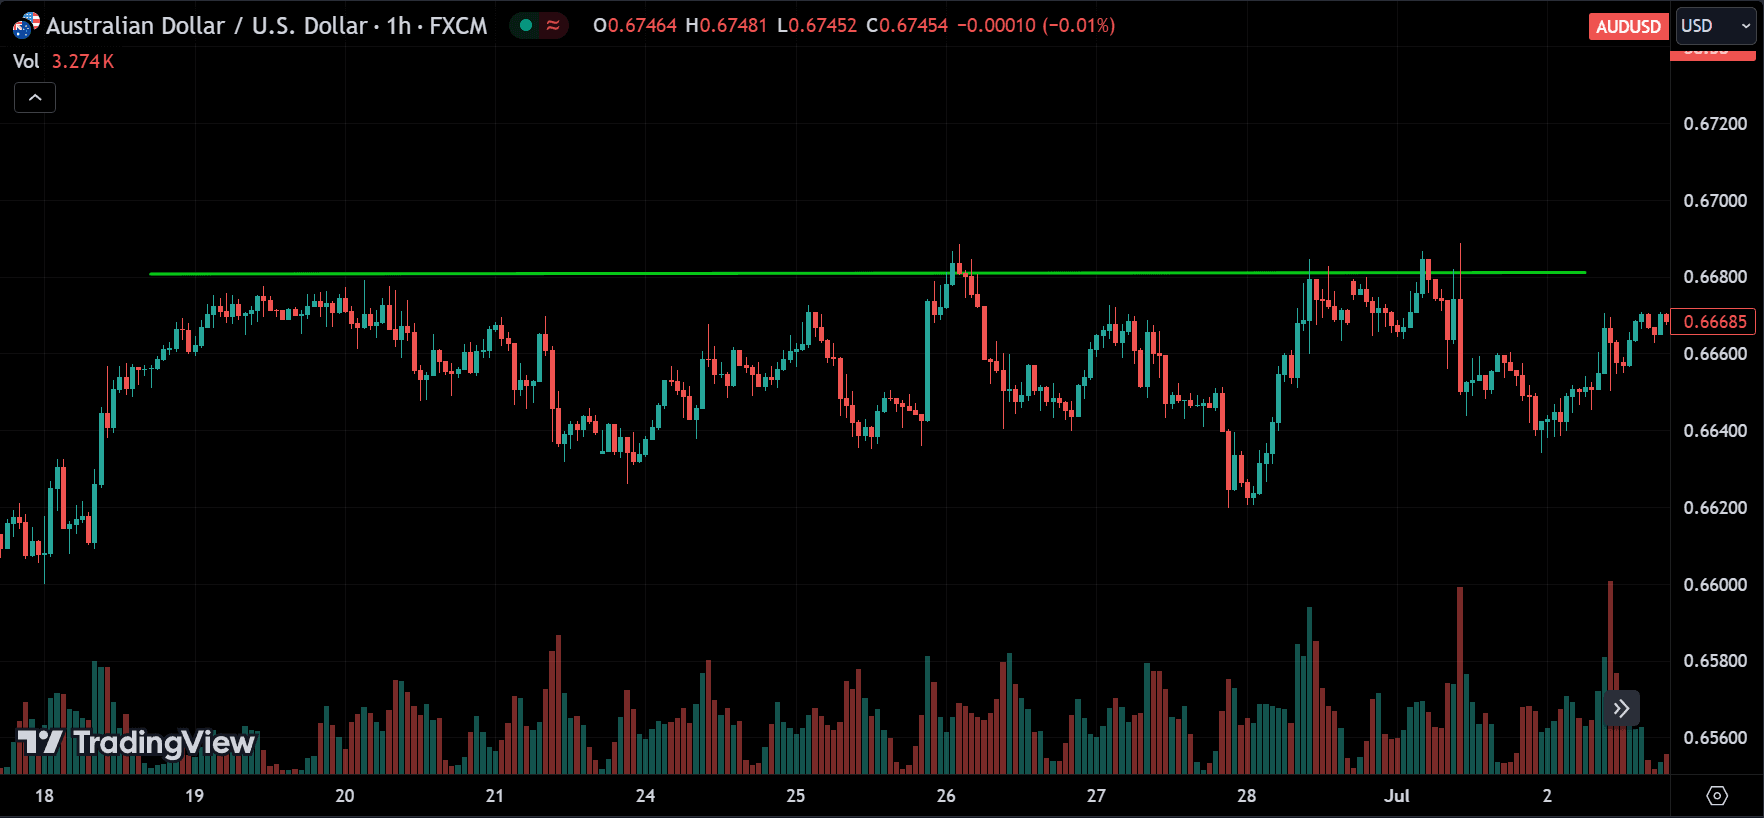
Examine past price action to identify levels where the price has reversed direction multiple times. These historical levels are crucial in determining future support and resistance.
Round Numbers:
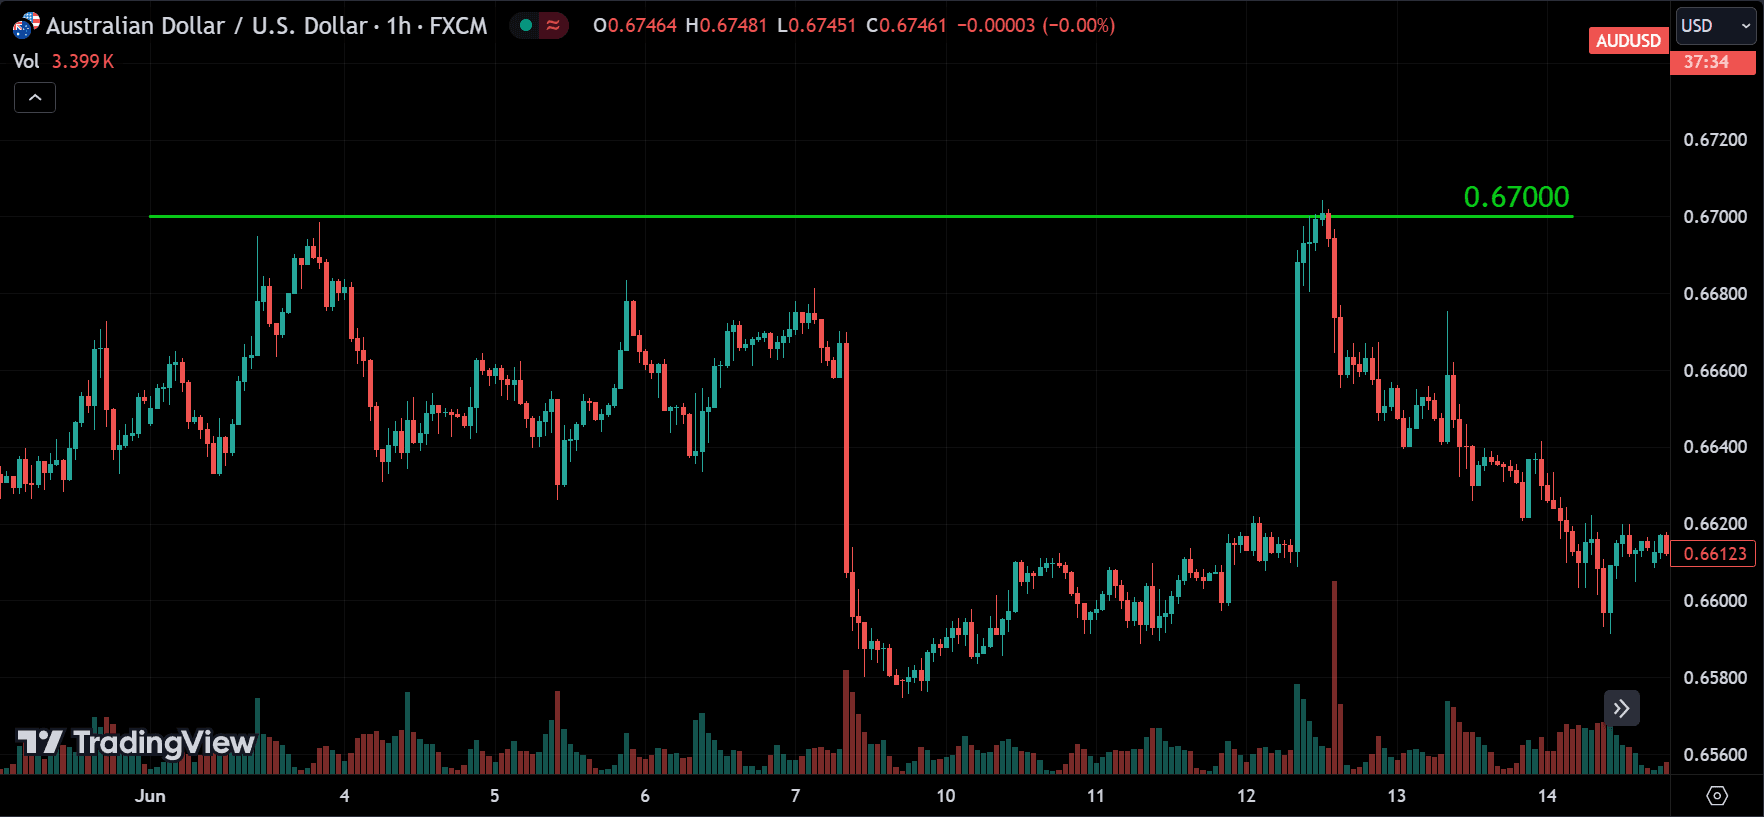
Psychological price levels, often ending in 00 (e.g., 1.2000), act as support or resistance due to their significance to traders.
Moving Averages:
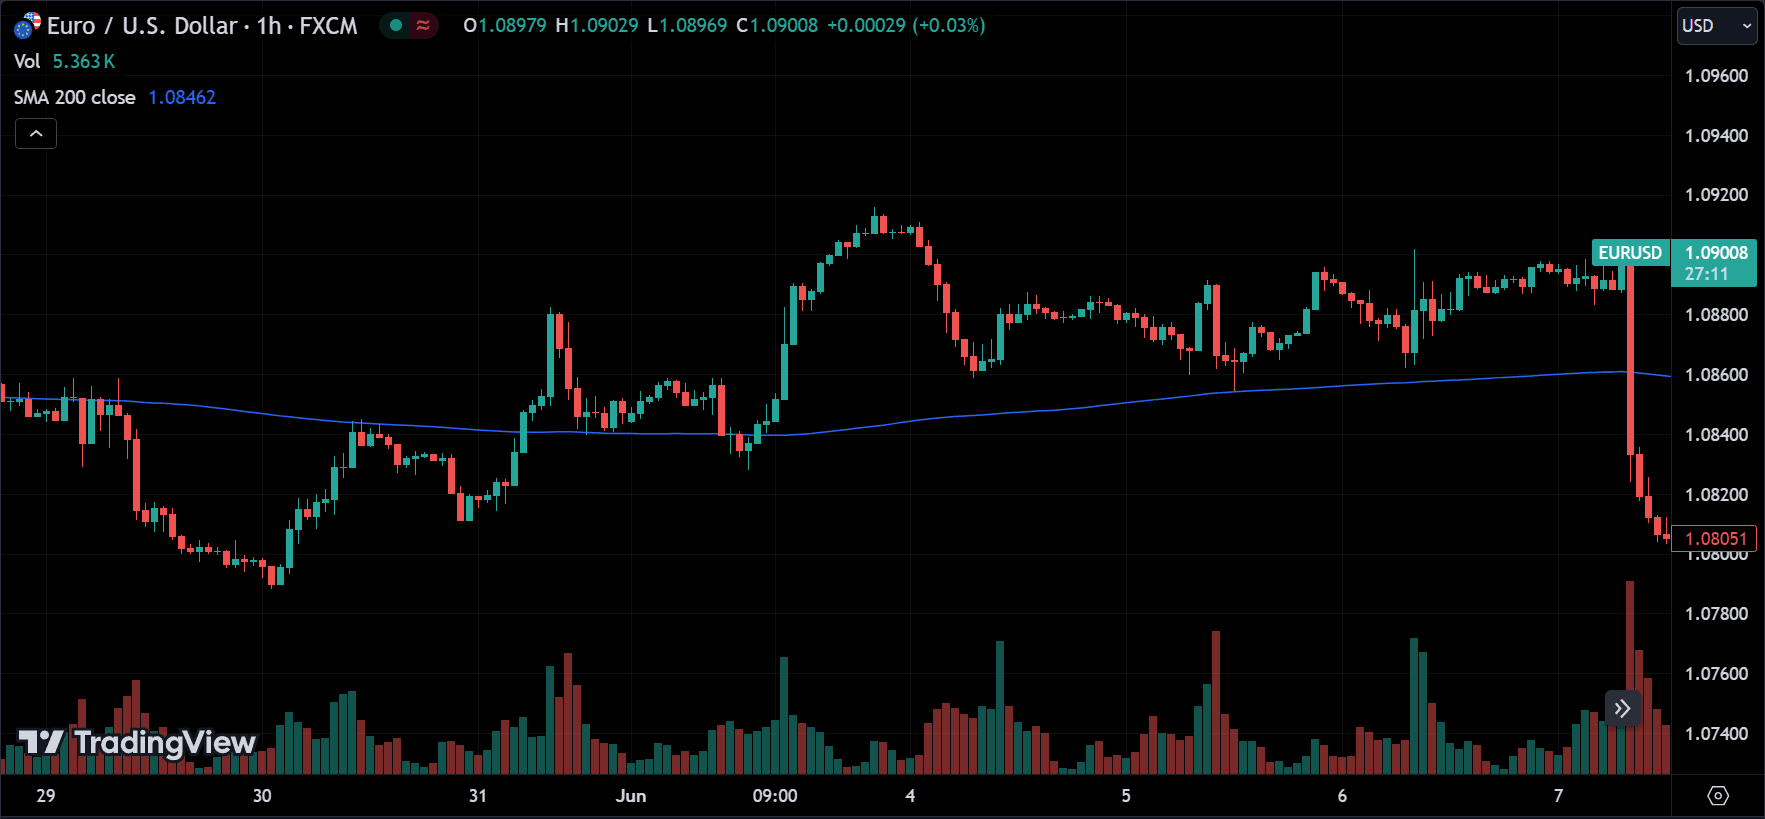
Commonly used moving averages (e.g., 50-day, 200-day) often act as dynamic support or resistance levels.
Trend Lines:

Drawing trend lines connecting significant highs or lows can help identify diagonal support or resistance levels.
Fibonacci Retracement Levels:
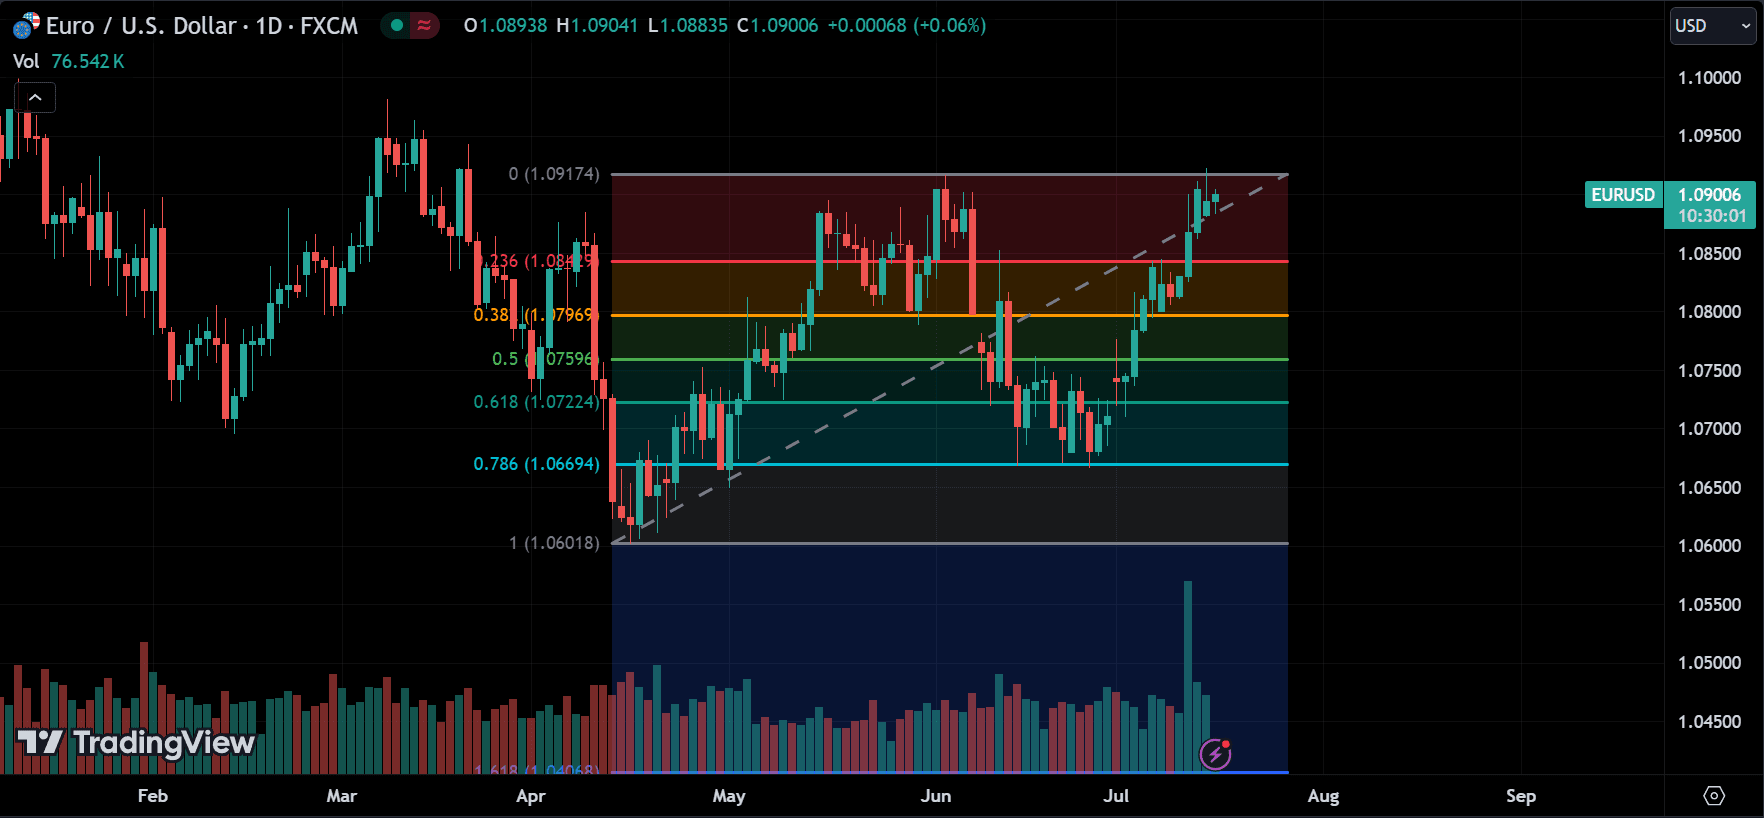
These levels, derived from the Fibonacci sequence, are used to identify potential reversal levels based on mathematical ratios.
Support and Resistance Trading Strategies
There are many ways to use support and resistance in your trading. We’ll look at three methods shortly. However, it’s important to understand that not all of them will work every time or for every currency pair. You need to test them to see which works best for you. You can try all three methods together, use just one, or combine two. Experiment to find what suits you best. Later, I will share my favorite method of trading support and resistance using just price action. Ultimately, you need a strategy that gives you positive expectancy.
Bounce Trading Strategy:
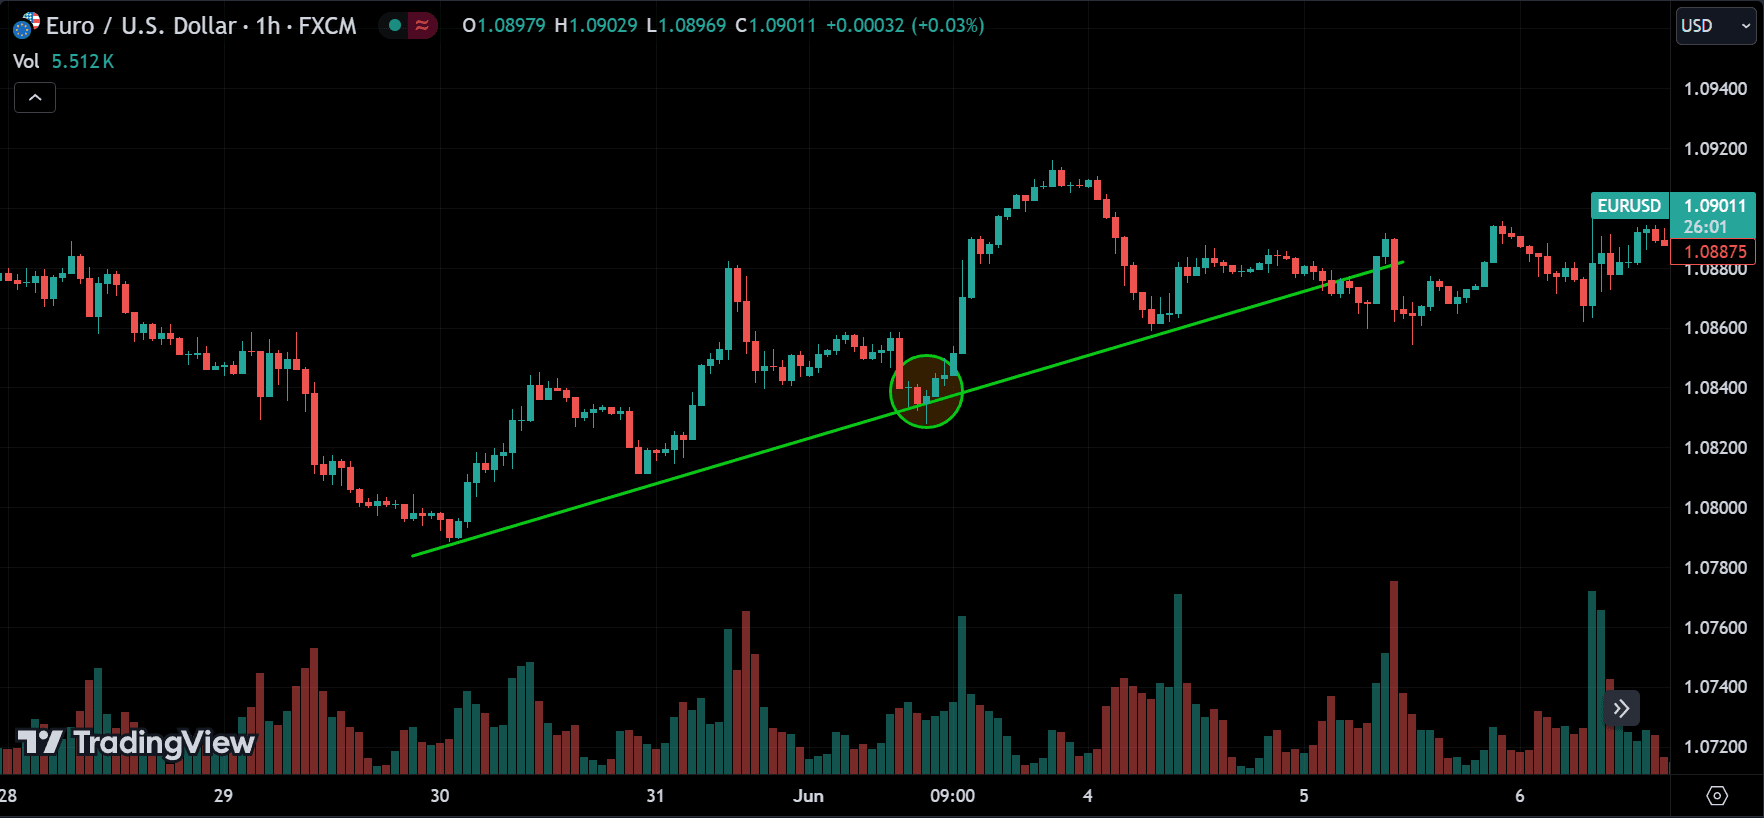
- Entry Point: Identify a currency pair approaching a support or resistance level. Wait for confirmation of the bounce, such as a bullish reversal candlestick pattern (e.g., hammer) at support or a bearish reversal pattern (e.g., shooting star) at resistance.
- Stop Loss: Place a stop loss slightly below the support level for a long position or above the resistance level for a short position.
- Take Profit: Set a take profit level based on the distance between the entry point and the next support or resistance level.
Breakout Trading Strategy:
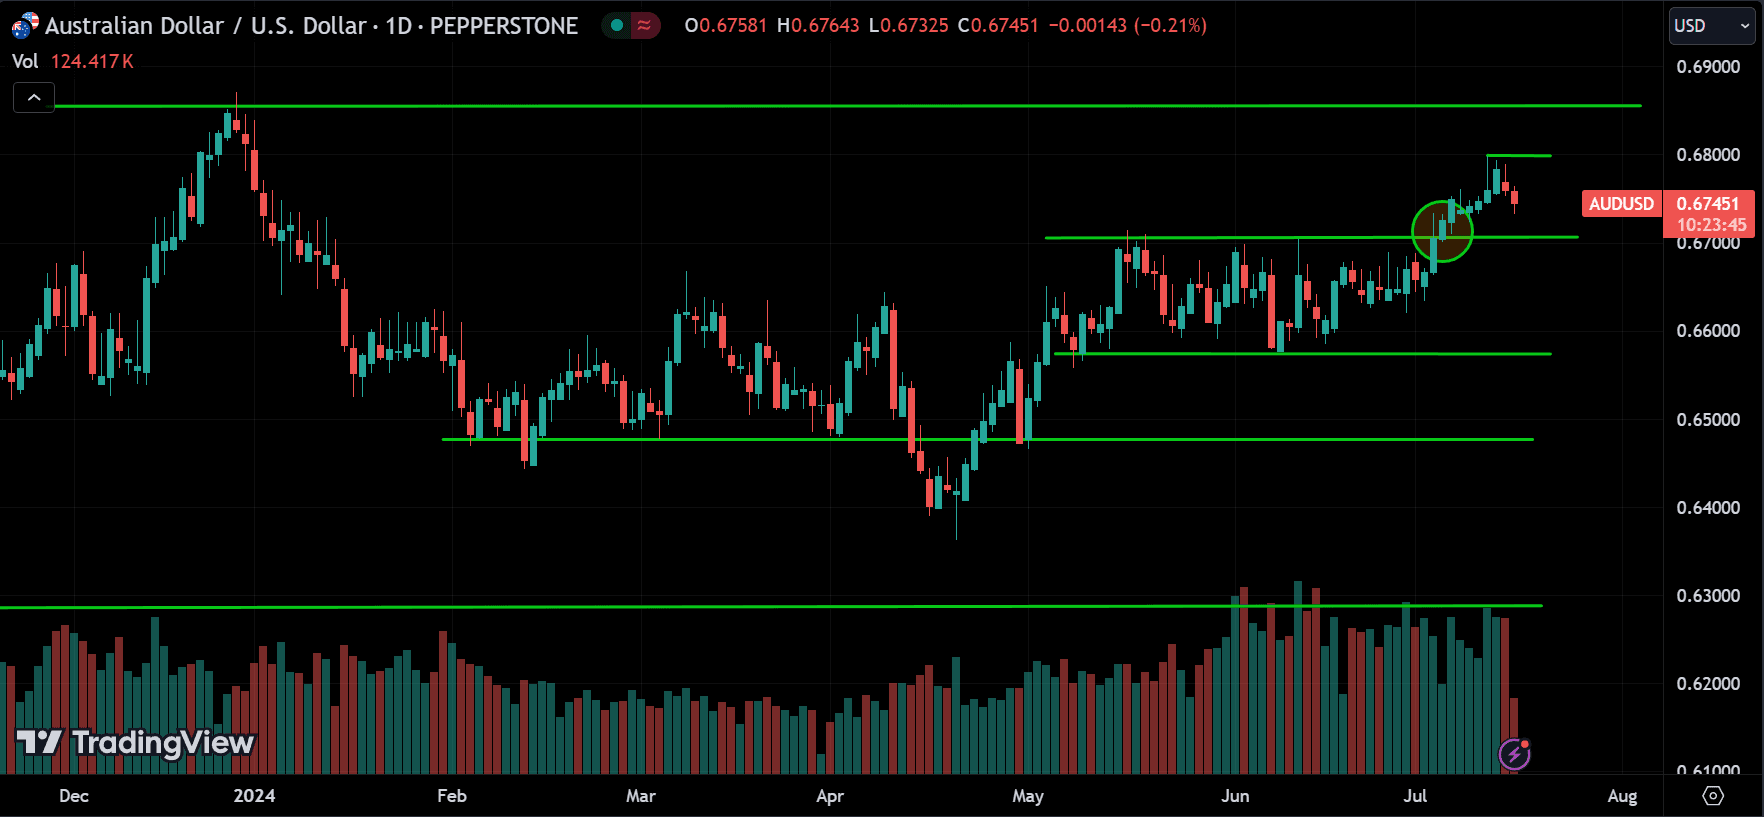
- Entry Point: Identify a currency pair consolidating near a support or resistance level. Wait for a breakout with increased volume above the resistance level or below the support level.
- Stop Loss: Place a stop loss slightly below the breakout level for a long position or above the breakout level for a short position.
- Take Profit: Use a trailing stop or predefined price targets based on the breakout distance or previous swing highs and lows.
Range Trading Strategy:

- Entry Point: Identify a currency pair trading within a well-defined range between support and resistance levels. Buy near the support level and sell near the resistance level.
- Stop Loss: Place a stop loss slightly below the support level for long positions or above the resistance level for short positions.
- Take Profit: Set take profit levels near the opposite end of the range.
Download a Collection of Indicators, Courses, and EA for FREE
Price Action Support and Resistance Strategy & Trading Plan Implementation
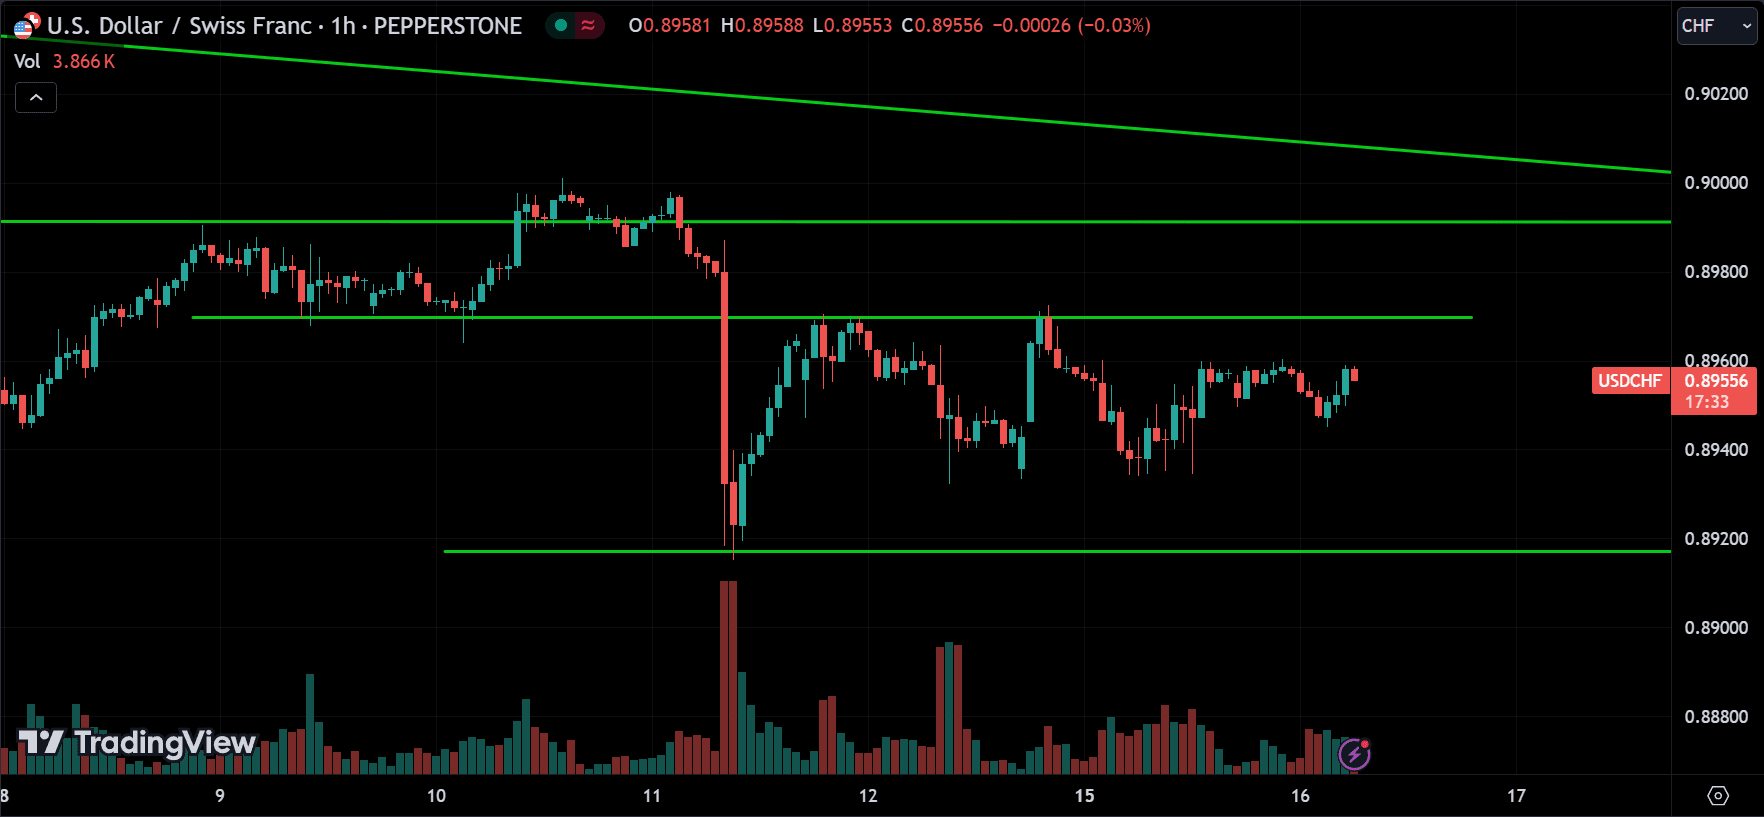
We use the three methods mentioned earlier in price action trading, but only with price and volume—no indicators. Your eyes become the indicators in price action trading. Here’s how it works: if you see a breakout, follow the breakout direction; if you see a reversal signal, follow the reversal; if you see a chance for range or mean reversion trading, take it.
Unlike most indicators that lag behind the price, what sets price action apart is its need for instant response. Price action uses live data, making it real-time. However, mastering price action takes time. You need to follow the same asset for months to get familiar with its movements. Practice makes perfect, just like anything else. If you want to learn more about price action, follow our market analysis series, which focuses on pure price action trading.
| STRATEGY | SUPPORT AND RESISTANCE TRADING |
| TRADING STYLE | DAY-TRADING |
| STRATEGY TYPE | MEAN-REVERSION |
| HOLDING PERIOD | FEW MINS TO CURRENT SESSION END |
| ASSET SELECTION | MAJOR FX PAIRS |
| TIME FRAME | 15M / 30M / 1H |
| ENTRY SIGNAL | DEPENDS ON THE STYLE OF TRADING |
| ENTRY STYLE | SINGLE MARKET ENTRY |
| TAKE PROFIT SIGNAL | PRICE REACHING NEXT SUPPORT OR RESISTANCE LEVEL |
| TAKE PROFIT STYLE | SINGLE LIMIT ORDER |
| POSITION SIZING | SINGLE ENTRY 2% RISK |
| STOP LOSS | 2% RISK, NEAR SUPPORT/RESISTANCE, OVER 15 PIPS |
| BAIL OUT INDICATORS | STONG FUNDAMENTAL NEWS |
If you are unfamiliar with a trading plan and don’t know how to implement it correctly, consider reading that article.
Once you find the best setup for your strategy and plan, write it down like shown above and follow it every time you trade. This is very important for your trading mindset.
Practical Tips for Effective Trading
- Multiple Time Frame Analysis: Confirm support and resistance levels across different time frames to enhance the reliability of these levels.
- Volume Analysis: Pay attention to volume spikes at support and resistance levels to gauge the strength of these levels and the likelihood of reversals or breakouts.
- Combining Indicators: Use additional technical indicators, such as RSI or MACD, to confirm potential entry and exit points.
- Patience and Discipline: Wait for clear confirmation before entering trades. Avoid jumping into trades based on assumptions or incomplete signals.
- Risk Management: Always use stop losses and manage your risk-to-reward ratio to protect your capital and enhance long-term profitability.
Advantages of Support and Resistance Forex Strategy for Beginners
Simplicity and Clarity:
Support and resistance levels provide a clear framework for making trading decisions. These levels are easily identifiable on price charts, making it simple for traders of all experience levels to incorporate them into their strategies.
Versatility:
Support and resistance forex strategy for beginners can be applied to various time frames and market conditions, whether trending, ranging, or consolidating. This versatility allows traders to adapt their strategies to different market environments.
Enhanced Entry and Exit Points:
Identifying key support and resistance levels can improve the timing of trade entries and exits. This can lead to better risk management and potentially higher profitability by capturing significant price movements.
Risk Management:
Using support and resistance levels helps traders set precise stop-loss and take-profit orders. This reduces the risk of large losses and allows for more effective risk management.
Psychological Insight:
Support and resistance levels reflect market psychology and the collective actions of traders. Understanding these psychological barriers can provide valuable insights into market sentiment and potential price reversals.
Disadvantages of Support and Resistance Trading
False Breakouts:
One of the main challenges of support and resistance trading is the occurrence of false breakouts. Prices may temporarily break through a level only to reverse shortly after, leading to potential losses if not managed properly.
Subjectivity:
Identifying support and resistance levels can be subjective, as different traders may draw these levels differently. This subjectivity can lead to inconsistencies in trading decisions and outcomes.
Limited Predictive Power:
While support and resistance levels can indicate potential price movements, they do not guarantee future market behavior. Prices can move unpredictably due to various factors, including news events and market sentiment shifts.
Dependence on Historical Data:
Support and resistance levels are primarily based on historical price action. While historical data can provide valuable insights, it may not always accurately predict future price movements, especially in rapidly changing market conditions.
Over-Reliance:
Traders who rely too heavily on support and resistance levels may overlook other important factors and indicators. This over-reliance can lead to missed opportunities and an incomplete understanding of the market.
- Download Support and Resistance Indicators, Strategies for FREE
Conclusion
Support and resistance levels are vital tools for forex traders, providing insight into potential price movements and market sentiment. By mastering these concepts and incorporating them into a well-structured forex strategy for beginners, traders can improve their decision-making process and achieve better trading outcomes. Remember, successful trading requires continuous learning, discipline, and adaptation to changing market conditions.



No download link