

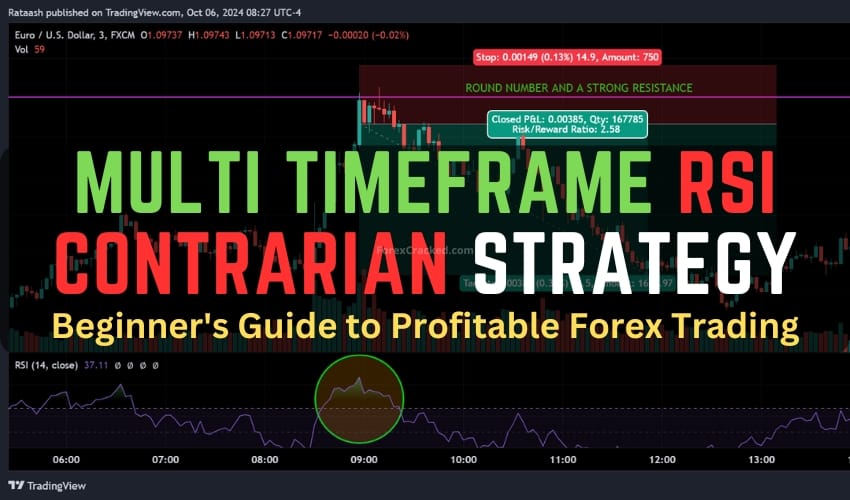
The foreign exchange (Forex) market is the largest and most liquid financial market globally, with a daily trading volume exceeding $6 trillion. Traders are constantly seeking strategies to gain an edge in this competitive environment. One such approach is the Multi-Time Frame RSI Contrarian Strategy. This strategy combines the RSI indicator across multiple time frames to identify potential reversals against the prevailing trend, offering contrarian traders a systematic method to capitalize on market inefficiencies.
Understanding the RSI Indicator
What is RSI?
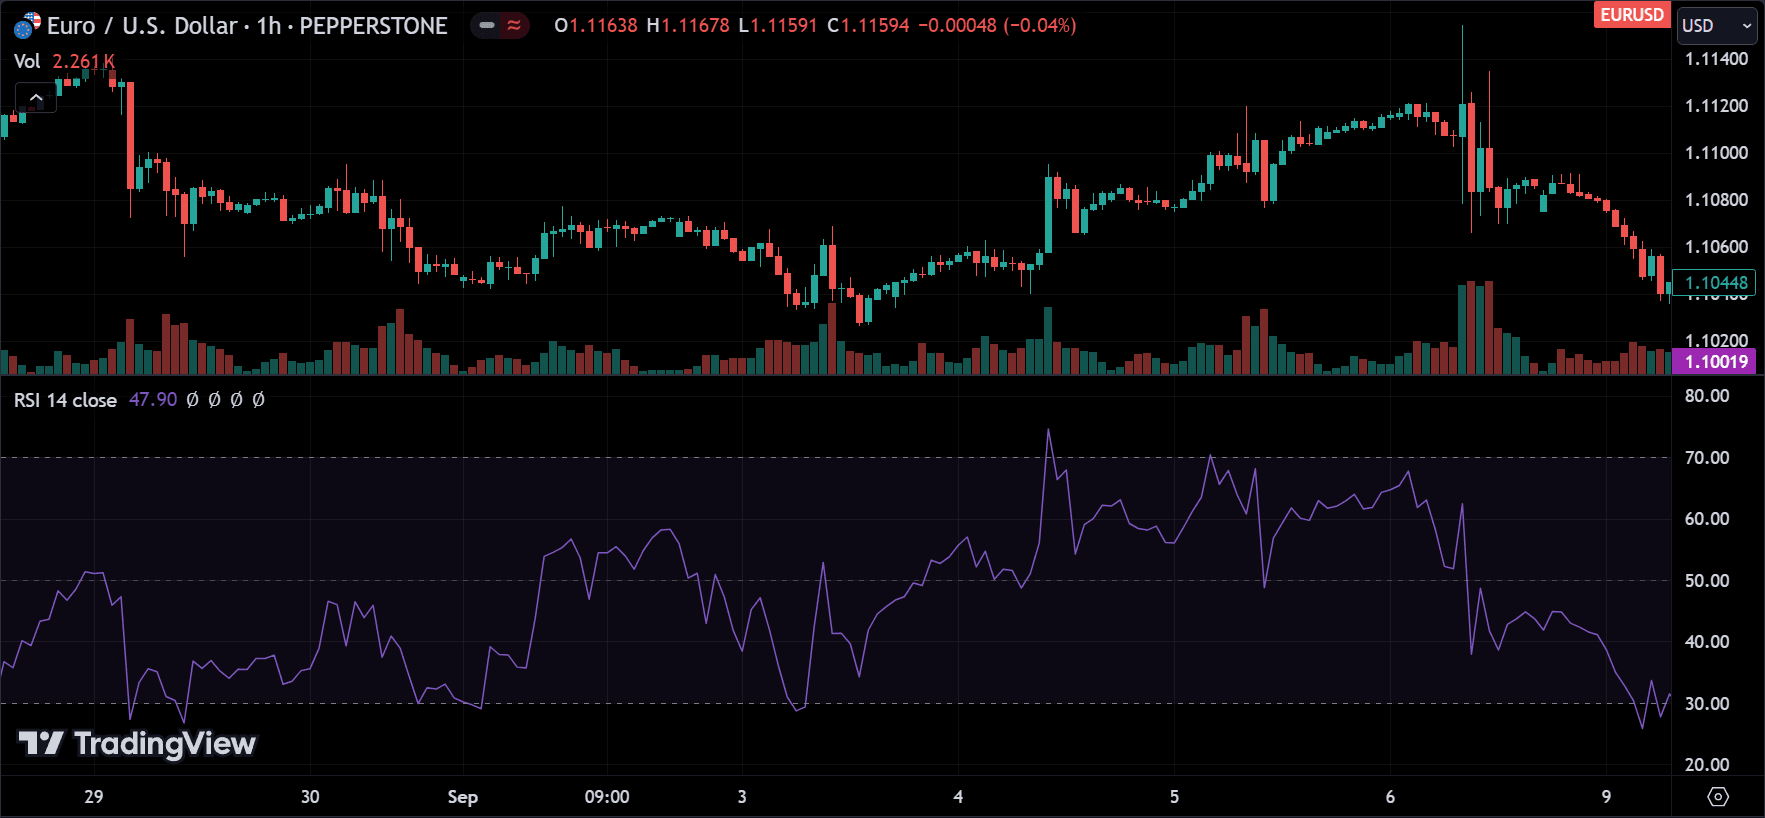
Developed by J. Welles Wilder Jr., the Relative Strength Index (RSI) is a momentum oscillator that measures the speed and change of price movements. It oscillates between 0 and 100 and is primarily used to identify overbought and oversold conditions in the market.
- Overbought: An RSI value above 70 suggests that the asset may be overbought.
- Oversold: An RSI value below 30 indicates that the asset may be oversold.
Why Use RSI?
The RSI helps traders:
- Identify Potential Reversals: Spotting overbought or oversold conditions can signal potential market reversals.
- Confirm Trends: RSI can confirm the strength of a trend when it stays in overbought or oversold territories for extended periods.
- Divergence Analysis: Discrepancies between price movements and RSI values can hint at weakening trends.
The Concept of Contrarian Trading

Contrarian trading involves going against prevailing market trends or sentiments. Contrarian traders believe that markets often overreact to news and that the majority can be wrong, especially at market extremes. By identifying these extremes, contrarian traders aim to enter positions just as the trend is about to reverse.
Understanding Multi-Time Frame Analysis
Multi-time frame analysis involves examining a currency pair across different time frames to gain a comprehensive understanding of its market behavior. This approach helps traders align short-term price movements with longer-term trends, providing better entry and exit opportunities. It also enhances the accuracy of trading signals by confirming market conditions across multiple time perspectives.
Why Use Multiple Time Frames?
Analyzing multiple time frames provides a broader perspective of the market:
- Higher Time Frames: Offer a macro view, identifying major support and resistance levels and overarching trends.
- Lower Time Frames: Provide detailed entry and exit points, capturing short-term price movements.
Benefits
- Enhanced Accuracy: Confirms signals across different time frames, reducing false signals.
- Better Timing: Aligns entries with both short-term and long-term market dynamics.
- Risk Management: Identifies potential risks that may not be visible on a single time frame.
The Multi-Time Frame RSI Contrarian Strategy
Before we dive into the step-by-step implementation of the strategy, let’s first understand how it works. The best way to explain this is by sharing how I applied the strategy during my own experience. So, let’s get started!
Strategy Overview
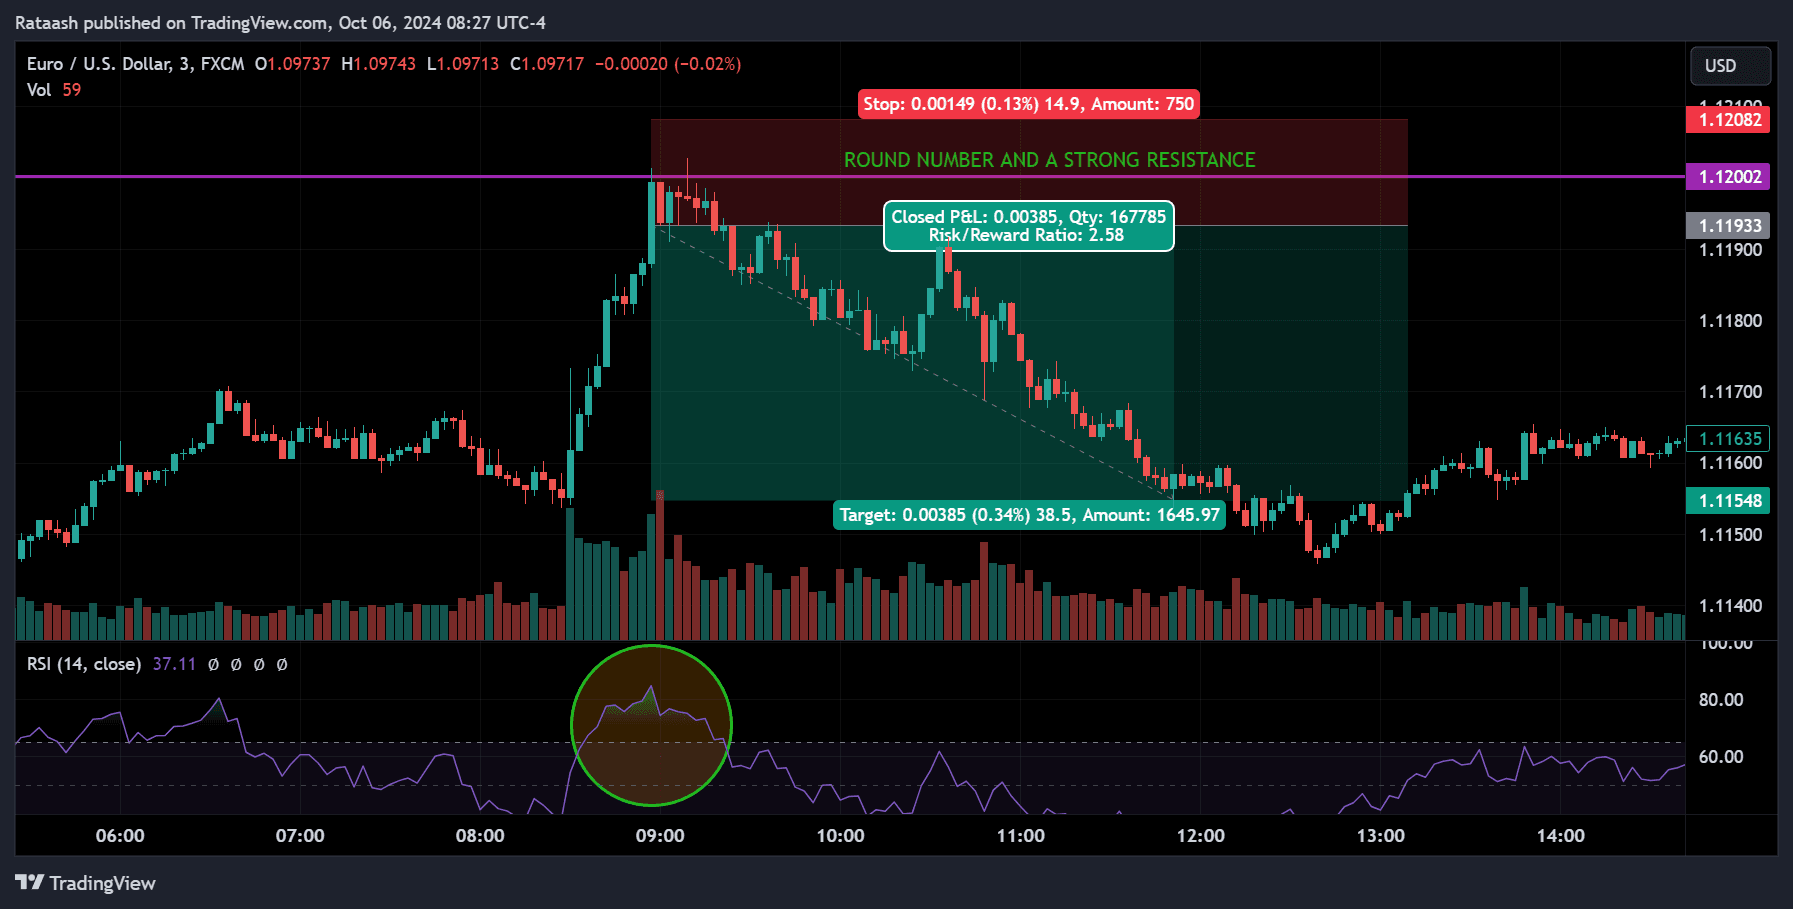
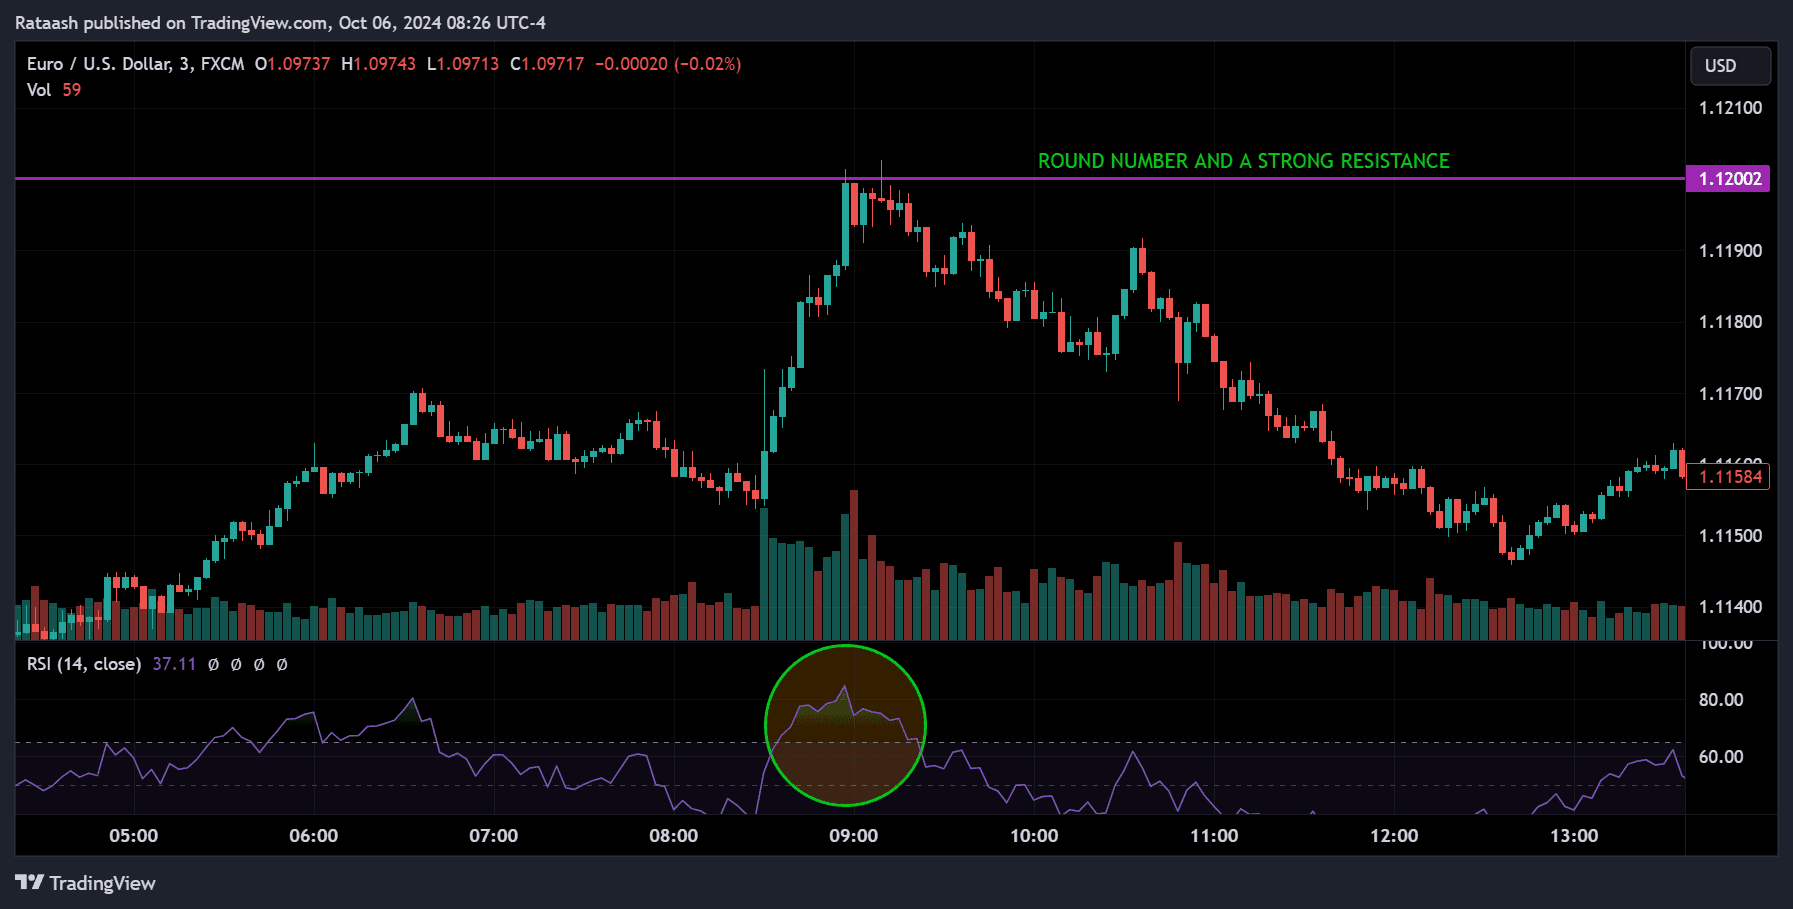
This strategy works better on certain currency pairs than others, and it’s most effective during the main forex sessions like the US and EU sessions. Personally, I applied it during the US session and stopped trading for the day after midday, which means from 8 AM ET to 12 PM ET.
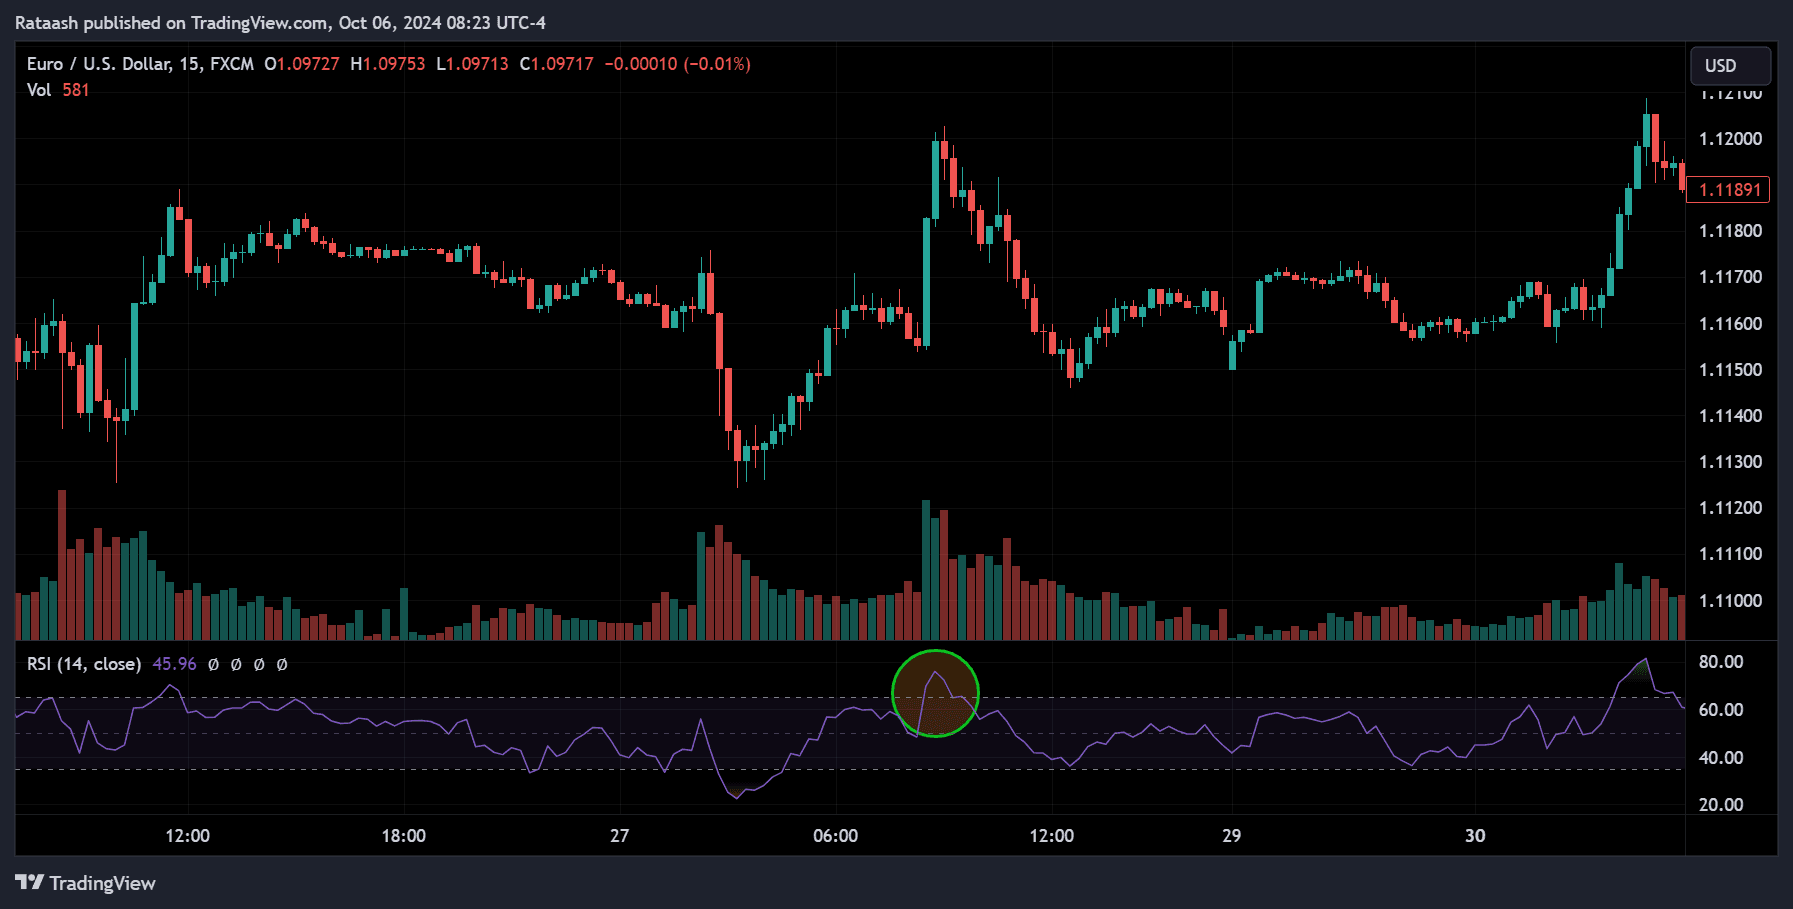
I mainly used the EURUSD pair and worked with two timeframes: the 15-minute chart to spot overbought or oversold conditions and the 3-minute chart for entering and exiting positions. I also adjusted the RSI settings from the default, setting the oversold level to 35 (instead of 30) and the overbought level to 65 (instead of 70). When the RSI on the 15-minute chart reaches an overbought or oversold condition, I then look for a reversal signal on the 3-minute chart. Usually, the 3-minute RSI aligns with the 15-minute chart, but if not, you need to wait for the price to reach that level.

I also paid close attention to price action, focusing on support and resistance levels, as well as candlestick patterns that signal reversals. Most reversals tend to happen around these key support and resistance areas.
I limited myself to just 2 trades per day, and often, one trade was all I needed. If you predict the market correctly, the price will usually move in your favor, and by the time your take-profit (TP) is hit, it’s often near the end of the trading session, close to 12 PM. However, sometimes the first setup might go against you and hit your stop loss, but the second trade typically recovers that loss and generates additional profit. This is why having positive expectancy is crucial. Occasionally, both trades for the day might go against you, and in that case, it’s important to stop trading for the day.
You can easily recover from such situations because the risk-to-reward ratio is usually 1:2 or higher. One good trade can make a significant difference. The key is to have a good batting average, meaning more winning trades than losing ones. It all comes down to mathematics and finding a balance where you can make consistent profits. This is where your effort comes in—you need to backtest, experiment, and find what works best for you. I can’t tell you exactly which method will work, as it’s all about testing and refining your approach.
One important point to mention is that when I tested this strategy, it performed well on days without high-volatility news & macroeconomic events, such as FOMC meetings, unemployment rate releases, monetary policy reports, and speeches from key officials. I made it a point to avoid trading on those days.
Step-by-Step Implementation
Now that you have a basic understanding of what this strategy is about, let’s dive into the step-by-step implementation of it.
First things first, you need to decide whether or not to trade on the day. To do this, check your favorite economic calendar and look for any potential news events that could impact your currency pair. If there are no high-impact events, you’re good to go and can proceed with trading for the day.
Entry Signal
After than you start for looking into entry signals, to do that after 8.00 AM, wait for the 15M RSI to reach either overbought or oversold condition, if its already in that zone, then move onto 3M chart and make sure its RSI also saying the same information, then look for a proper reversal candle stick signals, if you see one then enter a position.
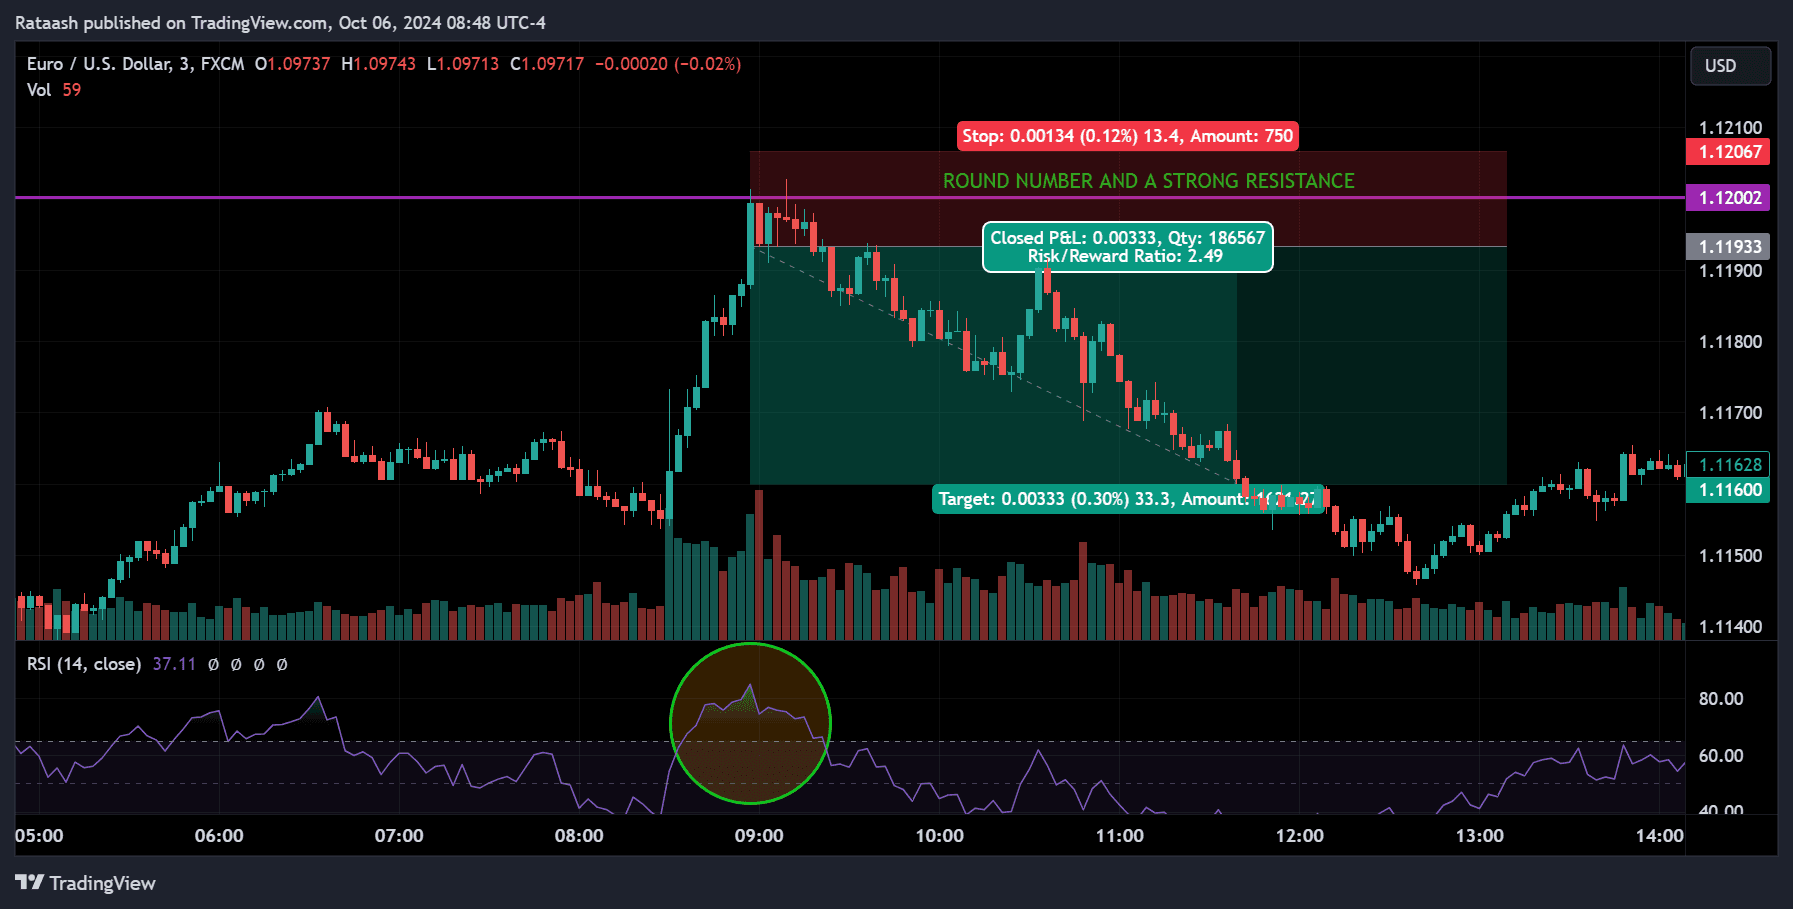
Stop-Loss Signal
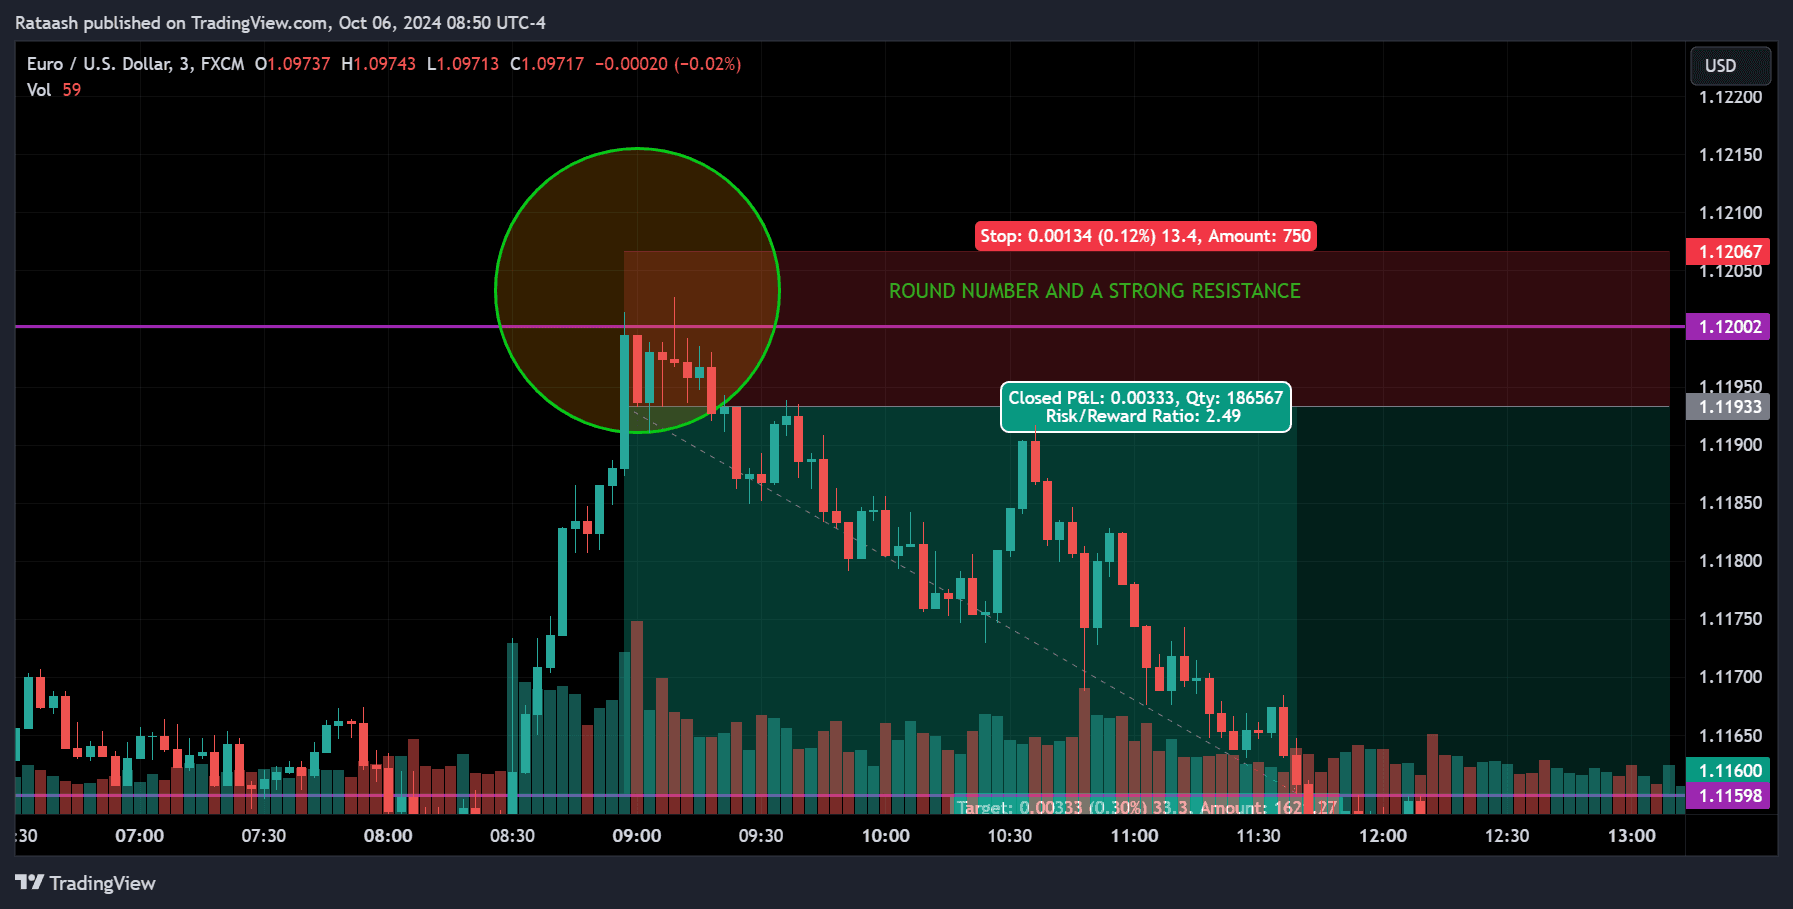
I usually set my stop loss at around 15 pips. This is something you get better at with experience—you need to place your stop loss where it won’t be triggered by normal market volatility but will be activated if the market genuinely moves against you. It’s important to leave enough room for that. In my case, 15 pips worked best. If the stop loss goes above this range, the trade usually ends up being wrong, so I avoid that setup and wait for the next opportunity.
Once you’ve placed your stop loss, you need to quickly adjust your position size according to your risk tolerance. If you’re unsure how to size your trades properly, you can refer to helpful resources on position sizing.
Position sizing is the key reason why this strategy works, so you absolutely cannot ignore it. Properly adjusting your position size based on your risk tolerance ensures that you can manage losses effectively and maximize gains. It’s essential to stick to this principle, as it allows you to maintain consistency and protect your capital over time.
Take Profit Signal
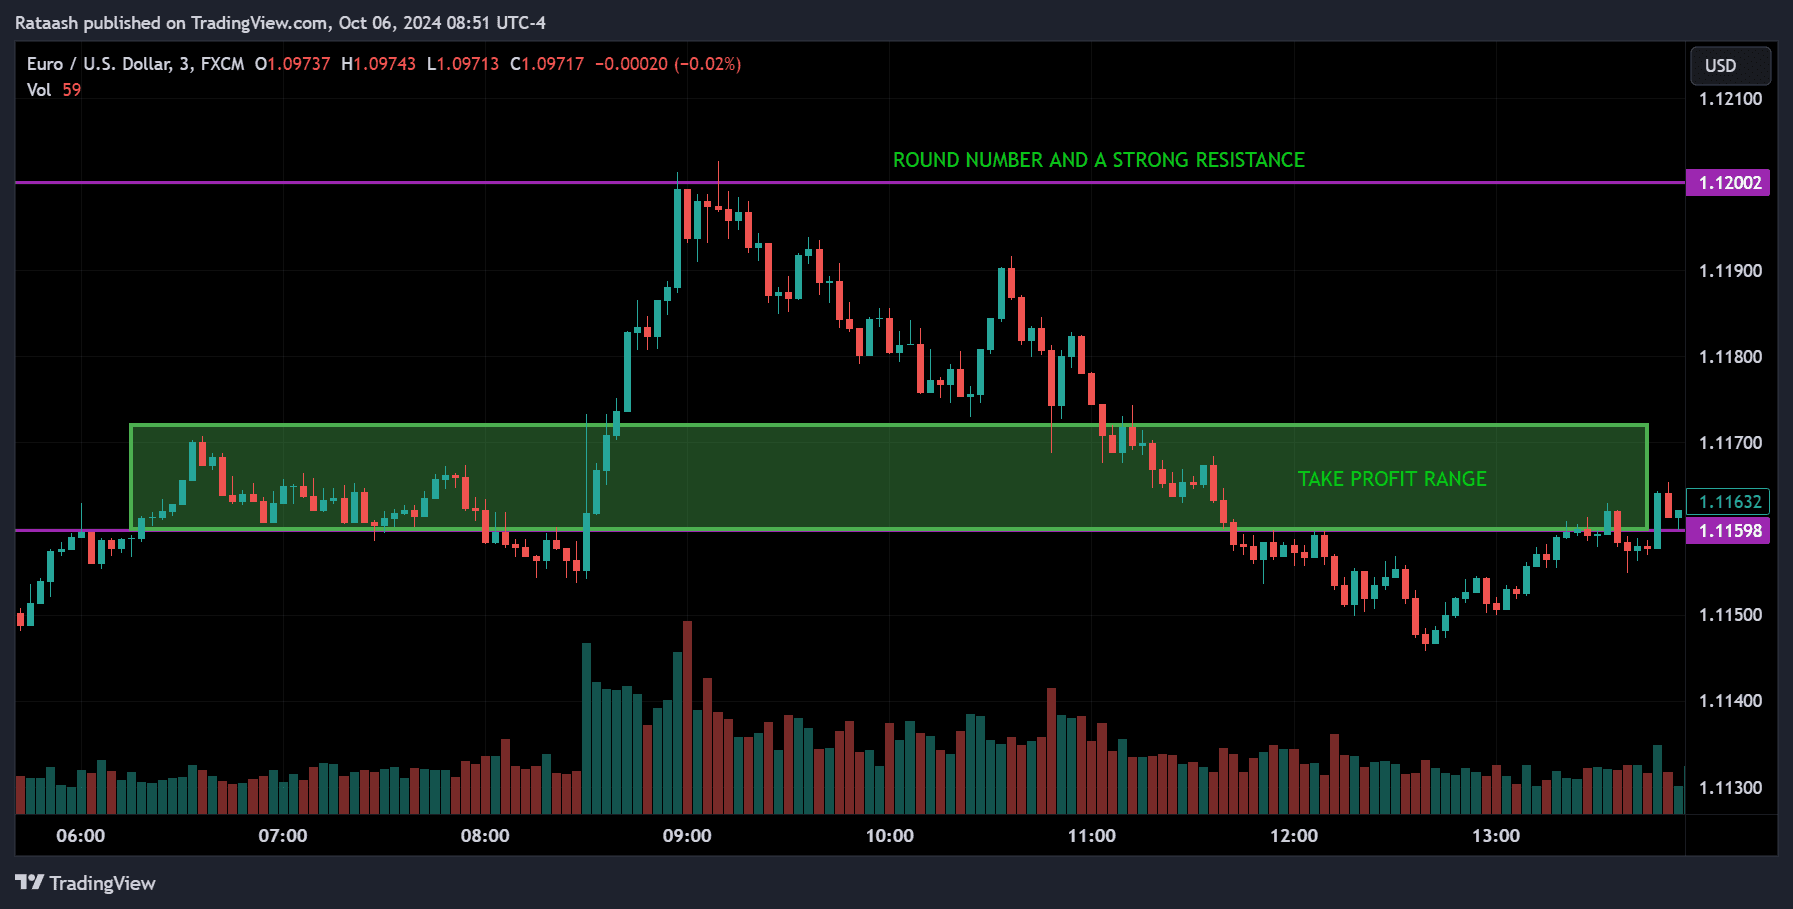
For take profit, I aim for a range of 20 to 30 pips, which usually aligns with the second support or resistance level along the way. I set a simple limit order to lock in profits. If the trade is still running after 12 PM and hasn’t hit either the stop loss or take profit, I manually close the trade—whether it’s in profit or not. This is crucial because sticking to my plan is more important than letting the trade run, as leaving it open beyond my set time has historically resulted in more losses than gains.
Trading Plan Implementation
This is your template for a trading plan. Adjust it according to your preferences, write it down, and make sure to follow it every time you trade:
| STRATEGY | MULTI TIME RSI CONTRARIAN |
| TRADING STYLE | DAY TRADING |
| STRATEGY TYPE | MEAN REVERSION |
| HOLDING PERIOD | FEW HOURS TO CURRENT SESSION END |
| ASSET SELECTION | LIQUID FX PAIRS |
| TIME FRAME | 15M / 1H / 4H / D |
| ENTRY SIGNAL | REVERSALS |
| ENTRY STYLE | SINGLE MARKET ENTRY |
| TAKE PROFIT SIGNAL | PRICE REACHING TARGET SUPPORT OR RESISTANCE LEVELS |
| TAKE PROFIT STYLE | SINGLE LIMIT ORDER |
| POSITION SIZING | SINGLE ENTRY 2% RISK |
| STOP LOSS | 2% RISK, NEAR SUPPORT/RESISTANCE |
| BAIL OUT INDICATORS | STONG FUNDAMENTAL NEWS |
A trading strategy and a trading plan are different. A trading strategy covers the reasoning and details behind why a trade idea should work. On the other hand, a trading plan is a step-by-step guide that helps you decide what actions to take when applying the strategy.
Advantages of the Strategy
- Higher Probability Trades: Combining RSI signals across multiple time frames filters out false signals.
- Contrarian Edge: Capitalizes on market overreactions and inefficiencies.
- Risk Management: Clear entry and exit points aid in effective risk management.
Potential Pitfalls and Considerations
- False Signals: RSI can remain in overbought or oversold territories for extended periods in strong trends.
- Lagging Indicator: RSI is based on historical data and may lag current price action.
- Market Volatility: Sudden news events can disrupt technical signals.
Risk Mitigation
- Stay Informed: Be aware of economic calendars and news events that may heavily impact the market, and avoid trading on those days.
- Proper Position Sizing: Never risk more than a small percentage of your trading capital on a single trade. proper position sizing is a must for risk management.
Conclusion
The Multi-Time Frame RSI Contrarian Trading Strategy offers a structured approach to identifying potential market reversals in the Forex market. By analyzing RSI across different time frames and adopting a contrarian stance, traders can exploit overbought or oversold conditions more effectively. However, like all trading strategies, it requires discipline, proper risk management, and continuous practice to master.
Disclaimer
Trading Forex involves significant risk and may not be suitable for all investors. The information provided in this article is for educational purposes only and should not be considered financial advice. Always conduct your own research and consult with a licensed financial advisor before making any trading decisions.