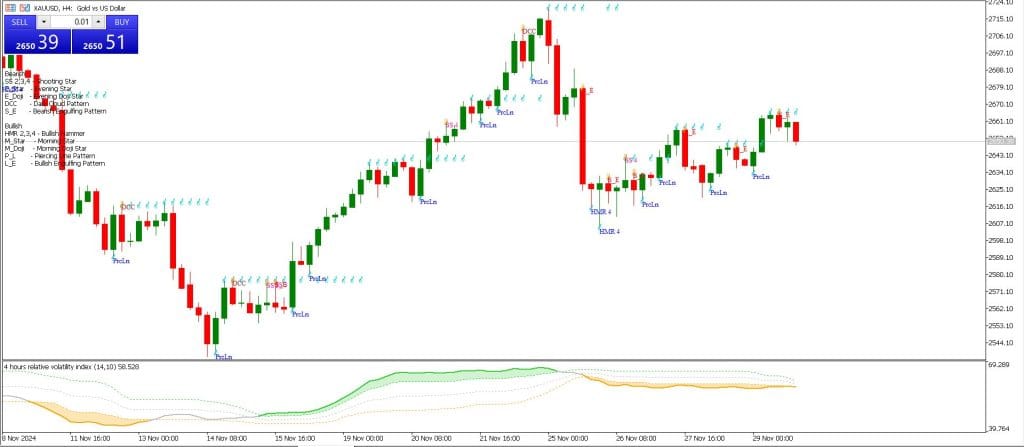
If you’ve been trading forex for a while, you know how challenging it can be to filter out the noise and focus on meaningful signals. That’s where the Relative Volatility Index and Japanese Candlesticks MT5 Strategy come in. Together, they make a powerful combo that helps you spot high-probability trades by blending volatility analysis with price action.
This strategy is all about timing. The RVI tells you whether the market is gaining momentum or losing steam, while candlestick patterns give you visual confirmation of what’s happening in real time. Let me break it down step by step.
What is the Relative Volatility Index (RVI)?
The RVI measures the market’s volatility while factoring in the direction of price movement. It works on a scale from 0 to 100:
- Above 50: Indicates bullish volatility—momentum is pushing upward.
- Below 50: Suggests bearish volatility—momentum is pointing downward.
What’s great about the RVI is how it helps you confirm the strength of a trend. If the price is moving up but the RVI isn’t following, that could mean the trend is weakening. On the flip side, if both the price and RVI are aligned, it’s a good sign the trend has strength behind it.

What Are Japanese Candlestick Patterns?
Candlestick patterns are your bread and butter for reading price action. They show you whether buyers or sellers are in control and can indicate potential reversals or trend continuations.
Some of the key patterns to watch for include:
- Bullish Engulfing: A strong green candle that completely engulfs the previous red candle, signaling buyer strength.
- Hammer: A small body with a long lower wick, showing buyers stepping in after sellers tried to push the price down.
- Bearish Engulfing: A strong red candle engulfs the previous green candle, indicating selling pressure.
- Shooting Star: A small body with a long upper wick, showing sellers gaining control after buyers pushed the price up.
Why Combine These Two?
The RVI and candlestick patterns complement each other perfectly. Candlesticks are great for spotting potential setups, but they can give false signals, especially in choppy markets. The RVI acts as a filter, confirming whether the market has the momentum to back up what the candlesticks are telling you.
How to Trade the Strategy
Here’s how to put this strategy into action, step by step.
Buy Setup (Going Long)
- Check the RVI: Ensure the RVI is above 50, indicating bullish momentum.
- Look for a Bullish Candlestick Pattern: Wait for confirmation with one of these:
- Bullish Engulfing: A strong green candle fully engulfs the previous red candle.
- Hammer: A small body with a long lower wick, signaling buyer strength.
- Enter the Trade: Place a buy order just above the high of the confirming candlestick. This ensures you’re entering once the market confirms the move.
- Set Your Stop-Loss: Place your stop-loss just below the low of the confirming candlestick to protect against sudden reversals.
- Take Profit: Aim for the nearest resistance level or use a risk-reward ratio of at least 1:2. For example, if your stop-loss is 20 pips, your take-profit should be at least 40 pips.
Sell Setup (Going Short)
- Check the RVI: Ensure the RVI is below 50, signaling bearish momentum.
- Look for a Bearish Candlestick Pattern: Wait for confirmation with one of these:
- Bearish Engulfing: A strong red candle fully engulfs the previous green candle.
- Shooting Star: A small body with a long upper wick, indicating selling pressure.
- Enter the Trade: Place a sell order just below the low of the confirming candlestick. This confirms that sellers are taking control.
- Set Your Stop-Loss: Place your stop-loss just above the high of the confirming candlestick to limit your risk.
- Take Profit: Target the nearest support level or use a 1:2 risk-reward ratio. Adjust based on market conditions.
Download a Collection of Indicators, Courses, and EA for FREE
Why This Strategy Works
This strategy is effective because it combines two key elements:
- RVI for Confirmation: The RVI filters out false signals by confirming whether the market has the momentum to support a trade.
- Candlestick Patterns for Precision: Candlesticks give you clear entry signals based on price action and market psychology.
By using these tools together, you’re reducing the guesswork and focusing on high-probability setups.
Tips for Success
- Focus on Active Sessions: Use this strategy during the London and New York sessions when the market is most active.
- Watch for Divergences: If the price makes a new high but the RVI doesn’t, it could signal a weakening trend and potential reversal.
- Be Patient: Wait for clear signals. If the RVI and candlestick patterns don’t align, it’s better to skip the trade.
- Practice on a Demo Account: Before going live, test this forex strategy on a demo account and learn how the indicators interact.
Free Download Relative Volatility Index and Japanese Candlestick MT5 Strategy
Read More Hidden Signals Forex Trading Strategy
Wrapping It Up
The Relative Volatility Index and Japanese Candlestick MT5 Strategy are great ways to bring structure and confidence to your trading. By combining the RVI’s volatility analysis with the visual clarity of candlestick patterns, you’re getting a good solid edge in the forex market.
Try this strategy on your MT5 platform, and don’t forget to tweak it to fit your trading style. As always, stay disciplined, manage your risk, and trust the process.
Happy trading!


