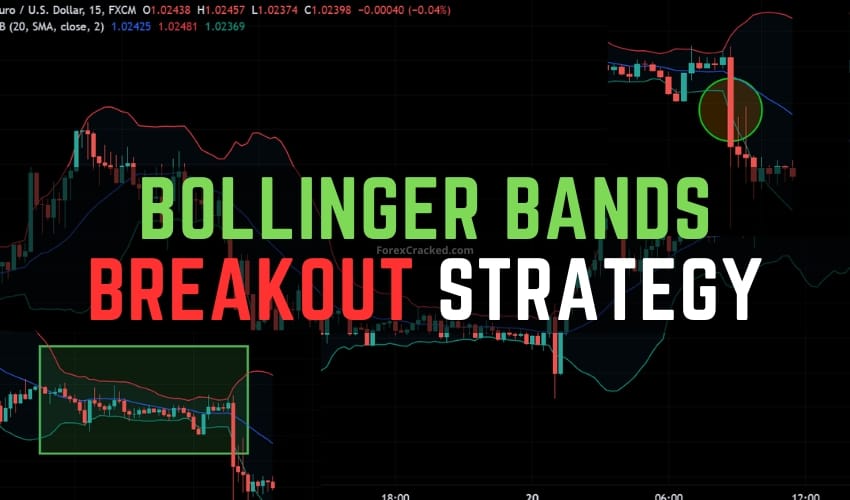
Bollinger Bands are one of the most widely recognized and frequently utilized technical analysis tools in the forex market. Developed by John Bollinger in the early 1980s, these bands help traders identify market volatility and potential price extremes. At their core, Bollinger Bands consist of three lines plotted on a price chart:
- The Middle Band – Typically a simple moving average (SMA).
- The Upper Band – This is the SMA plus a certain number of standard deviations.
- The Lower Band – This is the SMA minus a certain number of standard deviations.
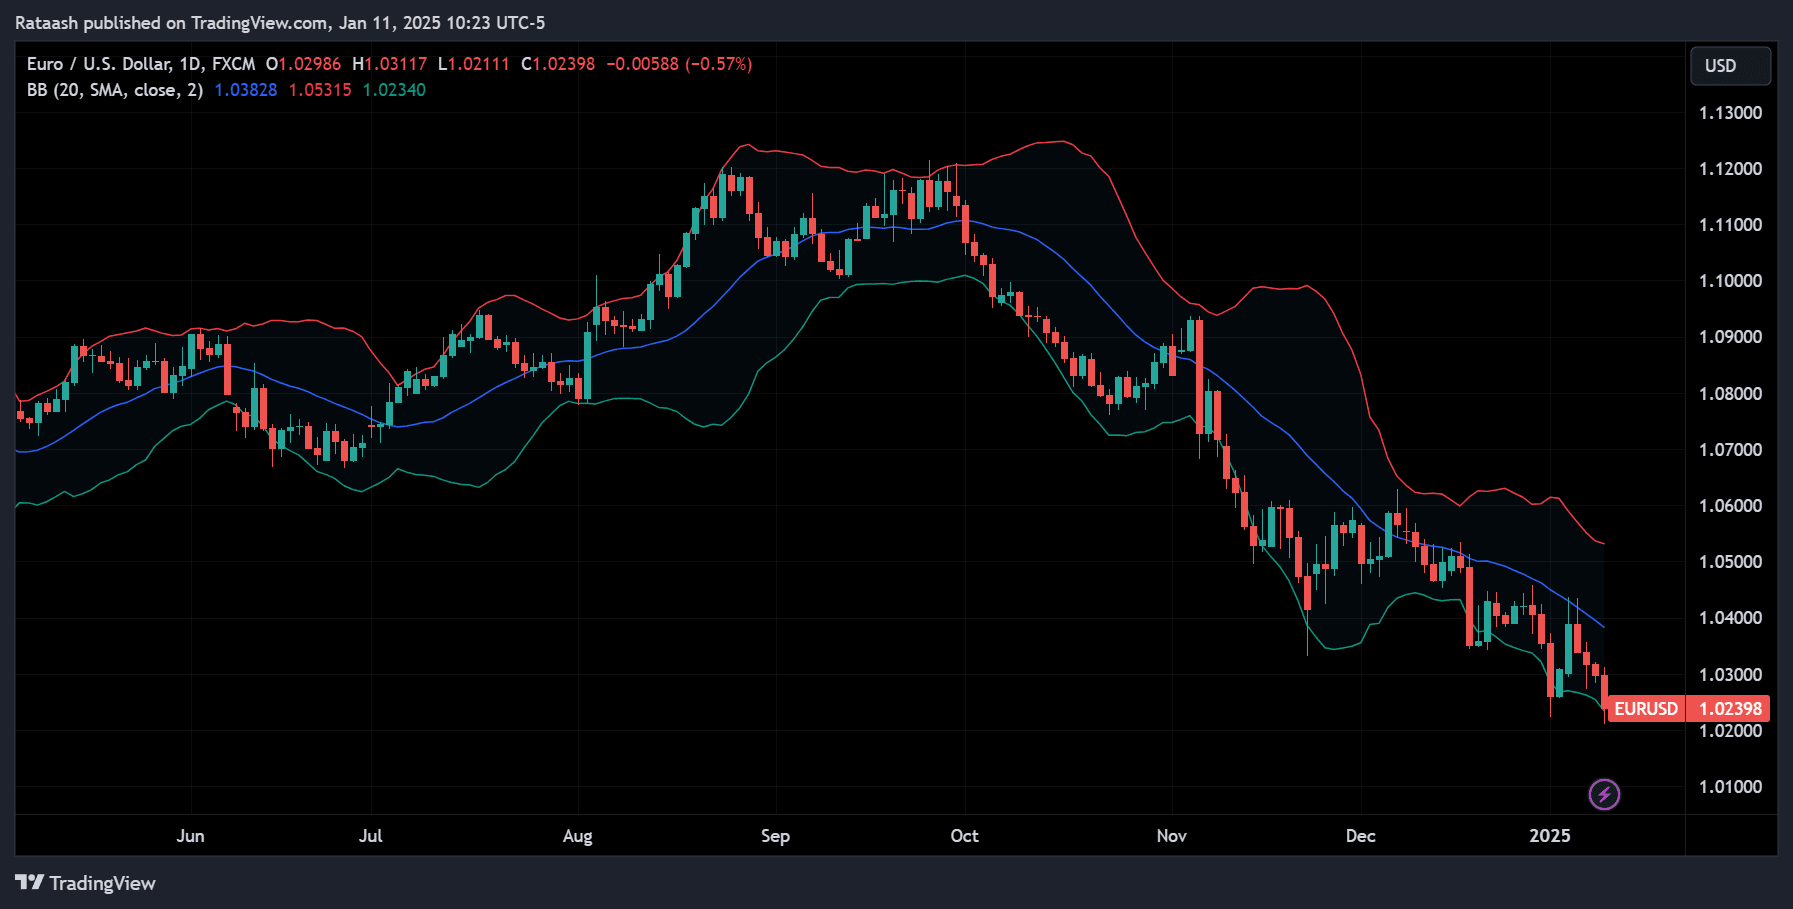
Bollinger Bands are a dynamic envelope that expands and contracts based on the market’s volatility. The concept behind Bollinger Bands is that when volatility increases, the distance between the upper and lower bands widens; when volatility decreases, the distance tightens. Traders can use this expansion and contraction to gauge whether the market is in a state of heightened activity or is trading quietly.
Why are they so popular? Because they can be applied to virtually any market or timeframe, including forex, stocks, futures, and cryptocurrencies. Bollinger Bands can help identify overbought and oversold conditions, as well as potential breakout opportunities both of which are vital for successful forex trading.
In this article, we’ll focus on one particular application of Bollinger Bands: the Bollinger Bands Breakout Strategy. We’ll explain how to implement this strategy step by step, discuss how to optimize your trades and share tips on how to manage risk effectively.
Table of Contents
Why Use Bollinger Bands for Forex Trading
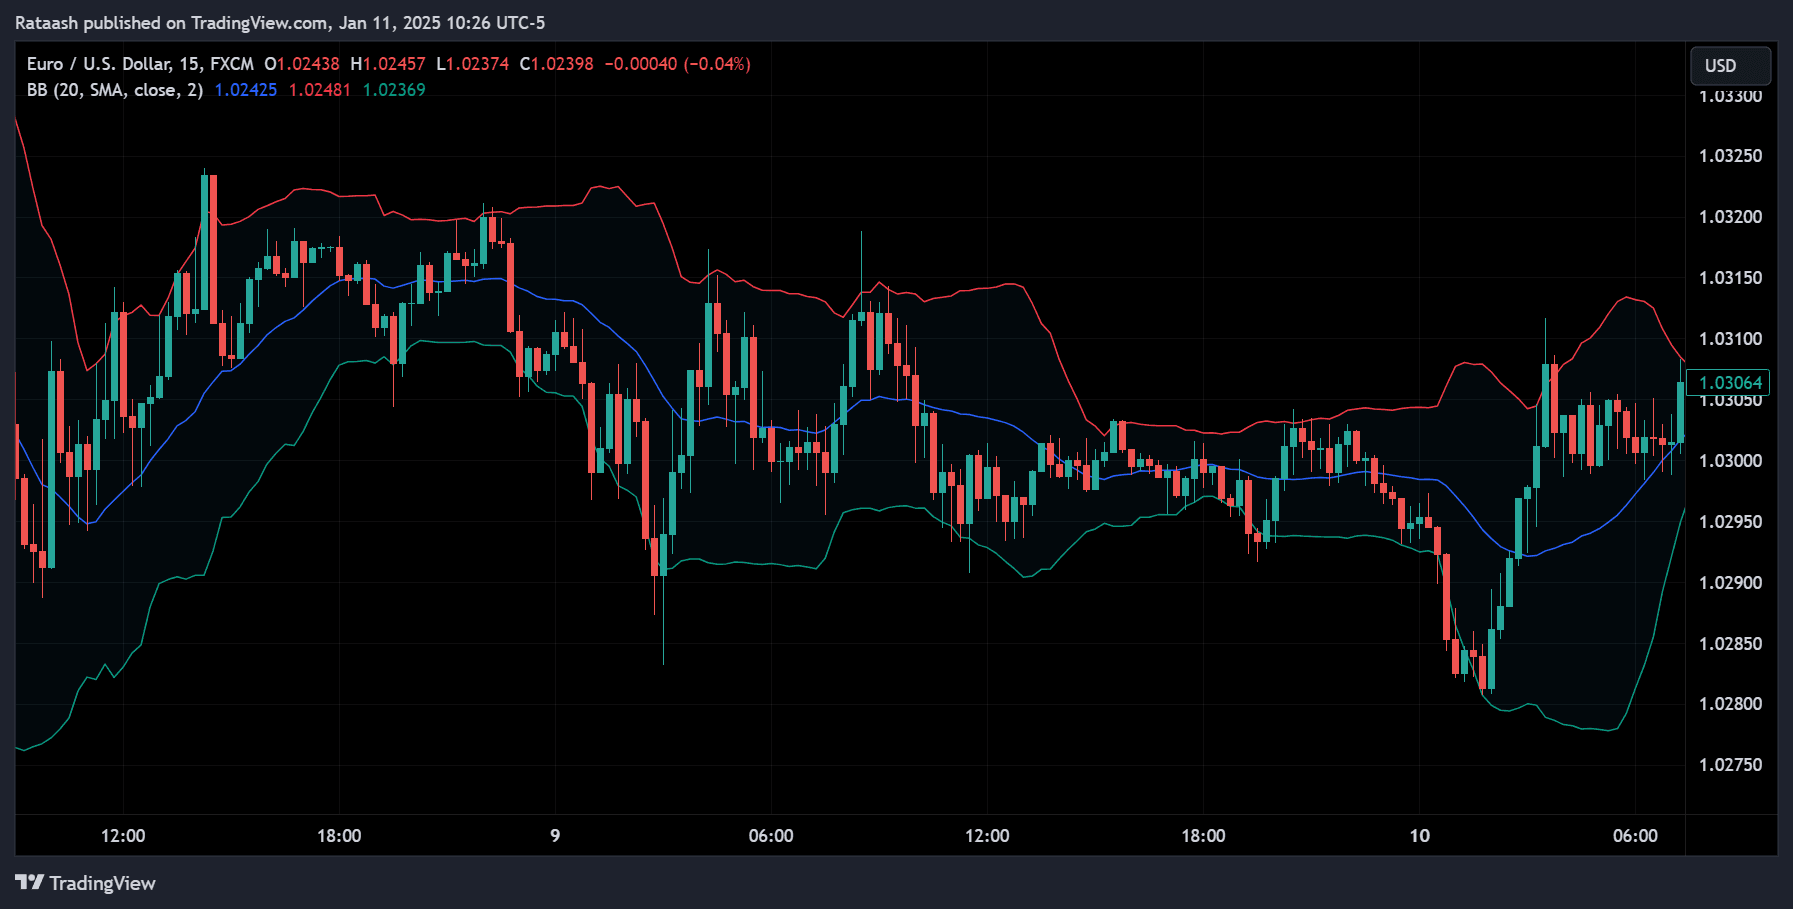
The forex market is known for its liquidity and volatility. Currency prices can swing significantly in short periods, especially during major economic news releases or shifts in central bank policies. Bollinger Bands are specifically designed to:
- Track volatility – By measuring standard deviations around a moving average, Bollinger Bands indicate when volatility is high or low.
- Identify price extremes – Price touching or crossing the upper or lower band can highlight potential overbought or oversold levels, prompting traders to look for reversals or continuations.
- Highlight trading opportunities – Periods of low volatility (when the bands contract) often precede major price movements. Recognizing these so-called “squeeze” phases can help traders anticipate breakouts.
- Adapt to changing market conditions – The bands adjust themselves automatically based on recent price data, making them dynamic rather than static indicators.
Because of these qualities, Bollinger Bands are well-suited for strategies that revolve around breakouts, particularly in the fast-moving forex market. This is crucial for active traders who look for short-term or medium-term gains.
Key Components of Bollinger Bands
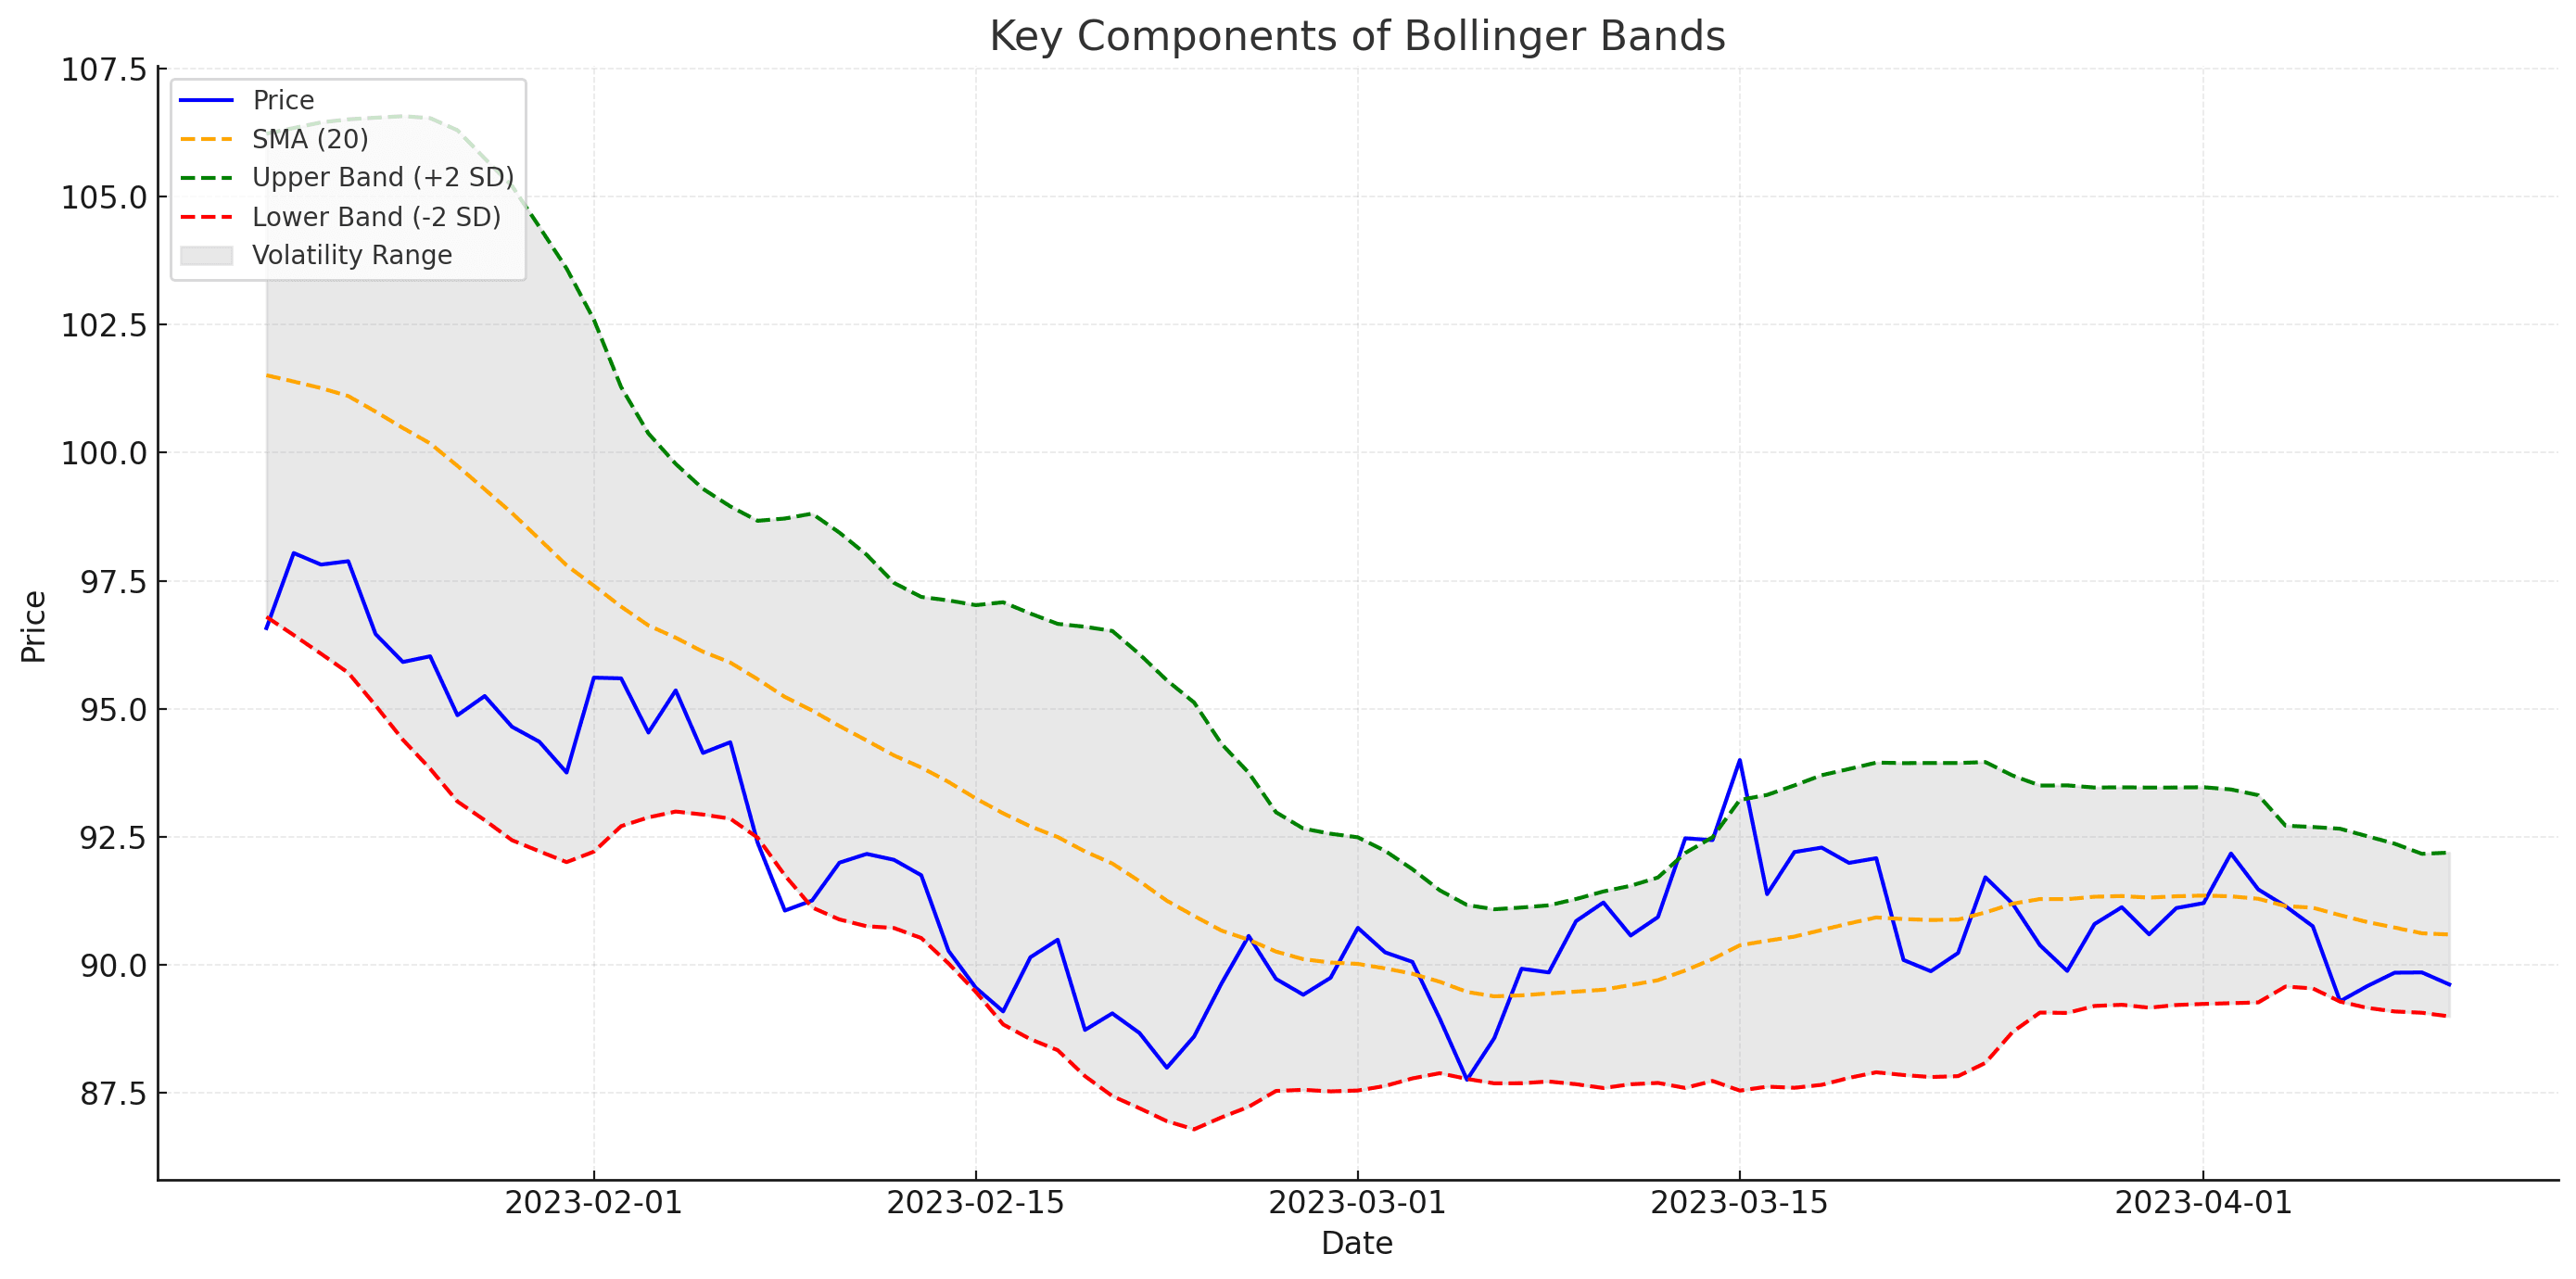
- Simple Moving Average (SMA): The default number of periods used in the middle band is typically 20. This number can be adjusted based on your personal trading style and the currency pair volatility you’re trading.
- Standard Deviations: Bollinger Bands are usually set to 2 standard deviations above and below the SMA. This is the typical setting John Bollinger recommended, as around 95% of price action tends to stay within 2 standard deviations of the average under a normal distribution assumption. However, traders sometimes use 1.5 or 2.5 standard deviations to tailor the bandwidth more precisely.
- Volatility: The primary reason for the bands’ expansion and contraction is market volatility. When volatility is low, bands contract; when volatility is high, they expand.
- Price Action and Candlestick Patterns: While Bollinger Bands can function as a standalone indicator, many traders also pay attention to candlestick patterns (e.g., Doji, engulfing candles) and chart formations (e.g., triangles, wedges) to confirm signals.
Note: Bollinger Bands should not be used as a singular tool to predict future price movement in isolation. Instead, they provide a framework within which you can apply additional technical or fundamental analysis to make informed trading decisions.
How Bollinger Bands Are Calculated
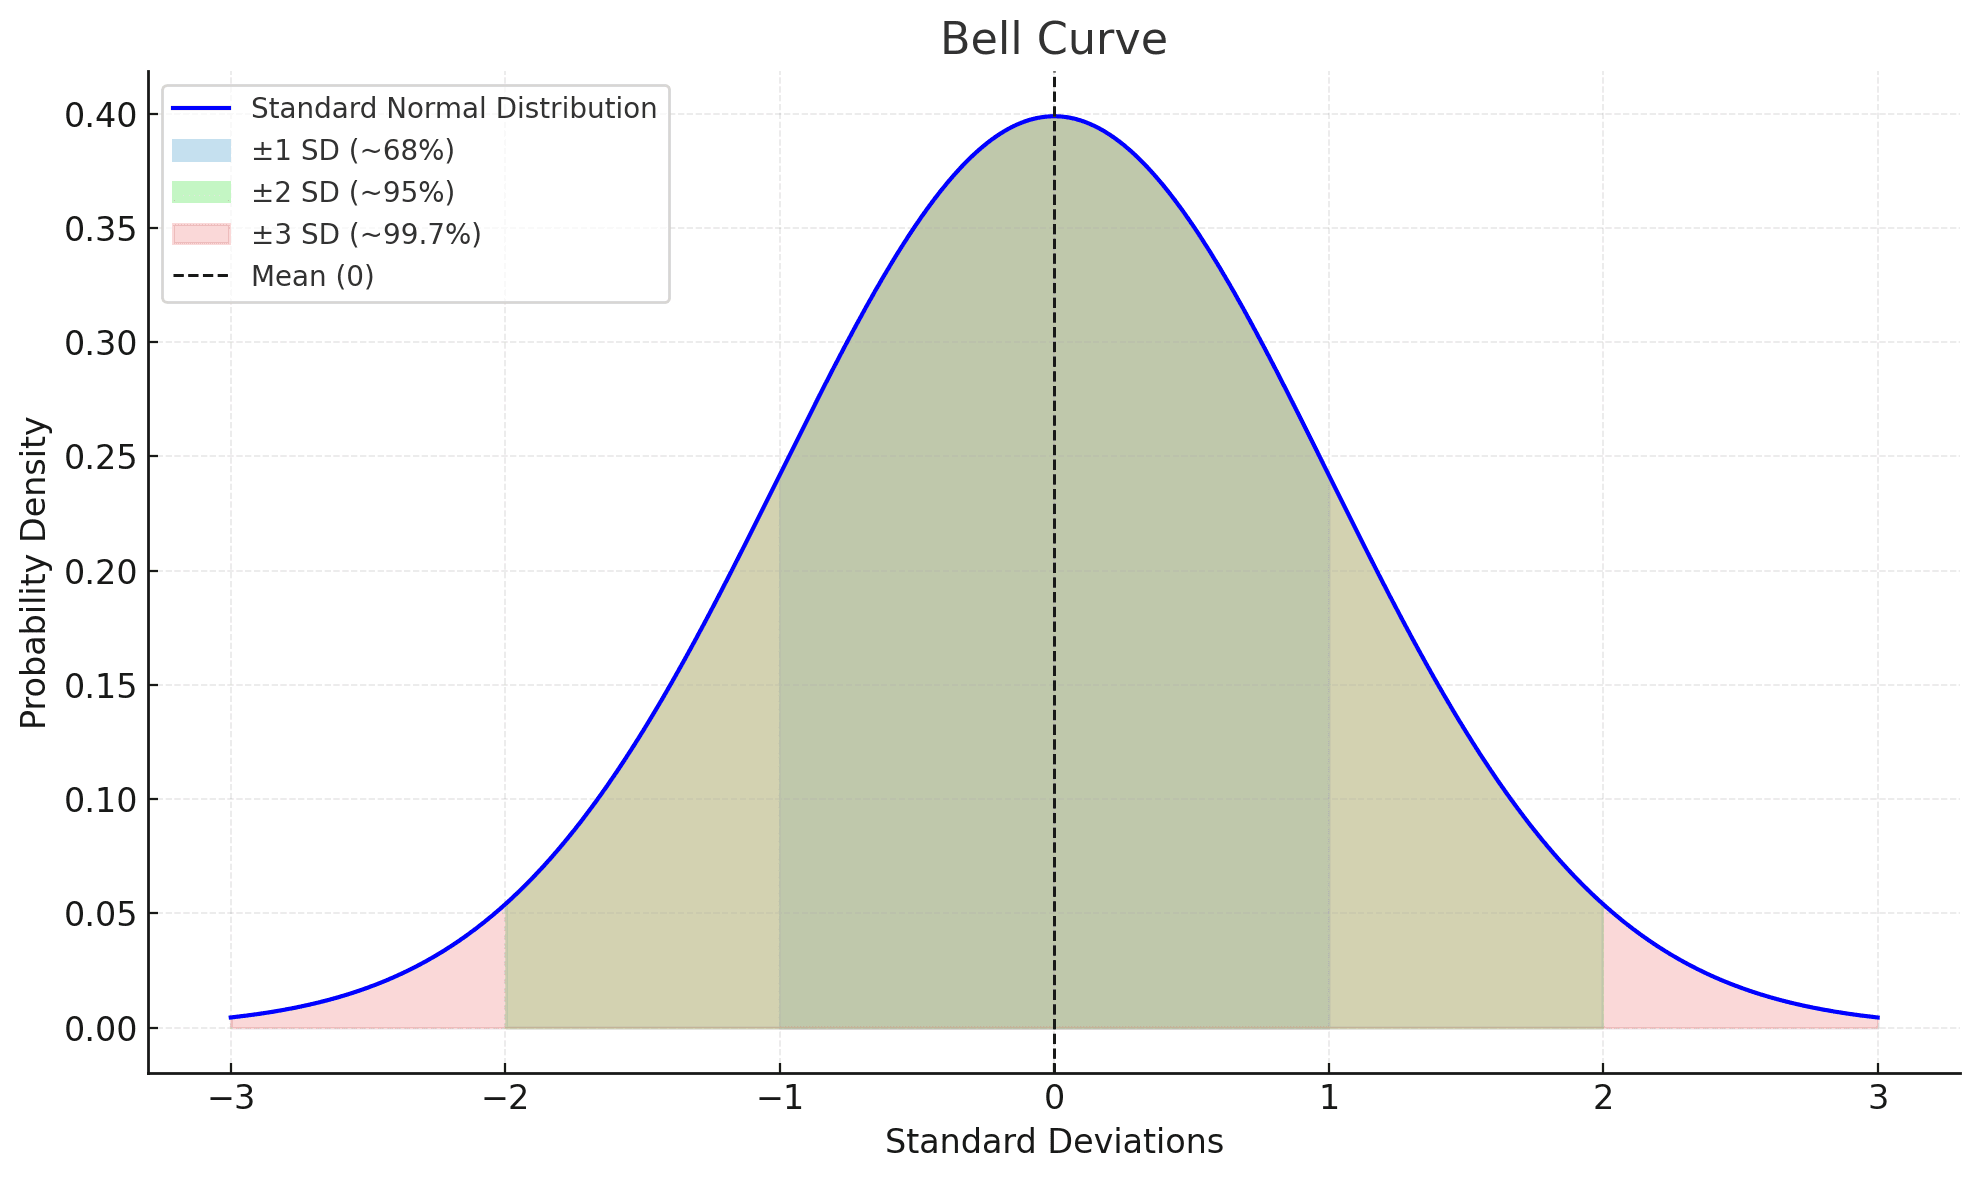
Bollinger Bands are constructed using the following approach:
Calculate the 20-day Simple Moving Average (SMA):
SMA = Sum of closing prices for the last 20 periods / 20
Calculate the Standard Deviation: For each of those 20 periods, determine how far the price deviated from the SMA. Then, sum the squares of those deviations and divide by the total number of observations to get the variance. Finally, take the square root to get the standard deviation.
Upper Band:
Upper Band = SMA + k × Standard Deviation
Where k is typically 2.
Lower Band:
Lower Band = SMA − k × Standard Deviation
This mathematical formulation ensures that when price volatility increases, the standard deviation increases, pushing the upper and lower bands farther apart. Conversely, when volatility decreases, the bands move closer together.
Different Settings for Bollinger Bands
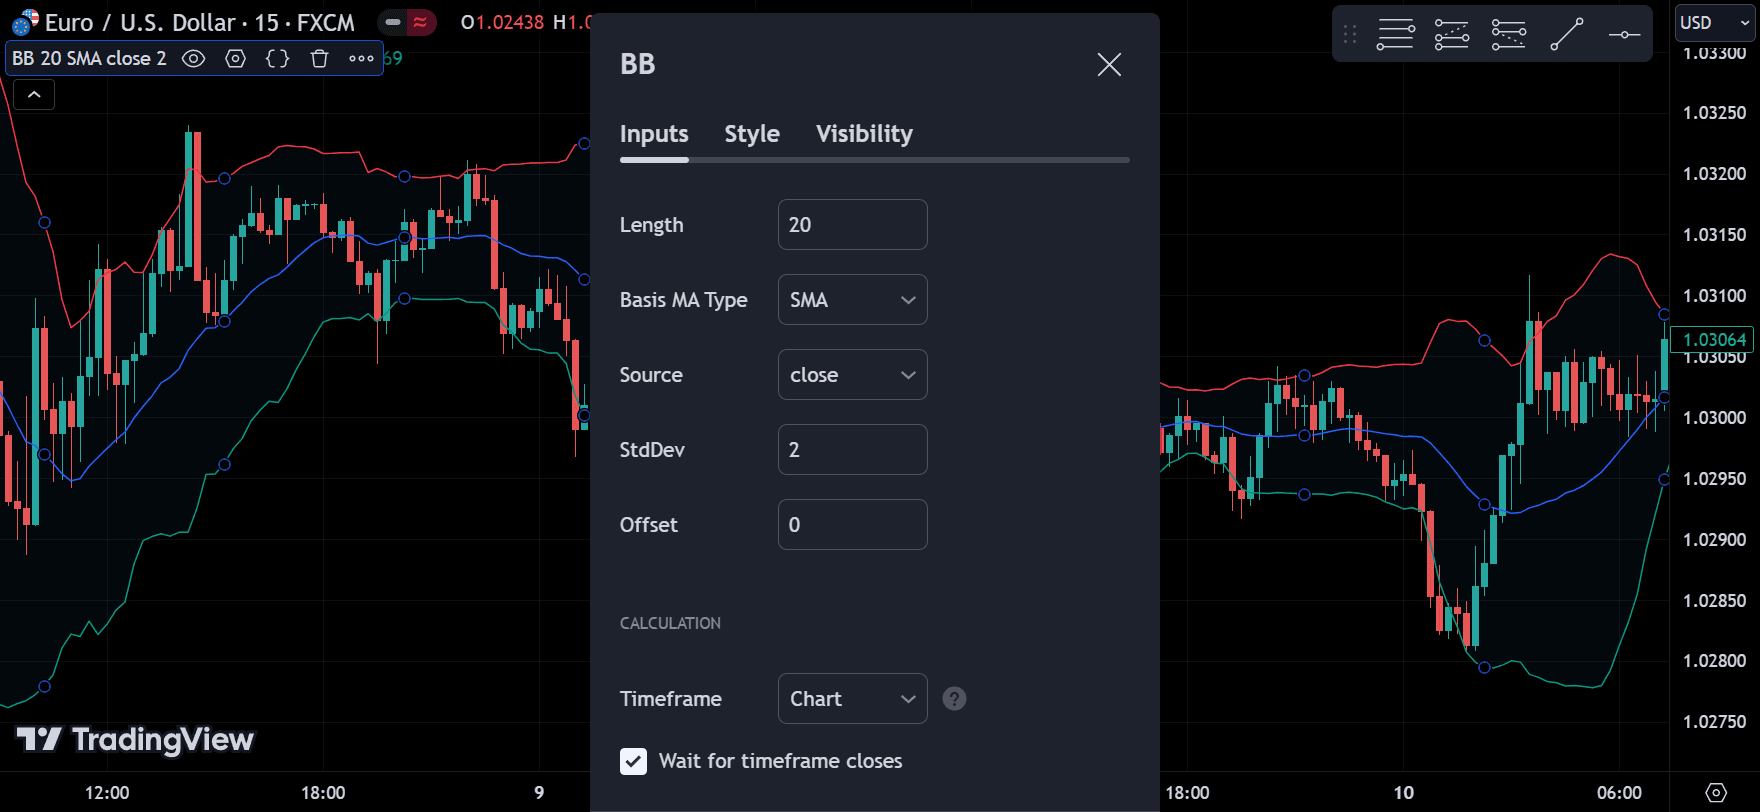
Although the default setting (20-period SMA, 2 standard deviations) is the most common, variations can be made to suit different trading environments:
- Short-term trading: Some traders prefer a 10-day SMA with 1.5 standard deviations for more sensitive signals.
- Long-term trading: Swing or position traders who hold trades for weeks may use a 50-day SMA with 2.5 standard deviations to capture larger market moves.
- Variations in standard deviation: Using 1 standard deviation or 2.5 can help highlight either more frequent trading signals (1 SD) or fewer but potentially stronger signals (2.5 SD).
The key is to test different settings on your specific currency pairs and timeframes, as each market can have unique volatility characteristics.
Understanding Breakouts in Forex
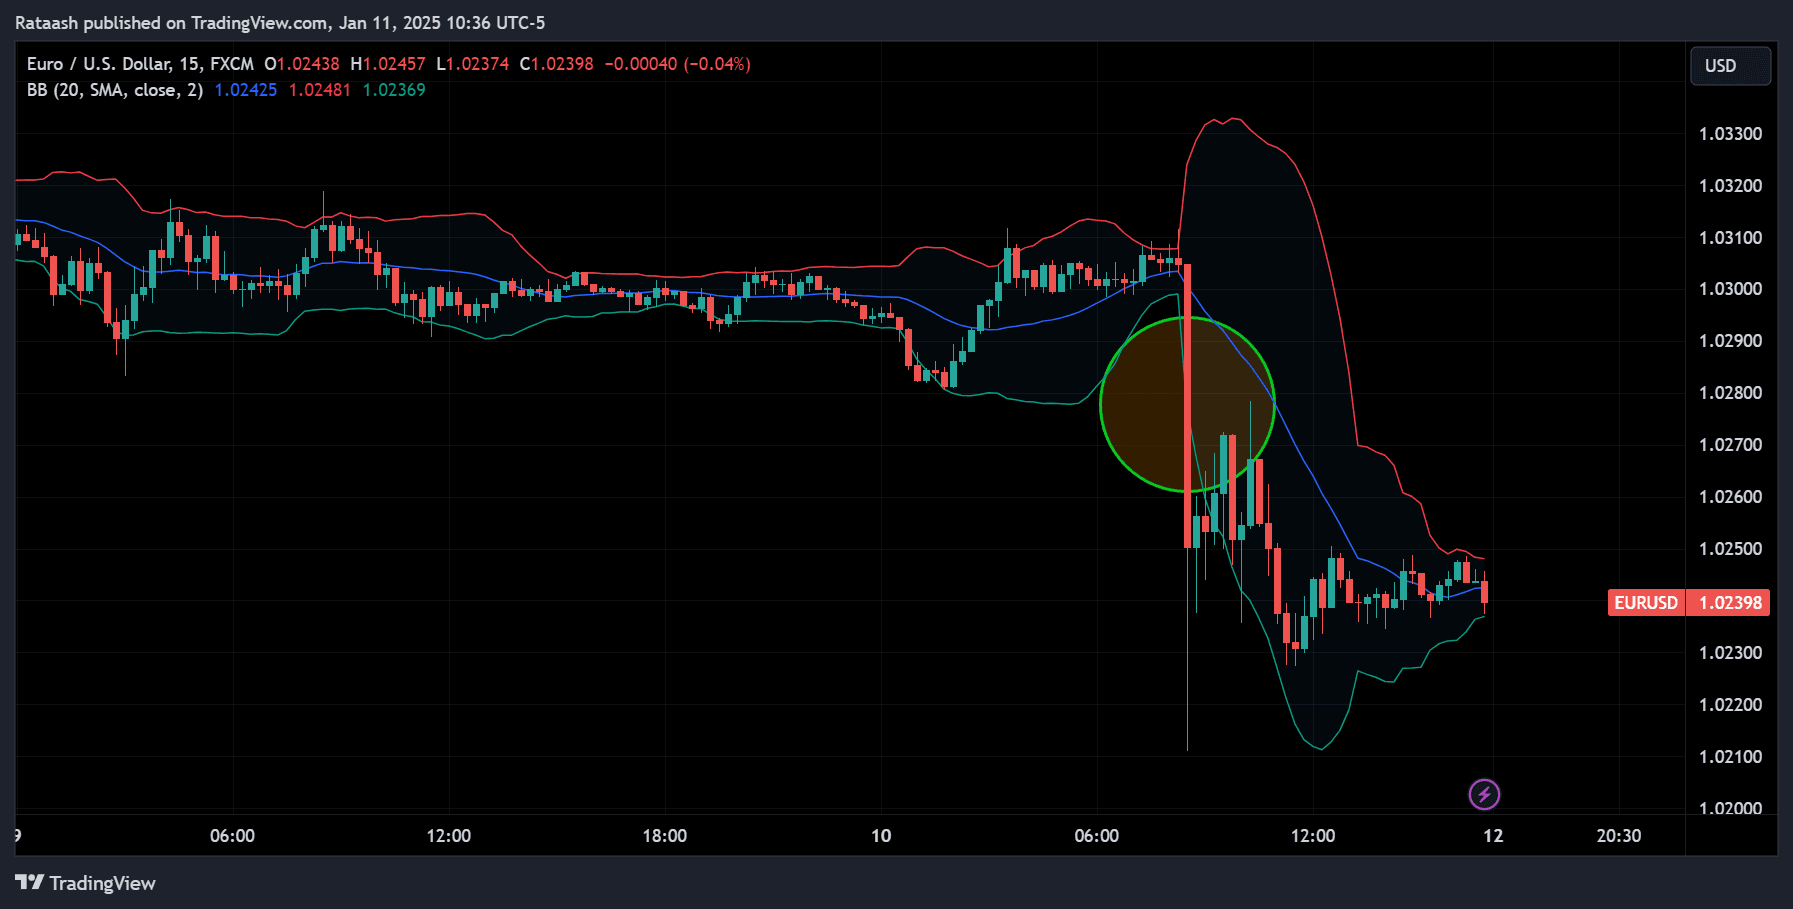
A breakout occurs when the price decisively moves beyond a defined support or resistance level (which Bollinger Bands can sometimes indicate). Breakouts are often accompanied by an increase in trading volume and volatility. In the context of Bollinger Bands, traders often look for situations when:
- Price breaks above the upper band: A strong move beyond the upper band can signal a bullish breakout.
- Price breaks below the lower band: A strong move beyond the lower band can signal a bearish breakout.
- The bands squeeze tightly together: This “squeeze” indicates a period of low volatility, which often precedes a big price move—either up or down.
Spotting a breakout early allows traders to position themselves near the start of a potentially significant price movement, thereby improving the potential risk-to-reward ratio.
Bollinger Bands Breakout Strategy Overview
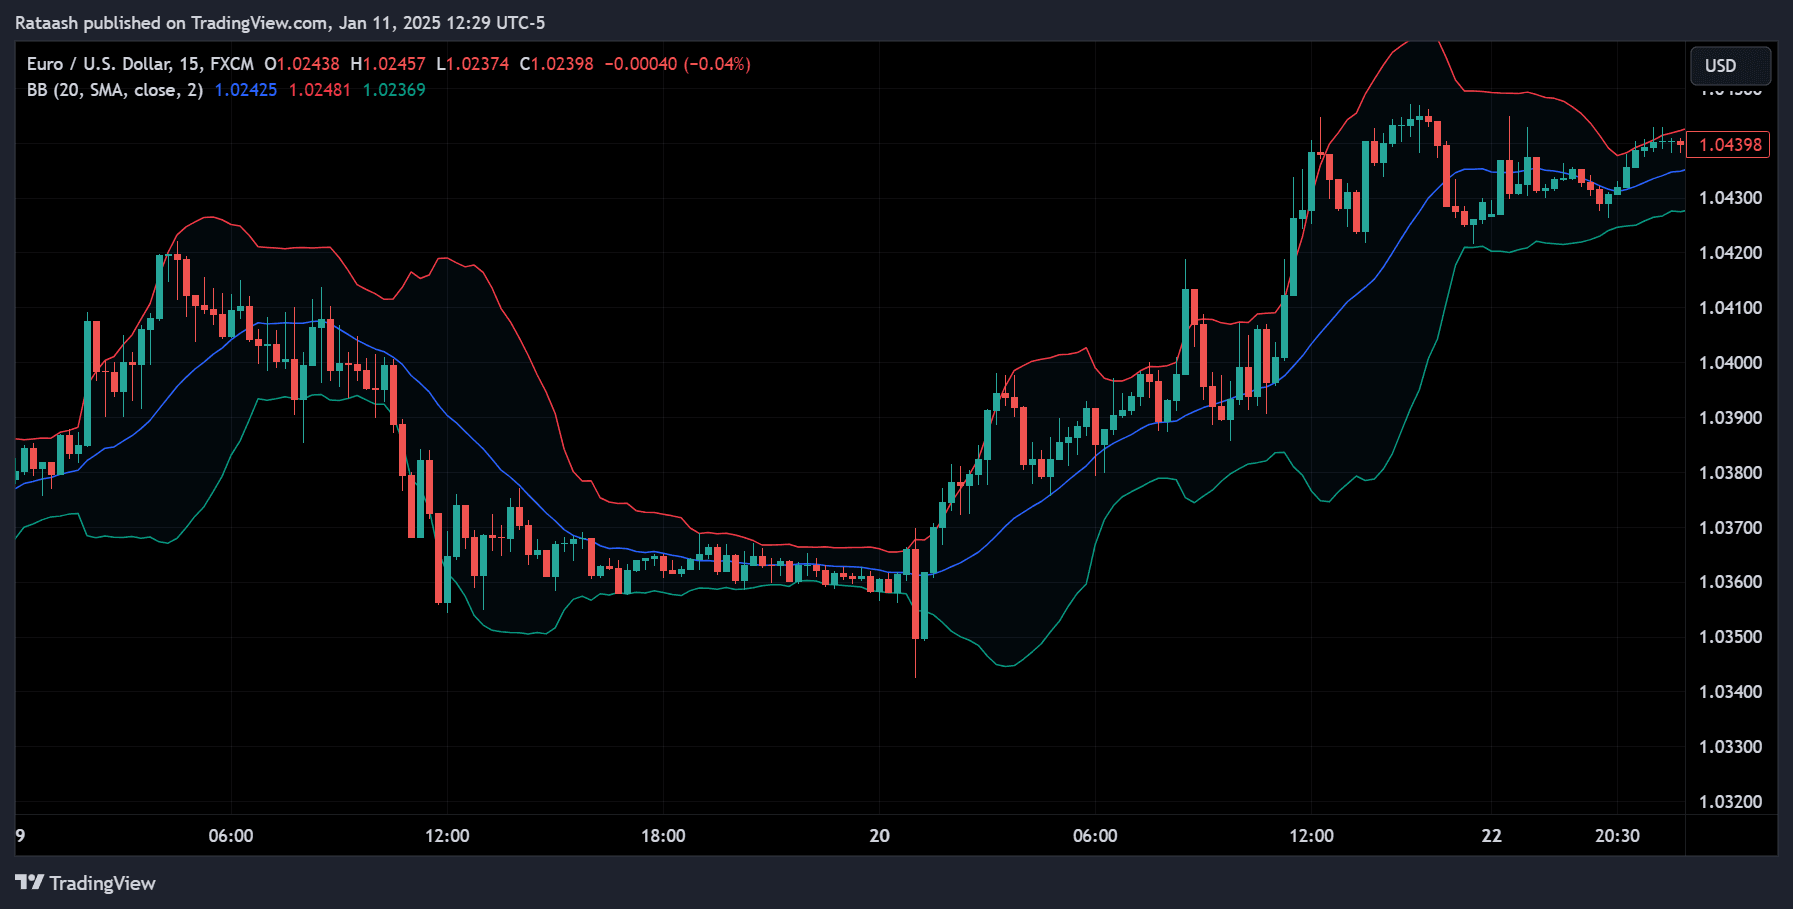
The Bollinger Bands Breakout Strategy typically seeks to exploit the “squeeze” phase when the Bollinger Bands contract is followed by an explosive breakout beyond the upper or lower band. The core idea is that when volatility is low, it can’t remain suppressed for too long; eventually, market forces (news, economic shifts, etc.) push the price in one direction forcefully.
Key Steps in a Breakout Strategy
- Identify when the Bollinger Bands are contracting – This signals the market may be coiling up for a larger move.
- Wait for a breakout candle – A candle that moves decisively outside the Bollinger Bands.
- Confirm the breakout with additional indicators or price action signals – This might involve momentum oscillators (RSI, MACD, …) or chart patterns.
- Enter the trade – Once you have confirmation that the breakout has legs (not a fake breakout).
- Manage your risk – Using stop-loss orders just below or above key support/resistance or the middle band.
- Exit – Either via a predetermined profit target or a trailing stop.
In the following sections, we’ll break down each step in detail.
Step-by-Step Guide to Implementing the Strategy
Step 1: Select the Appropriate Timeframe
Different traders operate on different time horizons:
- Scalpers might use the 1-minute or 5-minute chart, looking for small intraday moves.
- Day traders may prefer the 15-minute or 30-minute chart, closing all positions by the end of the trading day.
- Swing traders might use the 4-hour or daily chart, holding positions for several days to weeks.
When applying the Bollinger Bands Breakout Strategy, choose a timeframe that suits your lifestyle, risk tolerance, and experience. Make sure you have enough liquidity and volatility in that timeframe to find meaningful breakout opportunities.
Tips:
- Test your strategy on multiple timeframes to see which one yields the best risk-to-reward ratio.
- Remember that higher timeframes generally provide more reliable signals, though fewer trading opportunities.
Step 2: Apply Bollinger Bands
Most trading platforms have Bollinger Bands readily available. You can typically find them under the “Indicators” menu. Once you select Bollinger Bands:
- Enter your desired moving average length – 20 is a popular choice.
- Select the number of standard deviations – Usually 2 standard deviations.
- Style and color – Adjust to your preference, but ensure the bands are clearly visible.
Note: If you’re new, start with the default 20-period, 2 standard deviations setup. As you gain experience, you can experiment with other settings.
Step 3: Identify Squeeze Periods
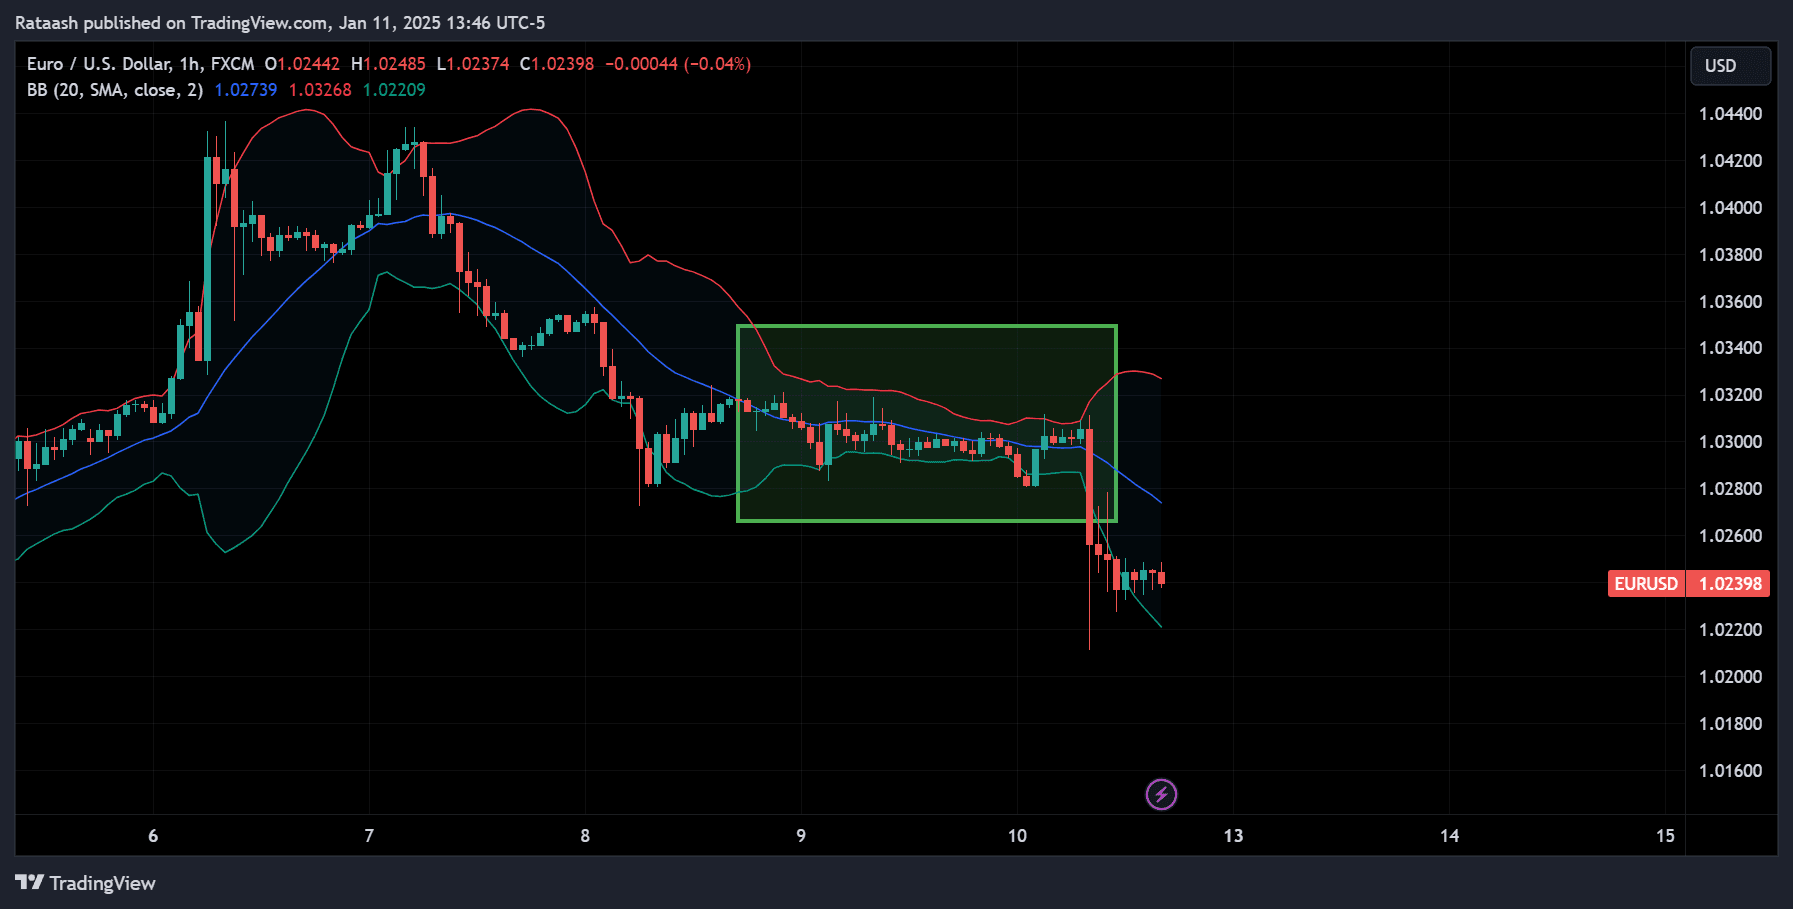
A “squeeze” is when the upper and lower Bollinger Bands move closer together, indicating declining volatility. Visually, it looks like the bands are “pinching” the price. To identify squeeze periods:
- Look for the narrowest part of the bands in recent history.
- Compare the current band width to previous widths over several days or weeks.
- If the Bollinger Band width is near a multi-week or multi-day low, it often signals an upcoming potential breakout.
Some traders use an indicator known as the Bollinger Bandwidth, which calculates the relative width of the bands to help quantify how “tight” they are.
Step 4: Look for Breakouts
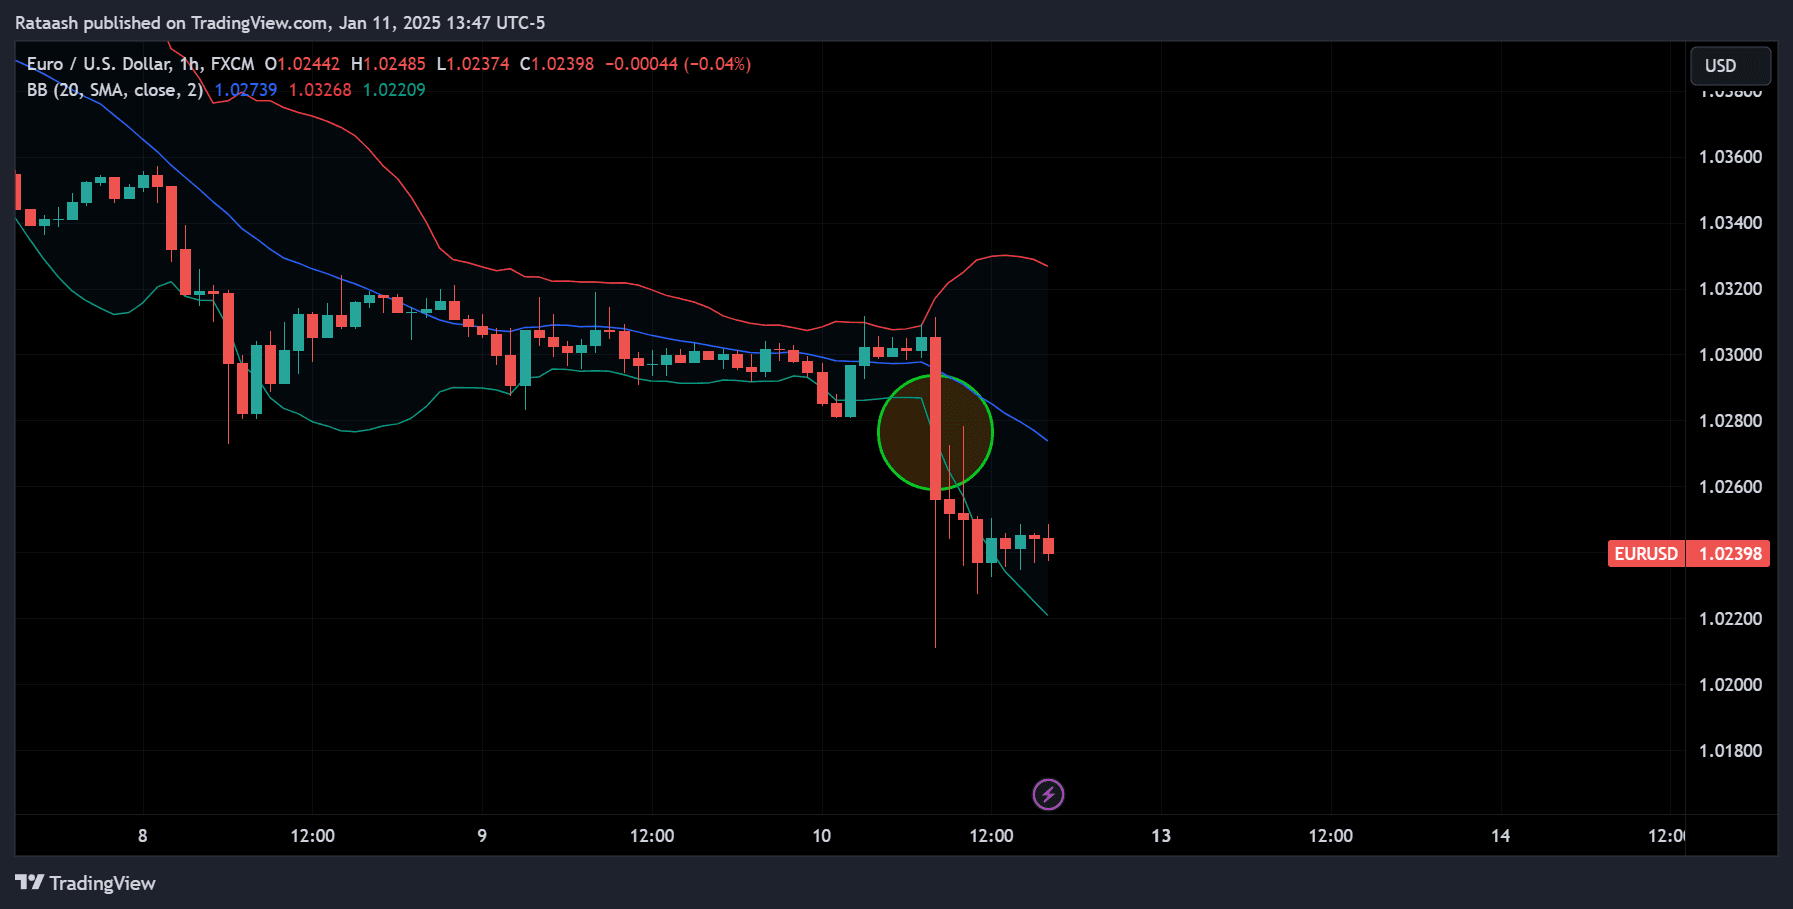
Once you see a squeeze, watch for the price to close decisively outside either the upper or lower band. A decisive close means the candle’s body (not just the wick) breaks above the upper band or below the lower band. This could be the beginning of a significant price movement.
Be cautious
- Not every close outside the band is a legitimate breakout. Prices can poke outside the band briefly, only to snap back into range. Look for a strong candle body, increased volume, or additional confirmation signals.
- Check for important economic news or geopolitical events that might be fueling the move.
Step 5: Confirm the Breakout
Breakout confirmation is crucial because the forex market often experiences false breakouts or “fakeouts.” A false breakout is when the price momentarily moves outside the Bollinger Band but quickly reverses, trapping traders who entered prematurely.
Confirmation methods:
- Volume spike – In many trading platforms, volume data on currency pairs can be less reliable than on stock exchanges, but you can still look for relative increases in volume.
- Additional indicators – RSI crossing above 50 (bullish) or below 50 (bearish), MACD crossovers, or Stochastic turning up/down can reinforce the breakout signal.
- Price retest – Sometimes, waiting for a retest of the band’s boundary (now acting as support or resistance) can confirm the breakout’s integrity. If the price retests the upper band and doesn’t fall back inside, this adds confidence to a bullish trade.
Step 6: Plan Your Entry
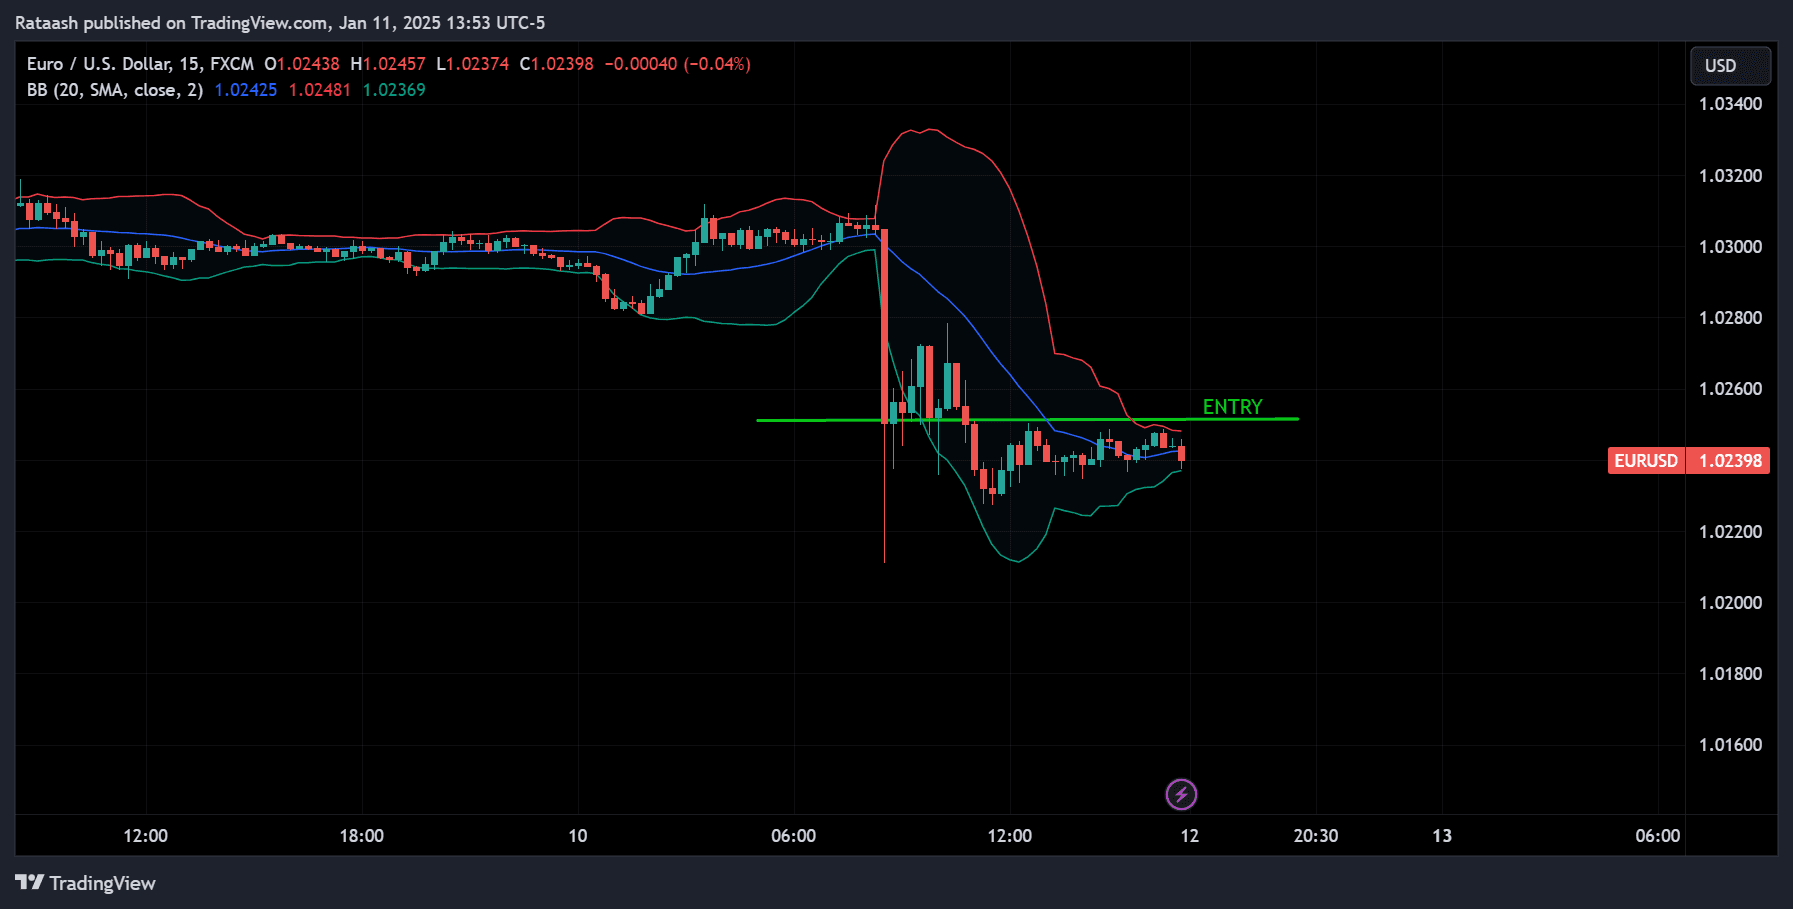
Once you confirm the breakout, you need a clear entry plan:
- Buy Stop Order (for bullish breakouts) – Place a buy order slightly above the breakout candle’s high.
- Sell Stop Order (for bearish breakouts) – Place a sell order slightly below the breakout candle’s low.
The idea is to avoid entering prematurely. Waiting for that extra pip or two above/below the breakout candle can sometimes spare you from false breakouts.
Step 7: Place Stop-Loss Orders
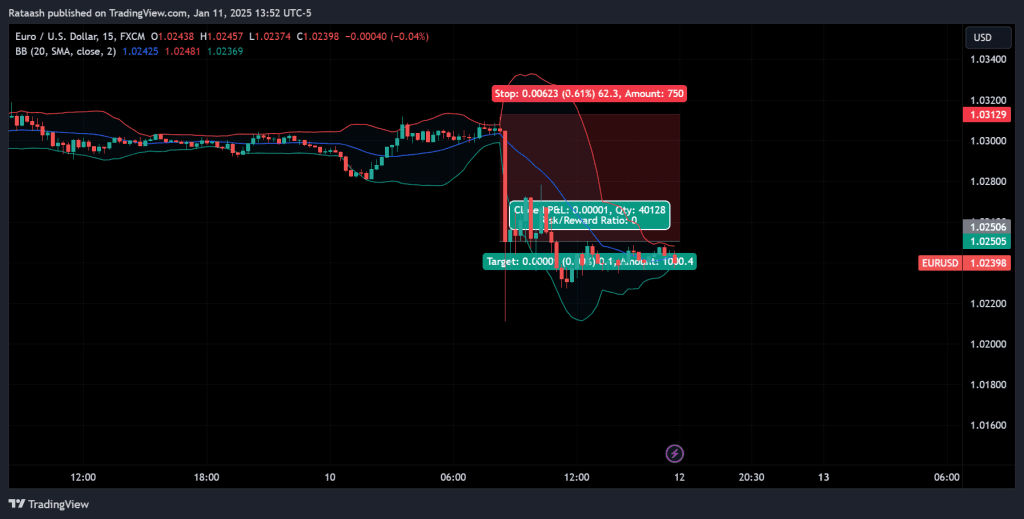
Stop-loss orders are essential for capital preservation. In a Bollinger Band breakout strategy, you might place your stop-loss:
- Below is the most recent swing low (for longs) – If the price breaks above the upper band and continues upward, you can set your stop just below the last significant low or potentially below the middle band if you’re using a wider stop.
- Above the most recent swing high (for shorts) – If price breaks below the lower band, set your stop just above the nearest swing high, or above the middle band for a more conservative approach.
Trailing stops can also be effective. As the price moves in your favor, you can incrementally move your stop-loss to lock in gains.
Step 8: Decide Your Profit Targets
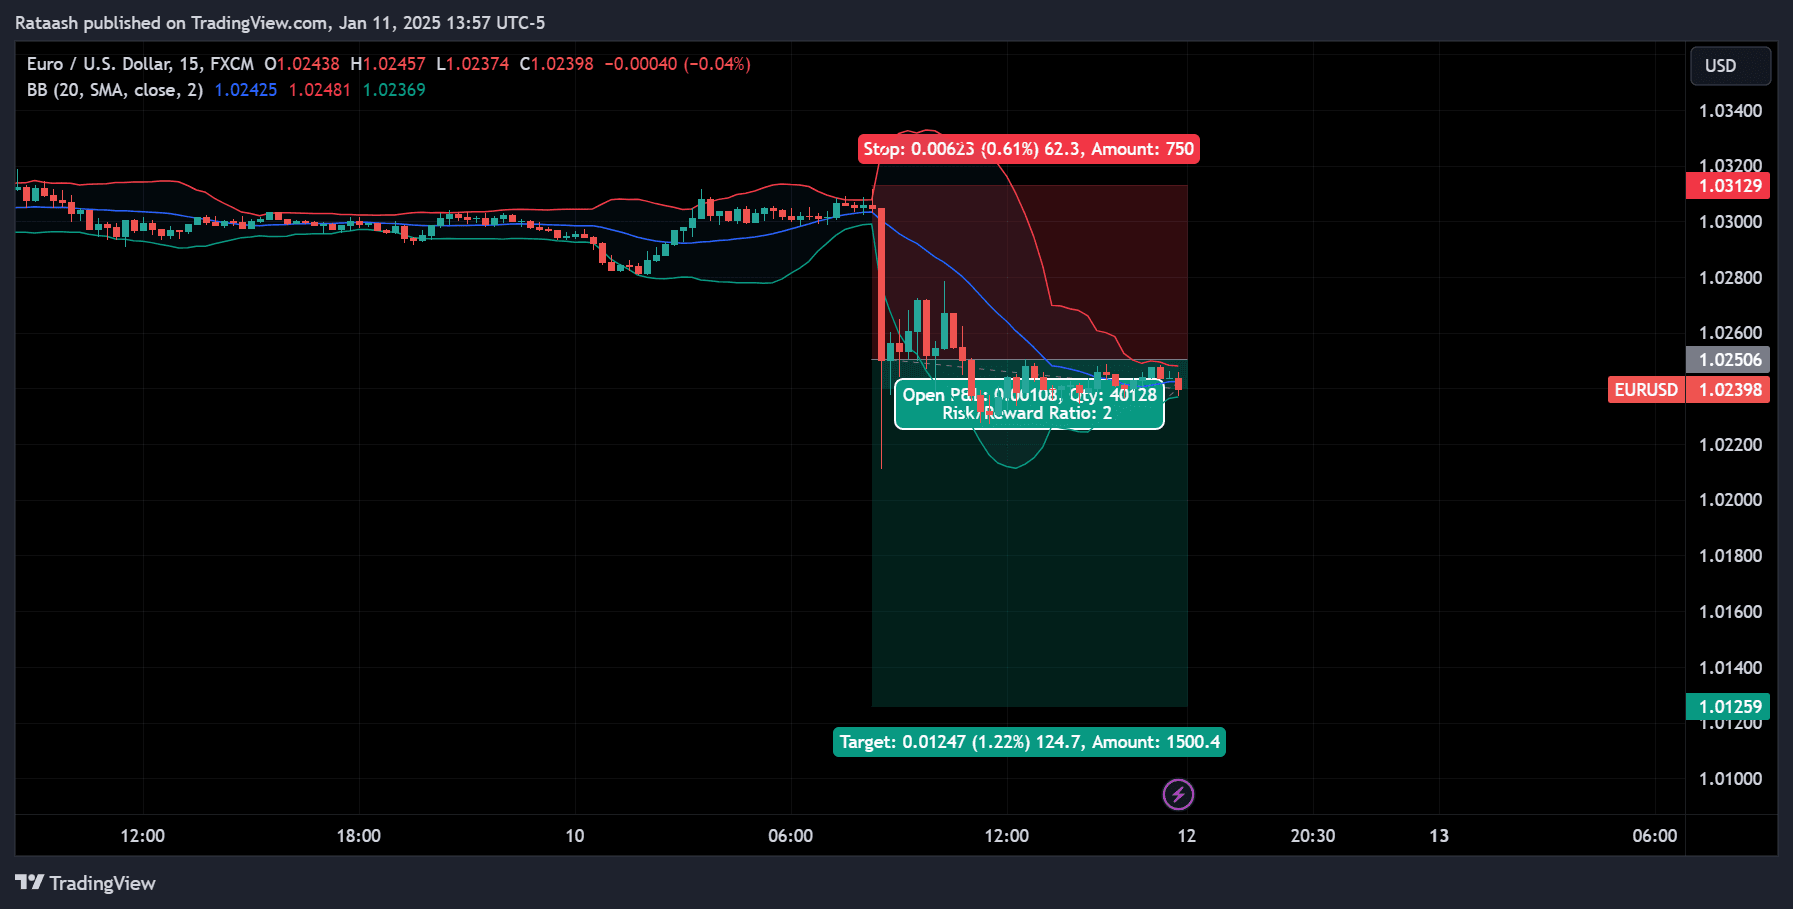
Having a defined exit strategy can help you avoid emotional trading decisions. Common ways to set profit targets for a Bollinger Bands breakout strategy:
- Risk-to-Reward Ratio – For instance, if your stop-loss is 50 pips away from entry, aim for at least 100 pips in profit for a 1:2 risk-to-reward ratio.
- Previous Support/Resistance – Identify nearby areas where price has historically reacted (e.g., a major pivot point).
- Psychological Levels – Round numbers like 1.2000 or 1.2500 often act as natural barriers.
- Bollinger Band Dynamics – Some traders use the middle band or the opposite Bollinger Band as a potential target.
Pro tip: You can use multiple partial take-profit points. For example, take half the position off at a 1:1 risk-to-reward ratio, then let the rest ride toward a more ambitious target.
Step 9: Trade Management and Exit
Once in the trade, successful trade management can make a big difference in your overall profitability:
- Monitor Price Action – Monitor how the price behaves around major support/resistance levels.
- Look for Signs of Reversal – Candlestick patterns (e.g., pin bars, shooting stars, hammer candles) can warn you of a potential shift in momentum.
- Adjust Stops – Consider using a trailing stop based on either a fixed pip distance or technical levels (like the middle Bollinger Band).
- Exit Timing – If the price quickly hits your profit target, exit the trade. If you see a strong reversal pattern forming, you may choose to exit early to protect profits.
Practical Examples of Bollinger Bands Breakout Trades
Example 1: Bullish Breakout on the EUR/USD (4-Hour Chart)
- Squeeze Observation – The Bollinger Bands (20,2) on the 4-hour chart begin to contract over a week, indicating low volatility.
- Breakout Candle – A large bullish candlestick closes above the upper Bollinger Band, signaling a potential breakout.
- Confirmation – RSI, previously hovering around 45-55, jumps above 60, indicating building momentum.
- Entry – Place a buy stop a few pips above the breakout candle’s high.
- Stop-Loss – Position it below the last swing low, about 50 pips away.
- Target – Aim for a 1:2 risk-to-reward, setting your profit target 100 pips above entry. You could also watch for the price to approach a major resistance level, such as 1.1050, and exit near that zone.
- Trade Management – As the price moves in your favor, shift your stop to breakeven. After hitting the first partial profit, hold the remainder for an extended run.
Example 2: Bearish Breakout on the GBP/USD (1-Hour Chart)
- Squeeze Formation – Over two trading sessions, the GBP/USD’s Bollinger Bands (20,2) tighten as the pair consolidates near a round number (e.g., 1.3000).
- Breakout Candle – A strong bearish candle forms during the London session, closing well below the lower Bollinger Band.
- Confirmation – The MACD histogram crosses below the zero line, reinforcing the bearish momentum.
- Entry – Place a sell stop a few pips below the breakout candle.
- Stop-Loss – Set it above the recent swing high, roughly 40 pips away.
- Profit Target – Aim for 80 pips (1:2 R:R). Alternatively, use the middle band as a trailing stop reference. if the price moves significantly away from the lower band, tighten your stop.
- Follow-Up – The price continues downward until it reaches a major support level. If the pair bounces strongly, exit the position to protect your profits.
Common Mistakes to Avoid
- Entering on Every Band Touch – Not every touch of the upper or lower band signals a breakout. The price can often move along the band without a decisive breakout. Always wait for a candle close and confirmation.
- Ignoring Fundamentals – Major news events (e.g., central bank rate decisions, GDP data) can invalidate technical setups or create fakeouts. Keep an economic calendar handy.
- No Stop-Loss – Failing to place a stop-loss can be disastrous, especially when volatility spikes.
- Overleveraging – Using excessive leverage can magnify losses. Always stick to a prudent risk management approach.
- Chasing Late Breakouts – If the price has already moved significantly outside the bands, jumping in late could mean a poor risk-to-reward setup.
Risk Management and Position Sizing
Risk management is pivotal for long-term success, especially in the high-volatility environment of forex trading. Here are the essential components of a robust risk management plan:
Position Sizing – Never risk more than 1-2% of your account on a single trade. To calculate position size:
Position Size = Account Risk(in dollars) / Stop-Loss(in pips) × Pip Value
Stop-Loss Placement – Don’t randomly pick a stop-loss level. Base it on technical considerations like recent swing highs/lows or the middle Bollinger Band.
Diversification – If you’re trading multiple currency pairs, avoid over-concentrating risk in pairs that are highly correlated (e.g., EUR/USD and GBP/USD).
Emotional Discipline – If the trade goes against you, accept the loss and move on. Revenge trading can quickly erode your account balance.
Example: You have a $10,000 trading account and don’t want to risk more than 2% ($200) per trade. If your stop-loss is 50 pips away, and each pip for 1 standard lot (100,000 units) is roughly $10 for EUR/USD, then:
- 50 pips * $10 = $500 risk with 1 standard lot, which is too high.
- To keep risk at $200, you’d trade 0.4 lots because 50 pips * $4 = $200.
Thus, you’d enter the trade with 0.4 lots (40,000 units).
Advanced Tips and Variations
- Combine Bollinger Bands with Other Indicators
- Bollinger + RSI – Look for RSI divergence near Bollinger Band breakouts.
- Bollinger + MACD – MACD crossovers can validate breakouts and filter out false signals.
- Bollinger + Volume Indicators – It often signals a stronger follow-through if volume spikes at a Bollinger Band breakout.
- Bollinger Band Squeeze with Keltner Channels – Some traders apply a strategy known as the “Bollinger Squeeze,” comparing Bollinger Bands with Keltner Channels. When the Bollinger Bands move inside the Keltner Channels, it indicates extremely low volatility (a super-squeeze), often preceding explosive moves.
- Double Bollinger Bands – A technique popularized by Kathy Lien: using two sets of Bollinger Bands (for instance, 20,2 and 20,1) to gauge momentum and trend strength. If the price stays within the upper band set, it indicates a strong uptrend; if it stays within the lower band set, it’s a strong downtrend.
- Bollinger Band Mean Reversion + Breakout Hybrid – Some traders watch for mean reversion trades when the price is near the outer bands and then switch to a breakout approach if the price consolidates near a band and then breaks out further.
- Time of Day Considerations – Forex volatility is not consistent around the clock. The London and New York sessions are typically more volatile than the Asian session. Consider focusing on times when the market is most active if you want more frequent breakouts.
- News Trading with Bollinger Bands – When major economic news is due (Non-Farm Payrolls, interest rate decisions), Bollinger Bands might tighten in anticipation. A breakout strategy can be highly effective if you can handle the associated risk and potential slippage during high-impact releases.
Frequently Asked Questions
Can Bollinger Bands be used on any currency pair?
Yes, Bollinger Bands are versatile and can be used on any currency pair, although you should be mindful of each pair’s volatility characteristics. Exotic pairs might require different Bollinger Band settings.
What is the best timeframe for Bollinger Band breakouts?
There is no universal “best” timeframe. Scalpers may use 1- or 5-minute charts, while swing traders opt for 4-hour or daily charts. It depends on your trading style and risk tolerance.
How do I avoid false breakouts?
Wait for a decisive close beyond the band.
Confirm with additional technical indicators like RSI or MACD.
Watch out for major economic news that can create whipsaws.Should I always wait for the bands to contract?
The contraction phase (squeeze) often precedes big moves, but breakouts from an already volatile state can also occur. Monitoring band width simply increases your odds of catching an explosive move.
Can I use exponential moving averages (EMA) for the middle band?
Yes, you can. Some traders prefer EMAs due to their responsiveness to recent price changes. However, you’d need to experiment to see if that improves your trading results.
What if the market consolidates after a breakout?
If the market fails to follow through and consolidates, consider tightening your stop or exiting early. Not every breakout results in a big trend move.
Is the Bollinger Bands Breakout Strategy suitable for beginners?
Yes, as long as they understand the basics of technical analysis and risk management. Bollinger Bands are relatively straightforward to interpret. The main challenge is maintaining discipline and avoiding emotional mistakes.
Conclusion
The Bollinger Bands Breakout Strategy is a powerful approach for forex traders seeking to capitalize on volatility expansions following periods of low volatility. By understanding how Bollinger Bands measure standard deviation around a moving average, traders gain insight into when the market might be “coiled up” for a large move. Successfully implementing this strategy involves:
- Identifying squeeze periods (bands contracting).
- Waiting for a decisive breakout candle.
- Confirming the breakout with additional tools and market context.
- Carefully placing entries, stop-losses, and profit targets.
- Employing robust risk management and position sizing.
Always remember that no strategy guarantees profit. Market conditions change, and unexpected news events can derail even the most technically sound setups. The key to long term success with Bollinger Band breakouts or any trading strategy is discipline, risk management, and continual learning.
If you’re new to Bollinger Bands or breakout trading, consider practicing on a demo account first. Refine your approach, document your trades in a journal, and adjust your parameters as needed. Over time, you’ll better understand market behavior and how Bollinger Bands can best serve your trading goals.

