

Forex trading moves fast, and knowing how to spot and ride trends is a game-changer if you want to stay ahead. One of the most popular tools traders use for this is moving averages, which help smooth out price action, highlight trends, and even act as dynamic support and resistance levels. The Exponential Moving Average (EMA) stands out because it reacts quickly to price changes, giving traders an edge in fast-moving markets.
In this guide, we’re diving deep into the EMA strategy, also known as “Riding the Forex Trend.” We’ll break down everything you need to know about how EMAs work and how to use them to find trade setups, manage risk, and maximize profits. Whether you’re a beginner or a experienced trader, by the end of this, you’ll have a solid strategy for using EMAs to catch and ride trends with confidence. Let’s get started!
Table of Contents
What Is an Exponential Moving Average (EMA)?

The Exponential Moving Average (EMA) is a type of moving average that places more weight on the most recent price data. This causes the EMA to react faster to recent price fluctuations than a Simple Moving Average (SMA), which gives equal weight to all data points in the period.
For instance, when a major news release causes a sudden spike or drop in price, an EMA on your chart adjusts more rapidly in response to those current price changes, whereas a simple moving average might be slower to reflect the new price level.
Key Advantages of EMAs
- Responsiveness – Because of how it’s calculated, the EMA captures recent price movements more quickly. This can help traders spot trend changes or confirm momentum faster.
- Trend-Clarity – Many traders use EMAs to smooth out the price curve and more readily discern the trend’s direction. The steeper the slope of the EMA line, the stronger the trend.
- Versatility – EMAs can be applied to various market instruments, timeframes, and strategies, making them especially popular in fast-moving markets like Forex.
How the EMA Is Calculated
While most trading platforms calculate EMAs automatically, understanding the math behind the indicator helps you appreciate how it reacts to price changes.
Start with the Simple Moving Average (SMA)
For the first EMA value, you typically begin with an SMA of the most recent prices for the period you’re analyzing. For example, if you’re dealing with a 20-period EMA, calculate the 20-period SMA first.
Define the Weighting Multiplier
The weighting multiplier for the EMA is calculated as:
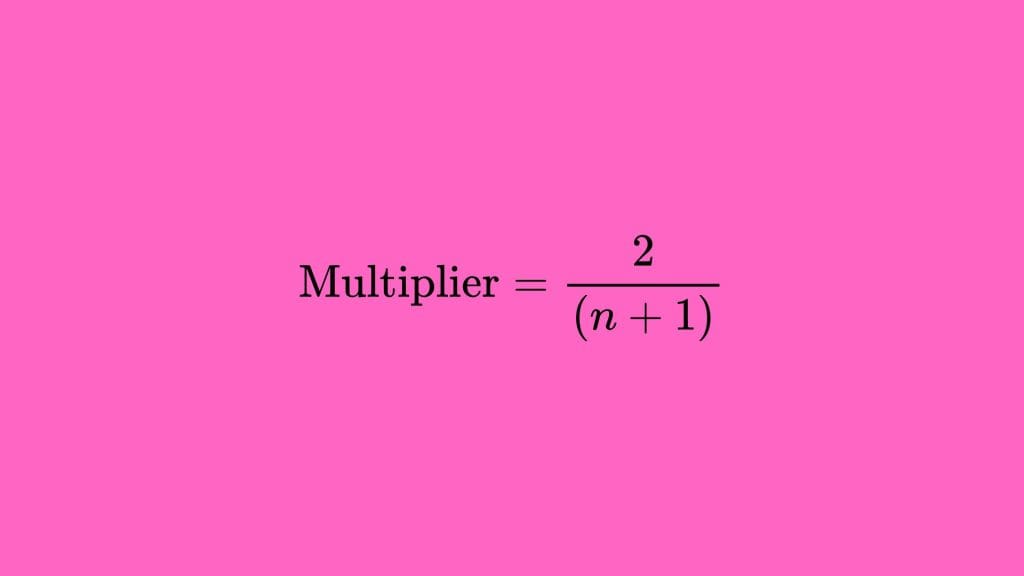
where n is the number of periods in the EMA (e.g., 20 for a 20-day EMA).
Apply the EMA Formula
The basic EMA formula is:
EMA today = (Price today × Multiplier) + (EMA yesterday × (1−Multiplier))
This formula shows how each new value depends partly on today’s price and partly on the previous EMA value, with recent price data given more emphasis.
Why Traders Use EMAs in Forex
- Quick Adaptation to Market Shifts
Forex prices can move rapidly due to economic announcements, geopolitical tensions, and investor sentiment changes. The EMA’s sensitivity to recent data helps traders adapt to these swift shifts. - Clearer Trend Visualization
Many traders look at multiple EMAs on their charts (e.g., a 50-period and 200-period EMA) to quickly ascertain whether a bullish or bearish trend is in play. Crossovers and the slope of the EMA lines can help confirm trend directions. - Versatile Timeframe Application
You can apply EMAs to anything from a 1-minute chart to a weekly chart. Whether you’re a day trader, scalper, or swing trader, EMAs can fit your strategy and timeframe. - Better Entry and Exit Points
When combined with proper risk management, EMA signals can help you refine your trade entries and exits, often providing a more objective method than relying solely on discretionary judgments.
Trend Identification with EMAs

Identifying a Trend is the most basic but vital function of EMAs in Forex. Here are some guidelines:
- EMA Slope:
- If the EMA line is sloping upward, this suggests an uptrend (bullish environment).
- If the EMA line is sloping downward, this suggests a downtrend (bearish environment).
- A flat EMA line could indicate a ranging or sideways market.
- Price in Relation to the EMA:
- When price consistently remains above an EMA, it often signifies a bullish market.
- When price remains below an EMA, it often signifies a bearish market.
- Multiple EMAs:
- Using more than one EMA (e.g., a short-term EMA like 20 and a longer-term EMA like 50) can help you confirm trends. If the short-term EMA is above the long-term EMA, it typically indicates an uptrend; if it’s below, it typically indicates a downtrend.
Once you’ve identified the primary trend, your goal as a trader who wants to “ride the trend” is to align your positions in that direction.
Choosing the Right EMA Periods
One question traders regularly ask is: Which EMA periods should I use? The answer varies based on trading style, timeframe, and personal preference. Let’s break down some common options:
- Short-Term EMAs (e.g., 10-day, 20-day)
Ideal for short-term traders and scalpers aiming to capture quick moves. These EMAs react quickly, producing more signals but also more potential whipsaws. - Medium-Term EMAs (e.g., 50-day, 100-day)
Often favored by swing traders who hold positions for several days or weeks. These periods strike a balance between responsiveness and stability. - Long-Term EMAs (e.g., 200-day)
Commonly used by position traders and those wanting to understand the overarching market direction. They are less prone to short-term price noise and can serve as significant support or resistance levels.
The choice ultimately depends on your objectives. Some traders combine multiple EMA periods on a single chart to gain insights into short-, medium-, and long-term trends all at once.
Multi-EMA Setups

A popular approach is to combine at least two EMAs a short-term EMA and a long-term EMA to get a clearer picture of the market’s trend.
Common Combinations
- 9 EMA & 21 EMA:
Frequently used by short-term day traders who want quick signals. - 20 EMA & 50 EMA:
A favored combination by many swing traders. - 50 EMA & 200 EMA:
Provides a broad perspective on the overall trend and is common among long-term traders.
Why Use Multiple EMAs?
- Trend Confirmation: If a short-term EMA is above a long-term EMA, that strongly suggests a bullish phase. If it’s below, that suggests a bearish phase.
- Timing: Multi-EMA strategies may help in timing entries and exits better.
- Support and Resistance: Multiple EMA lines can act as dynamic support and resistance levels. Price may pull back to these lines and then bounce in the direction of the trend.
EMA Crossover Strategy Basics
A widely recognized strategy based on EMAs involves crossovers:
Bullish Crossover

Occurs when a faster (shorter period) EMA crosses above a slower (longer period) EMA, often signaling a potential shift to an uptrend.
Bearish Crossover

Occurs when the faster EMA crosses below the slower EMA, often signaling a potential shift to a downtrend.
Traders often use these crossovers to generate entry signals. For instance, in a 20 EMA and 50 EMA system, a bullish crossover would be when the 20 EMA moves above the 50 EMA, leading a trader to consider opening a long position. Conversely, a bearish crossover would be when the 20 EMA falls below the 50 EMA, indicating a short entry opportunity.
While crossovers can be useful, they are not infallible. Markets can range or oscillate, causing multiple “false” signals. Thus, it’s prudent to use additional filters—like price action analysis or another indicator—to confirm the signals before taking a trade.
Riding the Trend with the EMA Strategy
To “ride” a trend effectively using EMAs, you’ll combine the concepts of trend identification, momentum confirmation, patient trade management, and money management. The steps outlined below provide a detailed framework.
Market Environment Assessment

First, establish if the market is trending or range-bound. If the EMAs are frequently crossing over each other in a narrow band, the market may be ranging, making a “trend-riding” strategy less effective.
If the EMAs are clearly spaced and angled in one direction, the market is likely trending.
Identify the Trend

For a bullish trend, ensure the shorter EMA is above the longer EMA, and price is trading above both. The EMAs should both slope upward.

For a bearish trend, ensure the shorter EMA is below the longer EMA, and price is trading below both. The EMAs should slope downward.
Wait for Pullbacks or Corrections

In a bullish trend, wait for price to pull back near the EMA (or set of EMAs). This zone often acts as dynamic support, offering potential low-risk entries.
In a bearish trend, wait for a rally back to the EMA region, which often serves as dynamic resistance.
Enter in the Direction of the Trend

Consider using candlestick patterns (e.g., bullish engulfing, hammer, pin bar) as a trigger to confirm a continuation of the established trend.
Entering on these pullbacks can provide a favorable risk-to-reward ratio, as you’re essentially “buying at a discount” or “selling at a premium” within a larger trending move.
Set Stop-Loss and Take-Profit
A stop-loss can be placed below (in a bullish trend) or above (in a bearish trend) the swing low/high. Some traders also put the stop-loss slightly beyond the EMA to account for potential price spikes.
For targets, you can use prior swing highs or lows, a trailing stop based on the EMA itself, or a reward-to-risk ratio (e.g., aiming for 2:1 or 3:1).
Let Winners Run
The essence of “riding the trend” is to allow profitable trades to remain open as long as the market moves in your favor.
One technique is to use a trailing stop. As price advances with the trend, move your stop-loss up (for a bullish trade) or down (for a bearish trade), following the EMA. This can lock in profits while giving the trade room to extend.
Exit When Trend Weakens or Reverses

Signs of trend exhaustion include a flattening EMA, a crossover in the opposite direction, or a break of a key swing point.
In a multi-EMA system (e.g., 20 & 50), if the faster EMA crosses below the slower EMA in an uptrend, that’s a significant red flag prompting some traders to close out their positions.
By carefully following these steps, you increase your likelihood of catching sustained Forex moves while minimizing false starts.
Timeframe Considerations

Timeframes can significantly alter how EMA signals appear and how you interpret them:
- Scalping (1-minute to 5-minute charts)
- EMAs will generate more frequent signals, but noise is higher.
- You’ll look for very short EMAs (e.g., 9 or 20) and rely on quick in-and-out trades.
- Day Trading (15-minute to 1-hour charts)
- Ideal for traders who want multiple trades a day.
- EMAs around 20, 50, or 100 can work well.
- Swing Trading (4-hour to daily charts)
- Fewer signals, but they might be more robust with potentially larger moves.
- EMAs like 50, 100, or 200 are common.
- Position Trading (Weekly charts)
- Very few signals in a year, but each signal can represent a longer-term move.
- Long-term EMAs (100, 200, 300) help identify significant market shifts.
Your choice depends on your availability, risk tolerance, and profit goals. Always align your EMA settings and strategy to the timeframe you plan to trade.
Entry Points, Exits, and Stop-Loss Placement
Finding Ideal Entry Points

- EMA Bounces – An effective approach is to wait for price to retrace to the EMA in a trending market. Enter on a bounce when price resumes moving in the trend direction.
- EMA Crossovers – A straightforward method is to enter when a short-term EMA crosses above (or below) a longer-term EMA. Use price action or another indicator (like RSI or MACD) to confirm the viability of the signal.
- Breakouts – Some traders wait for price to break above a recent swing high or below a recent swing low while the EMAs maintain a consistent slope. This approach can minimize false signals in choppy markets.
Setting Stop-Losses

- Fixed Stop – You can choose a specific number of pips away from your entry. This method is simple but does not adapt to price swings.
- Structure-Based Stop – More precise: place your stop below a swing low (for longs) or above a swing high (for shorts). This approach considers market structure, reducing the chance of being prematurely stopped out by random noise.
- EMA-Based Stop – Place your stop just beyond the EMA, giving the trade enough “breathing room” while still protecting capital if price breaks decisively in the opposite direction.
Exiting Trades

- Take Profit at Key Levels – Identify major support and resistance levels, previous highs/lows, or psychologically important round numbers (e.g., 1.2000 in EUR/USD).
- Trailing Stop – Move the stop-loss in the direction of the trade as it becomes profitable. For instance, you might trail by the distance to the EMA or a fixed number of pips.
- Indicator Based Exit – Use another indicator (like MACD crossing the zero line, RSI reaching oversold/overbought territory, or an opposing EMA crossover) to decide when to exit.
Choosing the right combination of entries and exits is both an art and a science. Backtesting your chosen method on historical data is essential for gaining confidence before risking real capital.
Combining EMAs with Other Indicators

While EMAs are powerful tools for trend riding, combining them with other indicators or methods can offer stronger signals and reduce false positives.
- RSI (Relative Strength Index) – Measures overbought or oversold conditions. You might wait for RSI to exit an oversold region in an uptrend before buying, reinforcing the entry signal you get from an EMA pullback.
- MACD (Moving Average Convergence Divergence) – Uses EMAs in its calculation (12-day, 26-day, 9-day) to measure momentum. A MACD crossover in alignment with an EMA-based trend can be a compelling signal.
- Stochastic Oscillator – Another momentum-based indicator. Look for a bullish or bearish crossover within a Stochastic reading that aligns with the EMA-defined trend direction.
- Price Action – Candlestick patterns such as pin bars, engulfing patterns, and inside bars can provide precise entries or exits.
- Support and resistance – Support and resistance zones can act as additional filters, confirming the validity of an EMA-based signal.
Combining multiple confirmations increases the probability that a trade will move in your favor, although it may reduce the number of signals you receive.
Practical Examples of EMA Strategies
Below are two simplified examples to illustrate how you might apply an EMA-based trend-riding approach in real-market scenarios:
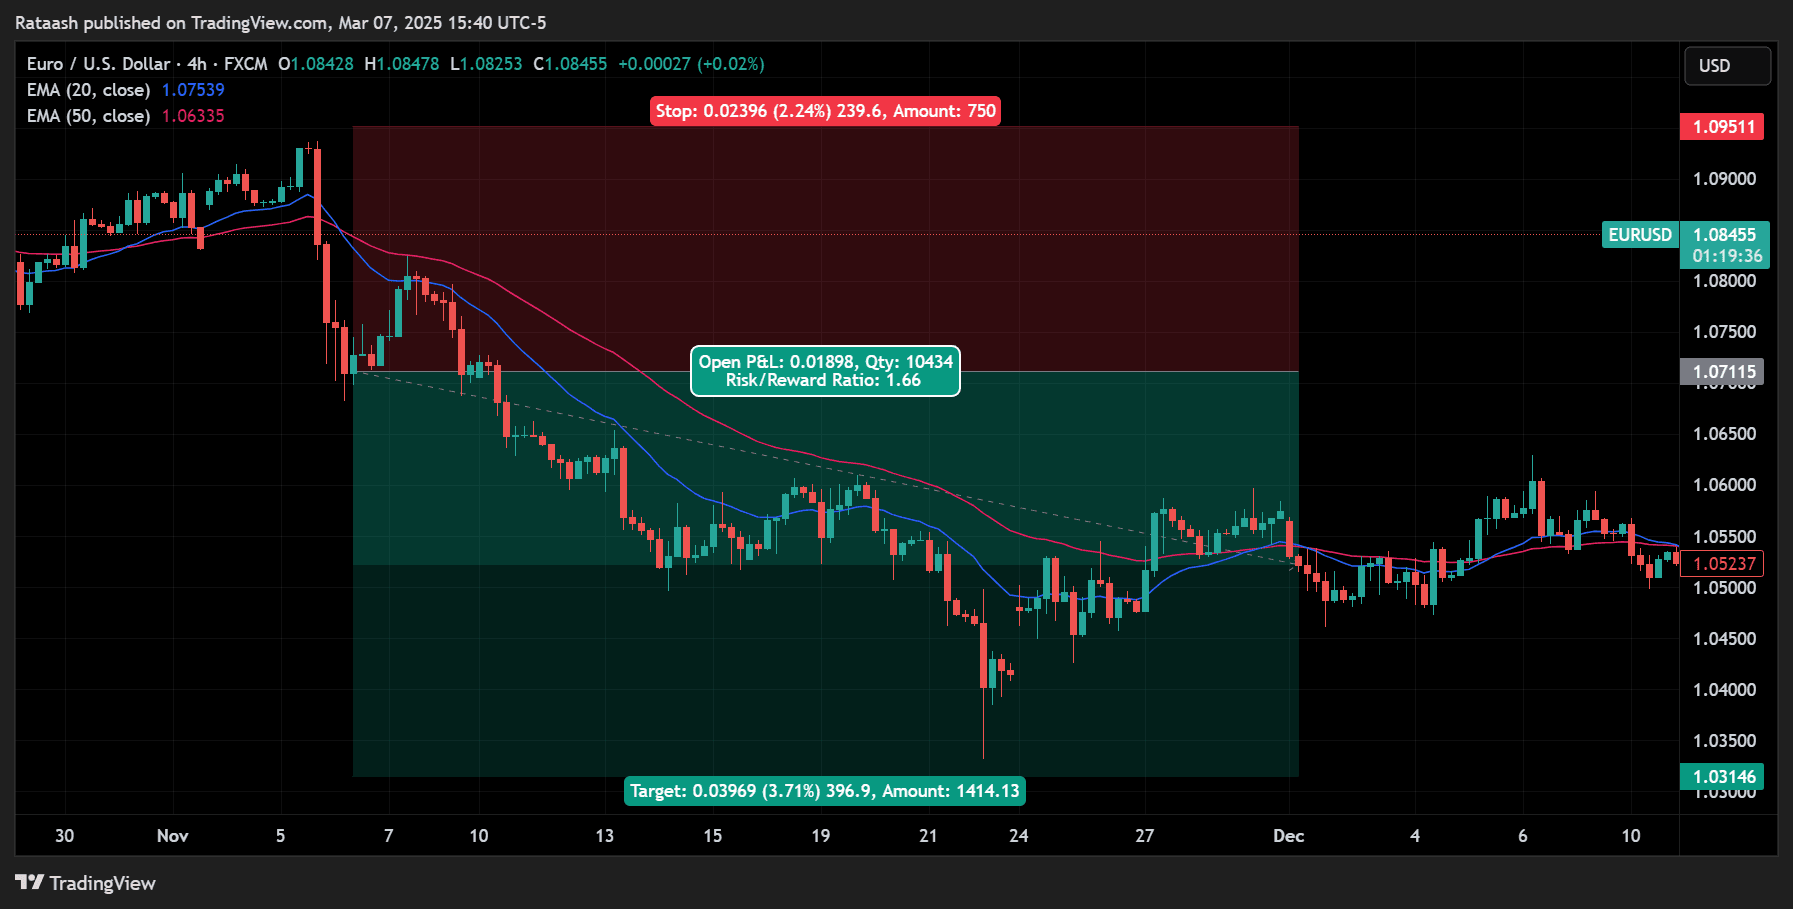
Example 1: 20 EMA & 50 EMA for Swing Trading on a 4-Hour Chart

- Identify Trend
- If the 20 EMA is above the 50 EMA, the trend is bullish. Both EMAs should be sloping upward.
- Wait for Pullback
- Price dips back toward the 20 or 50 EMA. The pullback is indicated by a short-term price decline.
- Enter Long
- Once price finds support around the EMAs and forms a bullish candlestick pattern (like a bullish engulfing), enter a buy trade.
- Stop-Loss
- Place stop-loss just below the most recent swing low, which may also be near the 50 EMA for extra confirmation.
- Take-Profit
- Aim for the next resistance level, or consider using a trailing stop.
- Exit
- Exit if a 20/50 bearish crossover occurs or if price breaks below the 50 EMA decisively.
Example 2: 9 EMA & 21 EMA for Day Trading on a 15-Minute Chart

- Set EMAs
- Apply 9 EMA (fast) and 21 EMA (slow) to the chart.
- Look for Crossovers
- A bullish crossover (9 above 21) signals a potential uptrend.
- Confirmation
- Use RSI (14) to confirm momentum is above 50 (bullish).
- Entry
- Enter a long position when price closes above both EMAs.
- Stop-Loss
- Place your stop-loss below the swing low formed during or before the crossover.
- Manage Trade
- If price remains above the 9 EMA, you can hold the position. If it crosses back below the 9 EMA or the 9 crosses below the 21, you consider exiting.
- Profit Target
- Choose a 2:1 or 3:1 reward-to-risk ratio or close the trade as you approach a known resistance level.
These examples provide a general overview of how you might operationalize an EMA-based approach in different timeframes. Adapt them based on your personal preference, risk tolerance, and market conditions.
Common Mistakes and How to Avoid Them
1. Over-Reliance on EMAs Alone
- Mistake: Entering trades solely because price crosses an EMA.
- Solution: Combine EMAs with other forms of technical or fundamental analysis to confirm signals.
2. Ignoring Market Conditions
- Mistake: Using a trend-following strategy in a flat or choppy market.
- Solution: Assess volatility and momentum. If EMAs are flat and crossing frequently, it’s often better to stand aside.
3. Neglecting Risk Management
- Mistake: Placing large trades with tight stops, leading to frequent stop-outs.
- Solution: Maintain consistent position sizing and ensure that each trade aligns with your risk tolerance.
4. Lack of Discipline
- Mistake: Exiting trades prematurely or moving stop-losses further away in fear or greed.
- Solution: Develop and stick to a well-defined trading plan. Emotions can derail even the best strategies.
5. No Proper Backtesting or Forward Testing
- Mistake: Trading a strategy live without any historical or demo-trading validation.
- Solution: Test your EMA approach on historical data (backtesting) and in demo environments before risking real money.
Avoiding these pitfalls enhances the probability of consistent success.
Frequently Asked Questions (FAQs)
Q1: Which EMA settings are best for Forex trading?
There is no one-size-fits-all setting. Day traders might favor shorter EMAs (like 9, 20, or 21) because they want quick signals. Swing or position traders often use 50, 100, or 200 EMAs to identify broader trends. Experimentation and backtesting are key.
Q2: Are EMAs suitable for beginner traders?
Yes, EMAs are relatively easy to learn and interpret, making them beginner-friendly. However, beginners should still practice risk management and possibly combine EMA signals with basic price action or another confirming indicator.
Q3: Can I rely on EMA crossovers alone?
While some traders do, you increase your success rate by adding other forms of analysis—technical or fundamental. Crossovers can produce “false signals” in low-volume or sideways markets, so additional confirmation is beneficial.
Q4: How do I decide when to exit a trade?
You can base exits on an opposite EMA crossover, a trailing stop that follows the EMA, or price reaching a major support/resistance zone. Many traders also let winning trades run until the market shows concrete signs of reversal.
Q5: Are EMAs effective in high-impact news events?
High-impact news releases can cause erratic price spikes that can distort EMA readings for a short period. While EMAs are good trend indicators, you should remain cautious around major news releases and consider stepping aside or using wider stops.
Q6: Should I manually calculate EMAs?
You don’t need to manually calculate EMAs, as charting platforms do it for you instantly. Understanding the formula, however, gives you deeper insight into how the indicator responds to price changes.
Q7: Do EMAs work on cryptocurrencies or stocks?
Yes, EMAs are not limited to Forex. Traders successfully apply EMAs to stocks, cryptocurrencies, and commodities. The principle remains the same: you’re smoothing out price data to identify trends.
Conclusion
The Exponential Moving Average (EMA) Strategy—often referred to as “Riding the Forex Trend”—is a cornerstone technique that underscores the power of identifying and capitalizing on prevailing price directions. EMAs provide a responsive and relatively straightforward way to gauge market sentiment, distinguish a trending environment, and pinpoint potential trade opportunities.