

Identifying real trends in Forex trading can be tough, especially when market noise and volatility cloud decision making. While traditional candlesticks often lead to choppy signals, the Heiken Ashi Forex Trading Strategy smooths out price action, making trend direction clearer and entries more precise.
This article presents a practical, stand-alone approach to using Heiken Ashi for consistent trading results. You’ll discover step-by-step guidance, real trade examples, and proven risk management tactics to help you trade trends with greater confidence. Let’s get started.
Table of Contents
- Read More Heiken Ashi for Forex Trading: Master Smoother Candlestick Analysis for Consistent Profits
Brief Overview of Heiken Ashi Candles
Since this is primarily a strategy-based article, we will only briefly touch on what Heiken Ashi is. If you’re familiar with standard Japanese candlesticks, Heiken Ashi might look visually similar. However, Heiken Ashi modifies (or “averages”) price data to offer a smoother representation of price movements.
- Heiken Ashi Calculation Concept – Unlike standard candlesticks, where each candle stands alone and is defined by its own open, close, high, and low, the Heiken Ashi candle uses parts of the previous bar’s values combined with the current bar’s data to create a new candle.
- Primary Advantage – By “averaging” price, Heiken Ashi candles cut down on short-term market noise, making it easier to spot the underlying trend.
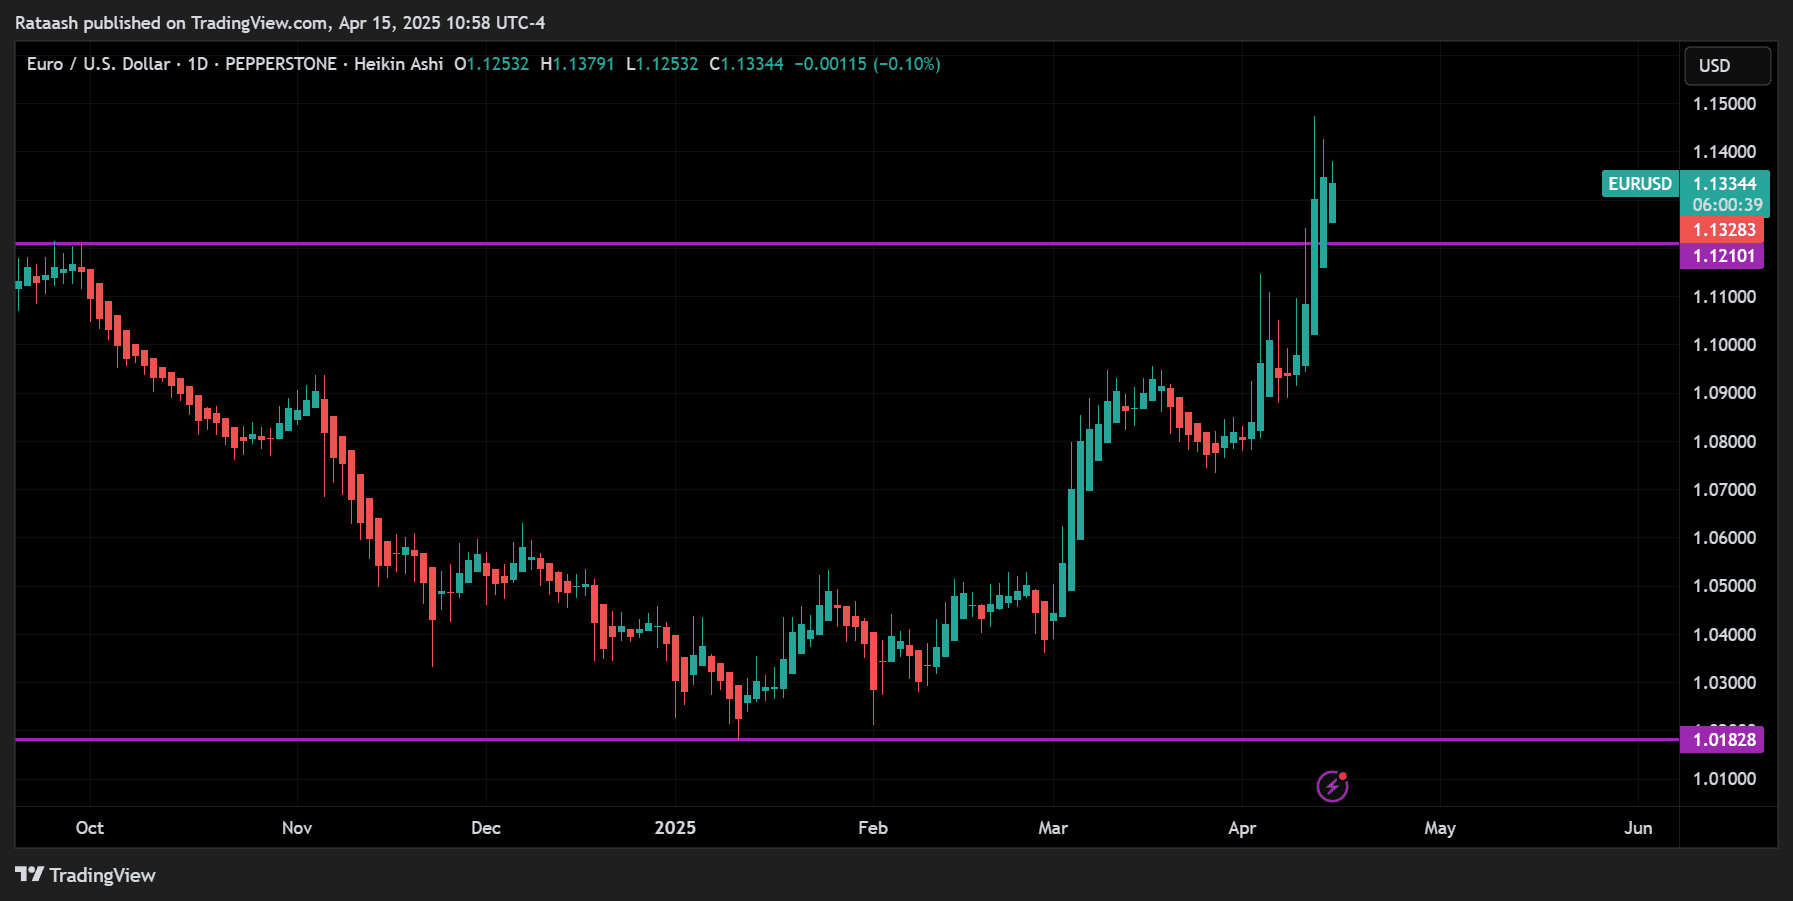
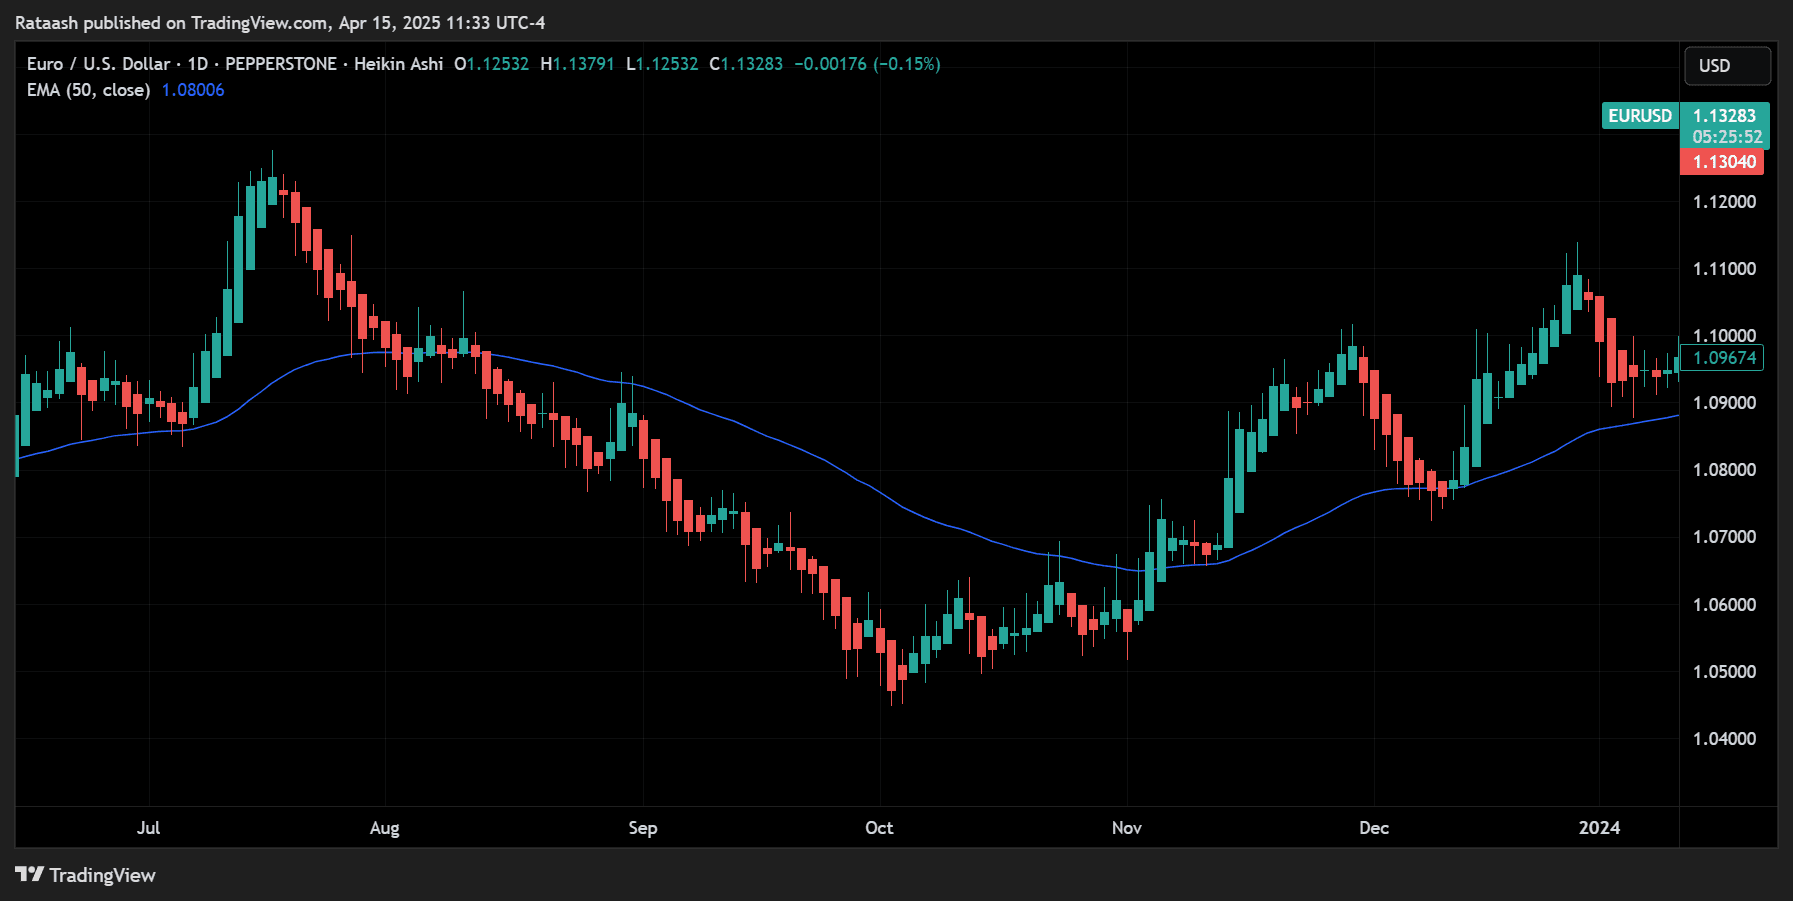
If you place Heiken Ashi on your charting platform, you’ll notice how the uptrend candles are typically more extended and consistent in color (often green or white), and downtrend candles are similarly more uniform in color (often red or black). This uniformity allows you to read the chart more smoothly without the typical “spikes” or false signals you might see with standard candlesticks.
For our purposes, all you need to know is that Heiken Ashi helps you identify trends with fewer false starts. With that out of the way, let’s delve directly into a comprehensive strategy designed around Heiken Ashi to help you become more decisive and consistent in your Forex trading decisions.
Core Components of the Heiken Ashi Strategy
When building a trading strategy around Heiken Ashi, it’s important to define its core components. Many traders misunderstand Heiken Ashi as only a type of candlestick representation. However, for a successful Heiken Ashi trading strategy, you’ll need more than just the candles themselves. These core components typically include:
Timeframe Selection
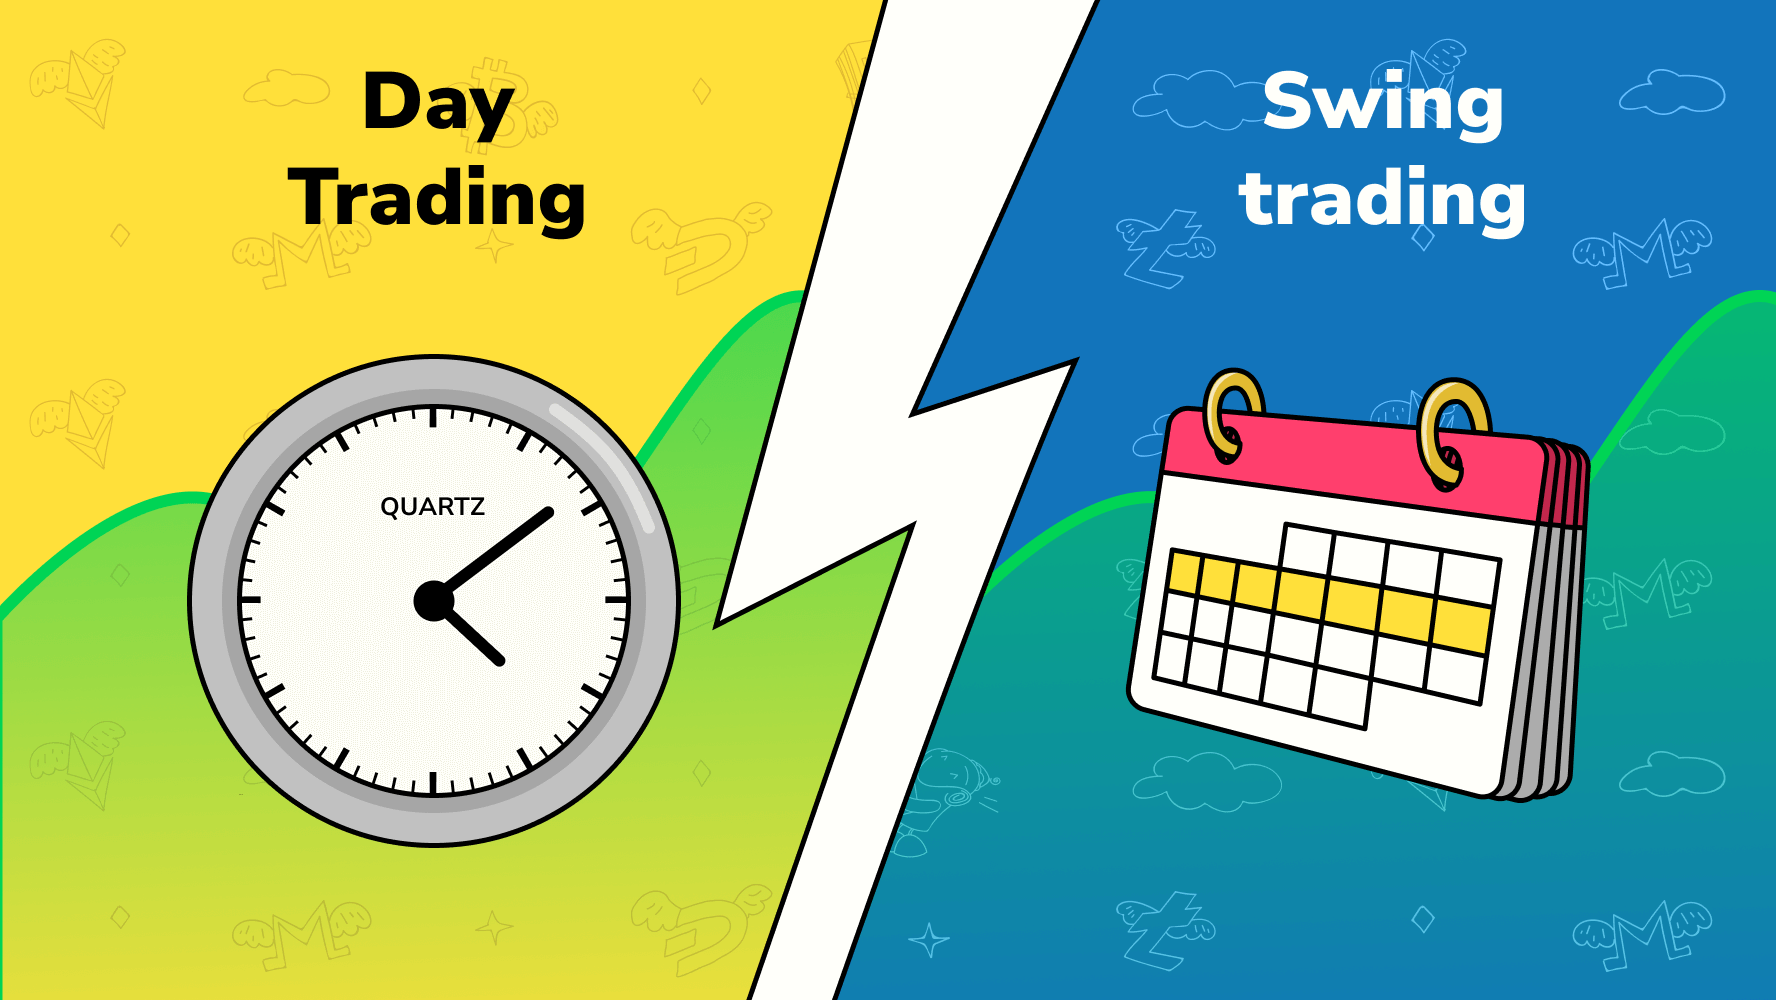
The choice of timeframes is crucial in the Forex market. While Heiken Ashi can be applied on all timeframes, from 1-minute charts to weekly charts, the sweet spot for many swing or short-term traders can be anywhere between the 1-hour and 4-hour charts.
For day traders, the 15-minute or 30-minute chart combined with a higher timeframe reference (e.g., 1-hour or 4-hour) can provide a balance between enough trading opportunities and fewer false signals.
Trend Analysis
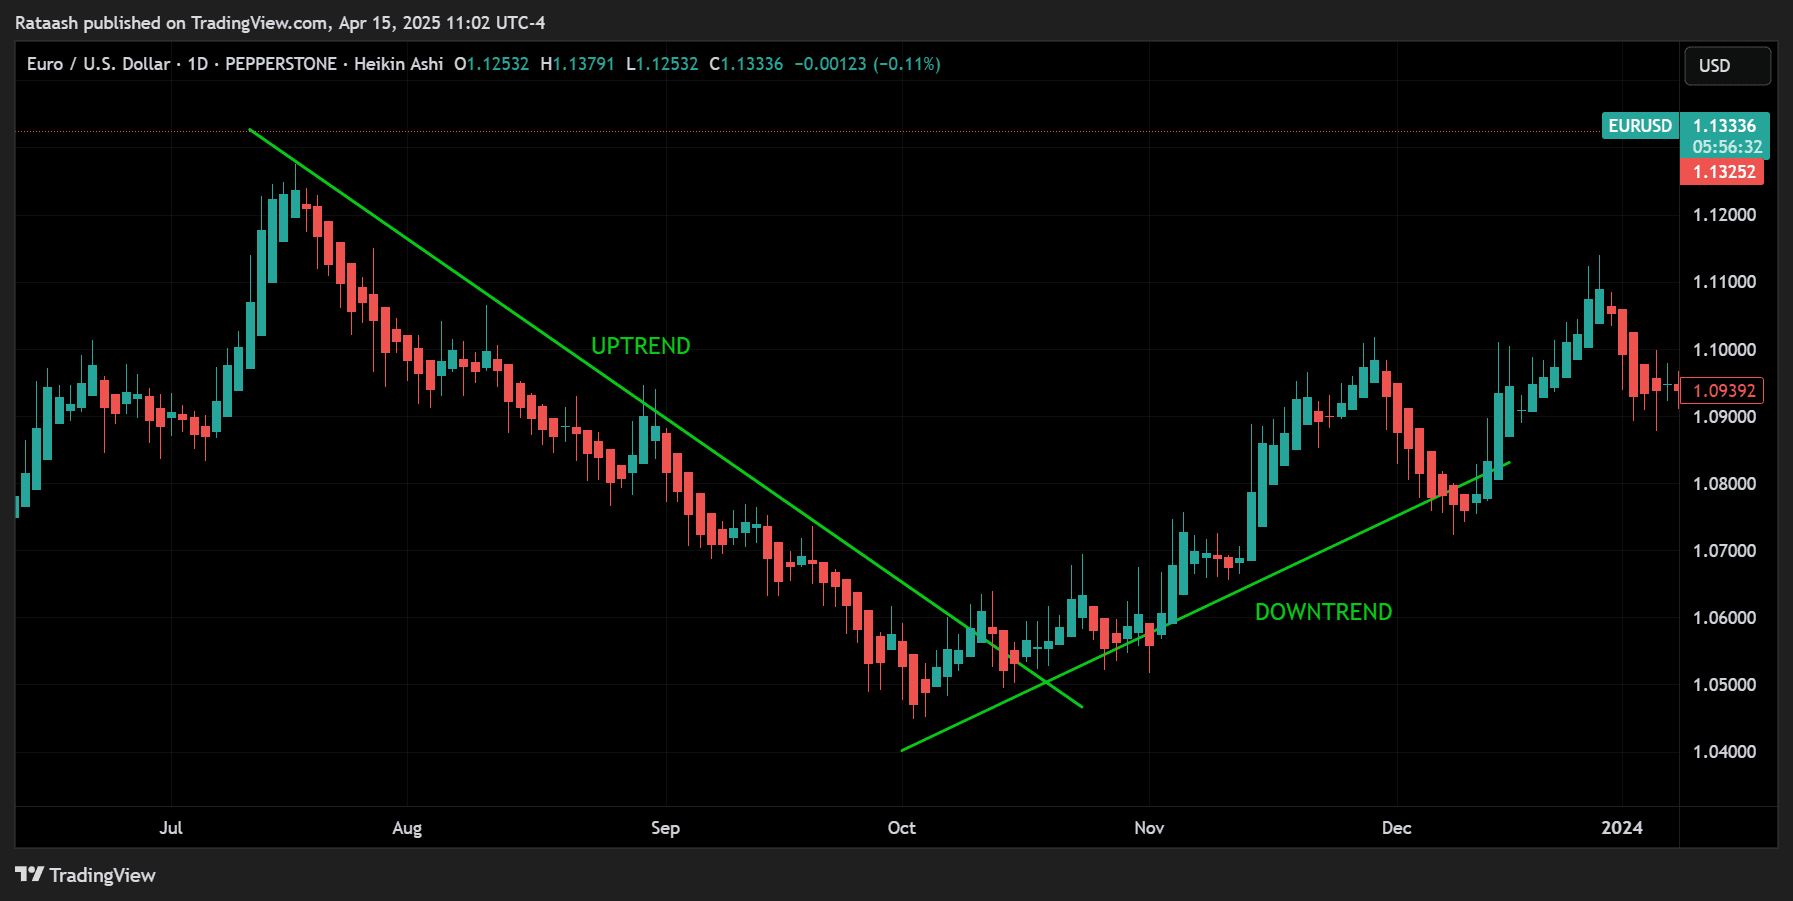
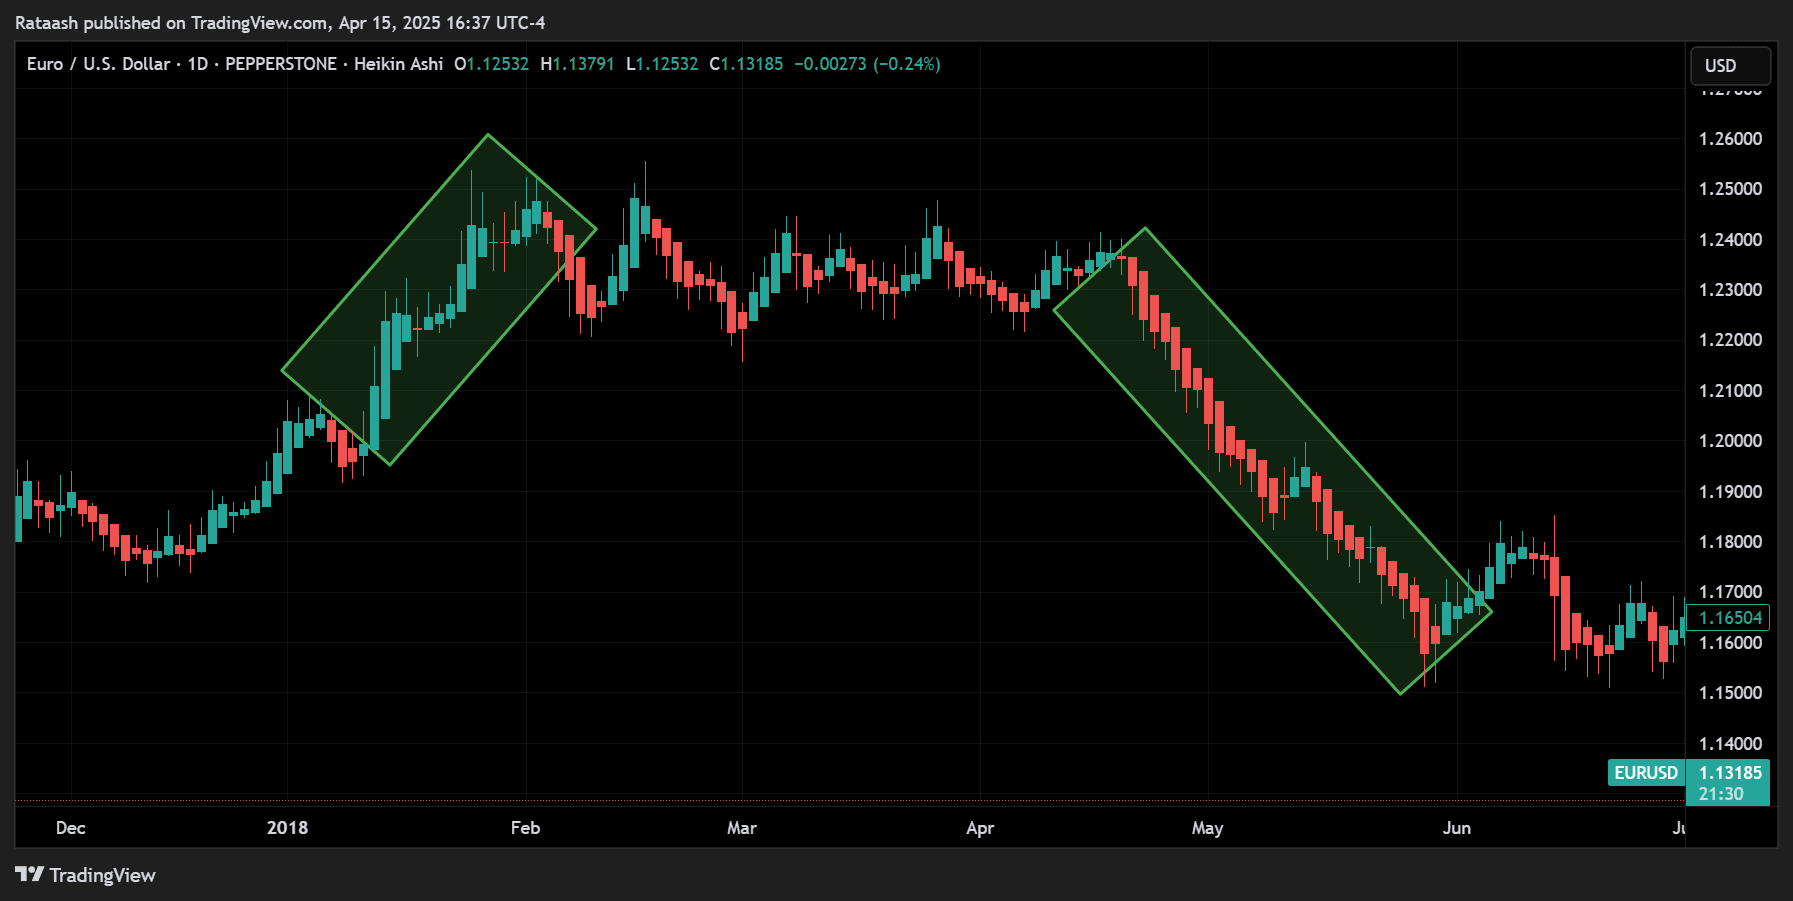
The entire reason for using Heiken Ashi is to have a simpler, more visually appealing depiction of trend direction. For an uptrend, Heiken Ashi bars will generally remain “bullish” with small or no lower wicks, while for a downtrend, they’ll remain “bearish” with small or no upper wicks.
The main idea is: If Heiken Ashi bars are consistently bullish, you focus on buying; if they are consistently bearish, you focus on selling.
Confirmation Indicators (Optional but Helpful)
Some traders find it useful to pair Heiken Ashi candles with a moving average (e.g., a 20-period or 50-period SMA/EMA), or an oscillator like the Relative Strength Index (RSI) or the Moving Average Convergence Divergence (MACD).
While purely price-action-based Heiken Ashi signals can suffice, additional indicators can help verify or confirm that the trend is strong or that momentum is in your favor.
Entry and Exit Tactics
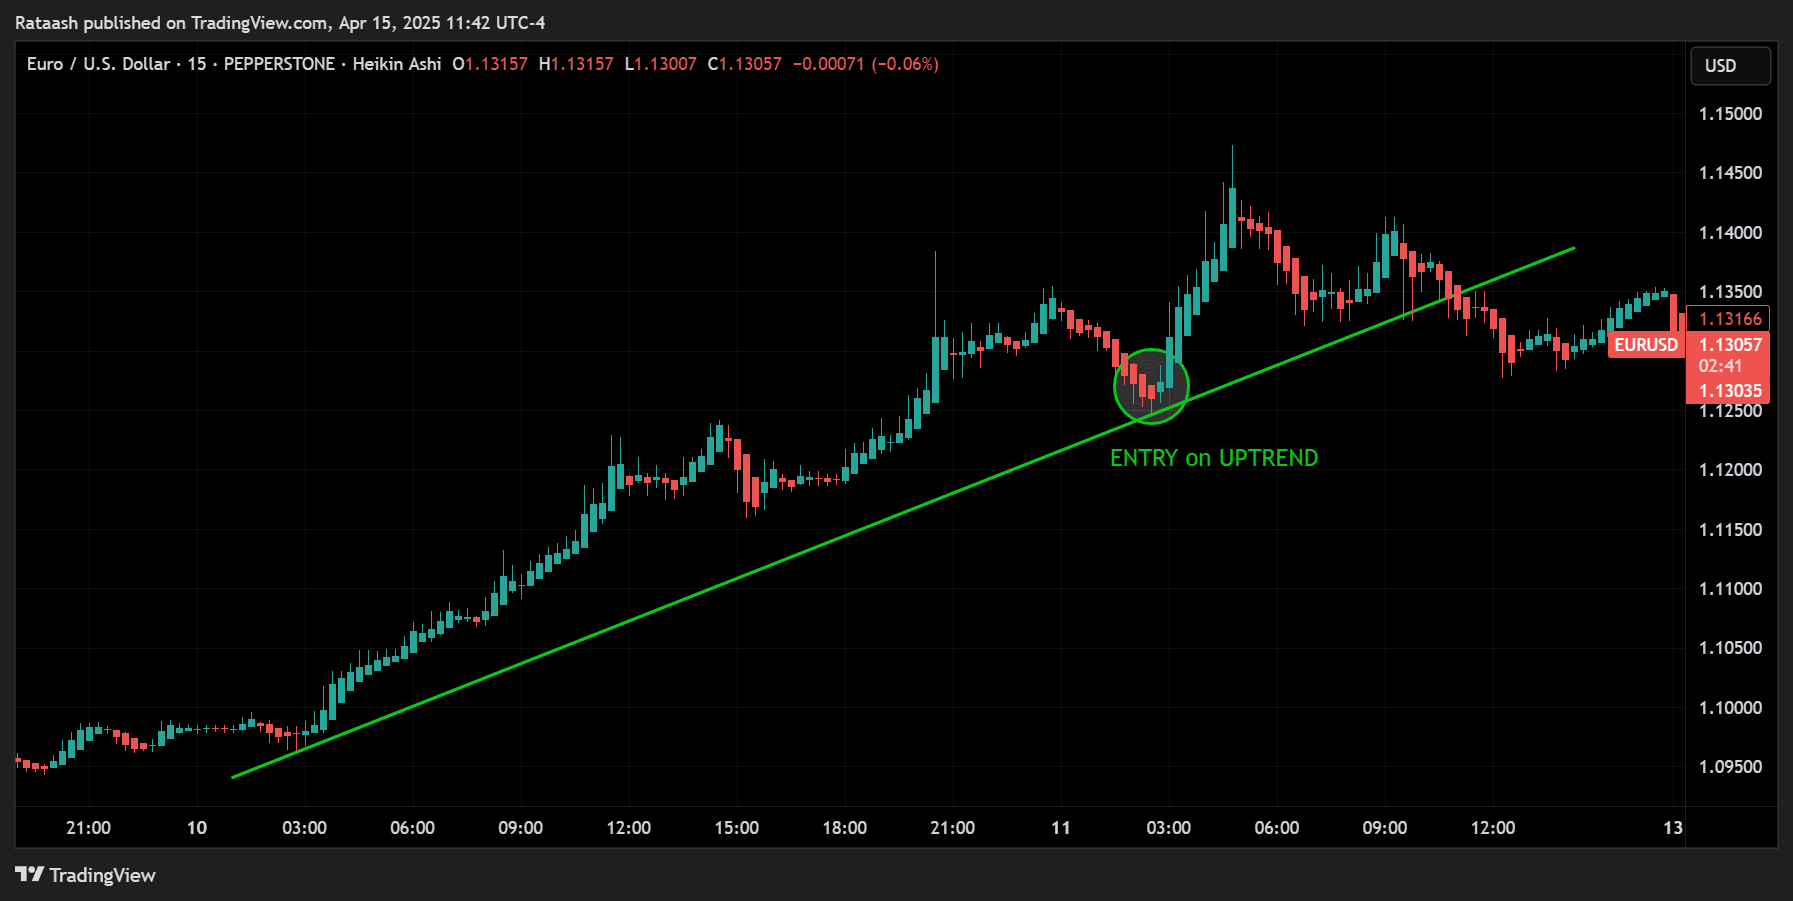
- Entry – Knowing exactly when to enter is critical. The typical approach is to wait for a color change in Heiken Ashi that aligns with your overall trend direction. You can also wait for a “pullback and continuation” signal, where after a minor opposite-colored candle, the main trend color resumes.
- Exit – Exits can be managed either through trailing stop losses (based on candle color change) or by using specific signals from your chosen confirmation indicators (e.g., RSI crossing certain levels, or MACD histogram crossing zero).
Risk Management
No strategy is complete without a solid risk management approach. This includes deciding your position size, your stop-loss placement, and your profit targets. The smoothness provided by Heiken Ashi doesn’t eliminate risk—it only helps you interpret trend direction more clearly.
With these components in mind, let’s take a deep dive into a step-by-step Heiken Ashi Forex trading strategy that emphasizes clarity, consistency, and sustainability. This includes the best ways to identify trends, filter false signals, and minimize drawdowns.
Step-by-Step Heiken Ashi Forex Trading Strategy
Step 1: Chart Setup
Broker & Charting Platform
- Pick a reliable Forex broker and charting platform that offers Heiken Ashi as a chart type or as an overlay. Most popular charting platforms (e.g., MetaTrader, TradingView) have this feature.
Switch to Heiken Ashi
- On your chosen timeframe (for example, 4-hour), switch the chart type from “Candlestick” to “Heiken Ashi.”
- This will immediately smooth out the price representation. Notice how trends look visually “cleaner.”
Add Optional Indicators (If Desired)
- Moving Average: You might add a 20-period or 50-period Simple Moving Average (SMA) or Exponential Moving Average (EMA). The moving average can act as a filter, helping you align your trades with the broader trend.
- Oscillator: You can also add an oscillator like RSI or MACD to look for overbought/oversold readings or momentum shifts.
While these aren’t mandatory, especially if you prefer a price-action-driven approach, they can help less-experienced traders avoid false signals.
Why This Matters: The chart setup is your “foundation.” Ensuring you have a stable representation of Heiken Ashi bars along with any relevant indicators sets the stage for consistent analysis and decision-making.
Step 2: Identify the Dominant Trend Using Heiken Ashi Clarity
Observe Candle Colors
- If the recent Heiken Ashi bars are predominantly bullish (often green or white, depending on your chart setting), you are likely in an uptrend.
- If the recent bars are predominantly bearish (often red or black), you are likely in a downtrend.
Look at the Wicks
- In a strong uptrend, bullish Heiken Ashi candles generally have no lower shadow (or a very small one).
- In a strong downtrend, bearish Heiken Ashi candles generally have no upper shadow (or a very small one).
Use a Higher Timeframe for Context
- Although you might be trading on a 1-hour or 4-hour chart, glance at the daily chart’s Heiken Ashi structure to confirm the overall trend. Trading in the same direction as the daily Heiken Ashi can help filter out lower-probability trades.
By focusing on candle colors and their wicks, Heiken Ashi makes it easier to interpret whether a market truly is trending or if it’s in a period of consolidation. The rule of thumb: Trade in the direction of the overall color and wick formation on your chosen timeframe (and ideally confirmed by a higher timeframe).
Step 3: Wait for Confirmed Trend Signals
Trend Continuation vs. Trend Reversal
- A typical confirmation for an uptrend is a series of bullish Heiken Ashi bars with little to no lower wicks forming consecutively.
- A typical confirmation for a downtrend is a series of bearish Heiken Ashi bars with little to no upper wicks forming consecutively.
Avoid Choppy Markets
- Sometimes, you’ll see a rapid flip-flop: one bullish bar followed by a bearish bar, then bullish, etc. This indicates a choppy or sideways market. It’s best to wait for a clear run of at least two to three consecutive bullish or bearish candles to confirm momentum.
Moving Average Crossover (Optional)
- If you have a 20 EMA and a 50 EMA, a bullish crossover (where the 20 EMA crosses above the 50 EMA) while Heiken Ashi candles are bullish can reinforce the signal.
- Conversely, a bearish crossover (20 EMA dips below 50 EMA) when Heiken Ashi candles are bearish can confirm a downtrend.
Insight: Heiken Ashi alone can suffice, but if you’re new to the method, combining it with a straightforward indicator-based filter can significantly reduce the number of false or premature entries.
Step 4: Entry Techniques
Download a Collection of Indicators, Courses, and EA for FREE
Now that you have determined the direction of the trend and seen some confirmation, it’s time to enter a trade. Here are a few recommended techniques:
Breakout Entry with Heiken Ashi Confirmation
- Identify a recent swing high/low or a consolidation zone on your Heiken Ashi chart.
- When the price clearly breaks above a recent swing high (in an uptrend), enter a long position.
- Confirm that Heiken Ashi candles are bullish with minimal lower wicks at the time of breakout.
- Reverse logic applies for downtrend breakouts—breaking a swing low and Heiken Ashi consistently bearish.
Pullback & Continuation Entry
- Wait for a bullish run (uptrend), then watch for one or two bearish Heiken Ashi bars signifying a pullback.
- If the next candle turns back to bullish with minimal lower wick and aligns with your overall uptrend, this is a potential entry signal. Essentially, you’re joining the main trend after a minor correction.
- For a downtrend, the pullback would be a bullish bar or two in an overall bearish structure, then re-entry once the next Heiken Ashi candle switches back to bearish.
Indicator-Based Entry (Optional)
- For traders using RSI (14-period, for instance), you might enter a trade in an uptrend when RSI recovers from a slight dip (e.g., crossing back above 50).
- Ensure Heiken Ashi signals (i.e., color and wick formation) align with the direction of the RSI momentum crossover.
Key Takeaway: Patience is essential. Whether using breakouts, pullback-continuation, or indicator-based triggers, Heiken Ashi helps confirm that the market is indeed following the trend you identified. Rushing in at the first color change can sometimes lead to losses if you haven’t confirmed the move.
Step 5: Stop-Loss Placement & Risk Management
Stop-Loss Placement
- For an uptrend trade, place your stop loss slightly below the most recent swing low or below a significant Heiken Ashi wick. Because Heiken Ashi wicks are often small in strong trends, you might want to give some extra “buffer.”
- For a downtrend trade, place your stop loss slightly above the most recent swing high or above a notable Heiken Ashi wick.
Position Sizing
- Aim to risk only a small percentage of your trading account per trade (e.g., 1-2%). This ensures you can handle a string of losses without major drawdowns.
- Always calculate your lot size based on the distance from your entry to your stop loss and your account’s risk tolerance.
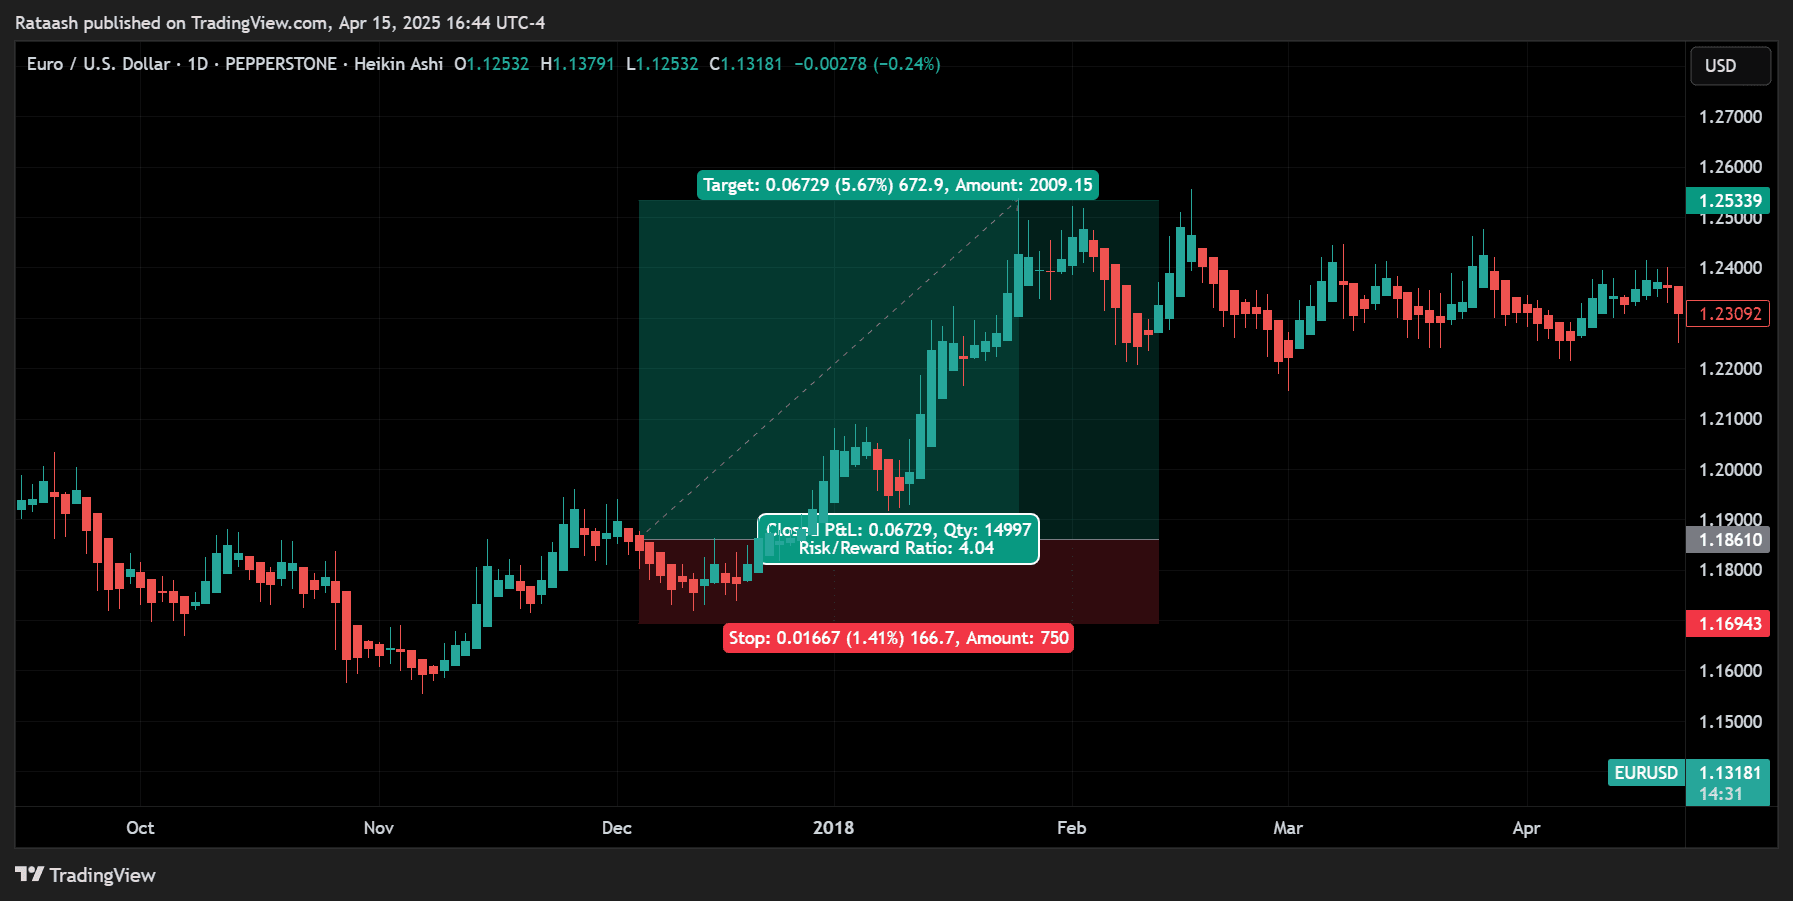
Risk-to-Reward Ratio
- Generally, look for trades offering at least a 1:2 risk-to-reward ratio. That means if you’re risking 50 pips, your target should ideally be around 100 pips or more.
- If the trade has strong momentum, you can trail your stop to capture extended runs rather than using a fixed target.
Trailing Stop vs. Fixed Target
- Trailing Stop: As new Heiken Ashi candles form in your favor, you can shift your stop loss closer to the current price (e.g., just below each new bullish candle in an uptrend). This locks in profits if the trend continues.
- Fixed Targets: Alternatively, you can set a specific price target based on support/resistance levels, Fibonacci extensions, or pivot points.
Remember that no strategy—no matter how accurate—can guarantee 100% winning trades. Incorporating robust risk management ensures that even if you experience a string of losses, you can quickly recover when a big, trending trade finally appears.
Step 6: Exiting Trades Strategically
One of the reasons traders gravitate to Heiken Ashi is the way it helps keep you in a trend longer. But eventually, trends do reverse. Knowing how and when to exit a position is just as important as entry.
Color Change Exit
- The simplest exit rule: Exit when the candle color changes from bullish to bearish (for a long position) or from bearish to bullish (for a short position).
- This color change often indicates a momentum shift. While it can sometimes be a minor pullback, you might prefer to take profits (or partial profits) at that point and re-enter if the main trend resumes.
Use a Trailing Stop
- If you’re in a strong uptrend, keep trailing your stop loss below each successive bullish Heiken Ashi candle. Once a candle flips color, your stop might get triggered, effectively locking in accumulated gains.
- The advantage here is that if the market surges strongly in your favor, you ride the wave and let your winners run.
Technical Targets & Confluence
- You may also exit at strong support/resistance zones, Fibonacci retracement or extension levels, or psychological round numbers.
- Watch for confluence between Heiken Ashi color/wick changes and these key price levels for more precise exits.
Step 7: Documentation & Continuous Improvement
Trading success relies on systematic improvement. Keep detailed records (trading journal) of your entries, exits, and reasoning—particularly how the Heiken Ashi strategy guided your decisions.
Journal Your Trades
- Write down the date, currency pair, timeframe, entry rationale, stop loss, and final outcome.
- Note if you followed all your Heiken Ashi signals or if you deviated.
Periodic Review
- At the end of the week or month, review your trades.
- Identify common mistakes (e.g., taking a trade in a choppy market or placing stops too close).
Refine Your Approach
- Over time, you might find that certain timeframes or currency pairs respond more effectively to the Heiken Ashi strategy. Focus on those and refine your risk management accordingly.
This step might seem tedious, but it’s the “secret sauce” behind many professional traders’ success. They constantly evaluate their performance and adjust to market conditions.
Detailed Discussion on Key Subtopics
While the above seven steps outline how to trade with Heiken Ashi, it’s worth exploring certain subtopics in more detail. This will deepen your understanding and help you become more proficient at executing the Heiken Ashi Forex trading strategy.
Timeframe Correlation & Multiple Timeframe Analysis
- Higher Timeframe Confirmation – Even if you’re executing trades on a 1-hour chart, glancing at the 4-hour or daily chart’s Heiken Ashi can provide a “big picture” context. If the higher timeframe is bullish, you increase the probability of success by only taking bullish signals on the lower timeframe.
- Avoid Conflicting Signals – If the daily chart’s Heiken Ashi bars are deeply bearish yet your 15-minute chart shows a bullish run, that short-term rally may quickly fizzle out. Knowing the higher timeframe context can prevent you from jumping into short-lived or risky countertrend trades.
Combining Heiken Ashi with Other Price Action Clues
- Support & Resistance – Even though Heiken Ashi filters a lot of noise, major support and resistance zones remain critical. When a bullish Heiken Ashi candle forms just above a strong support area, this is an even stronger signal.
- Chart Patterns – Classic chart patterns like head-and-shoulders, triangles, or double bottoms/tops can still be observed on Heiken Ashi charts. The edges might look slightly different, but the underlying price structure remains.
The Psychology of Smooth Trends
- Fewer Emotional Swings – Traders often get shaken out of good trades by the volatility shown in standard candlesticks. Heiken Ashi’s smoothing effect helps you “ride the wave” longer.
- Confidence in Signals – Seeing a series of consistent-colored bars fosters more conviction in the direction of the trade. This can reduce premature exits caused by fear or doubt.
Potential Drawbacks of the Heiken Ashi Strategy
No approach is perfect, and being aware of limitations can save you from pitfalls:
Lag in Signals
- Because Heiken Ashi averages price data, there is an inherent lag compared to standard candlesticks. Reversals might not be spotted as quickly, which can occasionally cause you to miss an optimal entry or exit.
False Trends in Low Volume Conditions
- In thinly traded markets or during low-volume sessions (e.g., late Friday), Heiken Ashi might show a trend that quickly reverses once volume picks up.
- To counter this, focus on more liquid pairs and higher timeframes.
Candlestick Analysis Limitations
- While Heiken Ashi helps identify trends, it can obscure some traditional candlestick patterns like doji, pin bars, or engulfing bars.
- If your strategy heavily relies on exact open/close relationships from standard candlesticks, the Heiken Ashi representation might not be as useful.
These drawbacks aren’t deal breakers; rather, they are points to keep in mind as you refine your Heiken Ashi trading methodology.
Practical Examples of Heiken Ashi Forex Trades
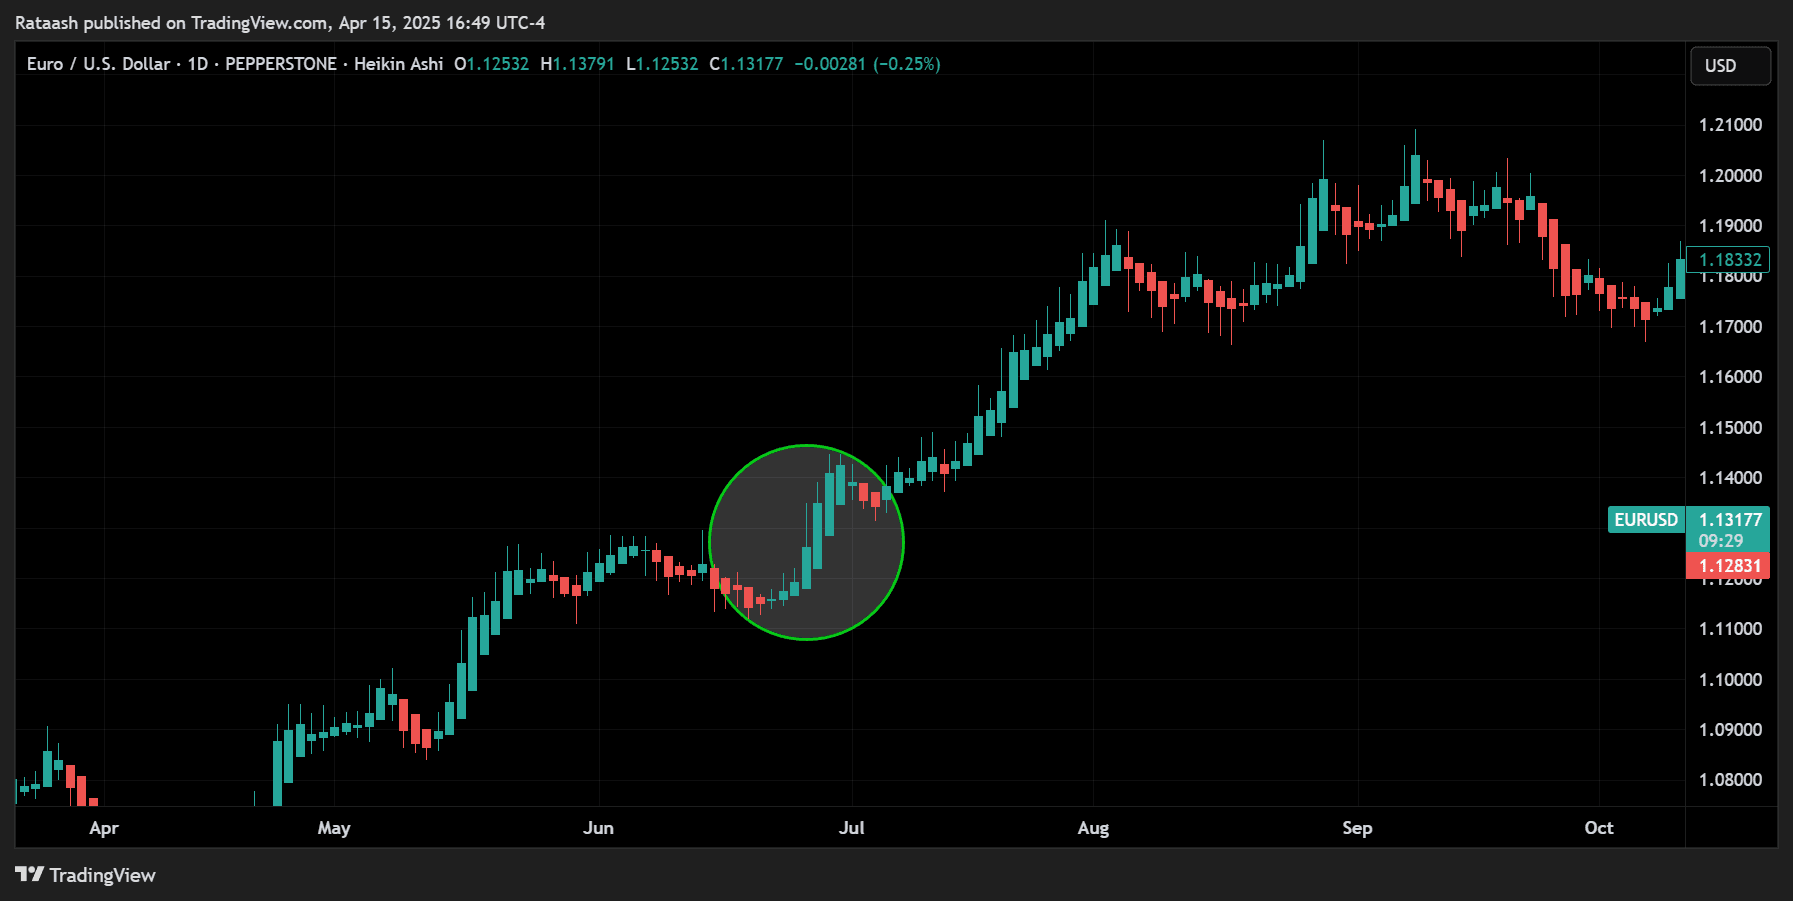
Example 1: Pullback & Continuation in an Uptrend
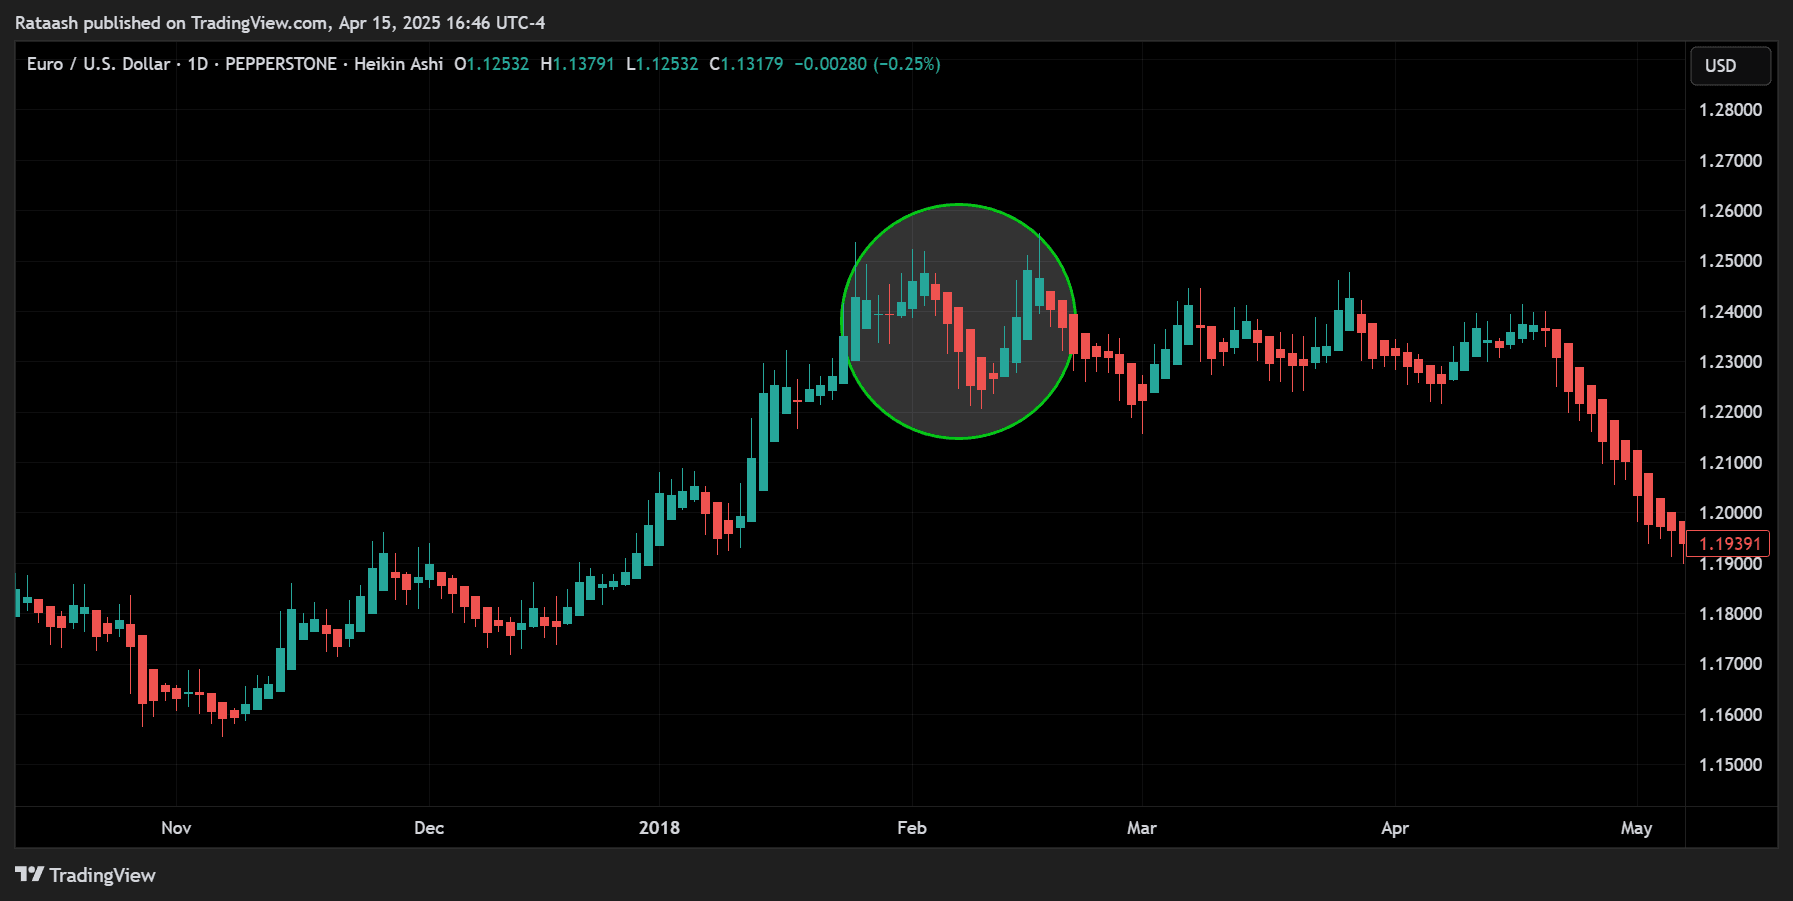
- Scenario – Assume EUR/USD on a 4-hour chart is showing a clear bullish run with four consecutive green Heiken Ashi candles, each having little to no lower wick.
- Pullback – Suddenly, you see one or two red candles forming. However, these red Heiken Ashi bars have small bodies and appear near a minor support level (e.g., a previous swing high).
- Continuation Signal – The next candle turns green with no lower wick. You enter a long trade at the open of this new bullish candle.
- Stop Loss – Set the stop loss below the minor swing low formed during the red candle pullback.
- Target – Aim for a 1:2 risk-to-reward or place your trailing stop below each new bullish candle as the uptrend continues.
Within a few candles, if the market continues upward, you ride the move until you see another color change or hit your take-profit goal.
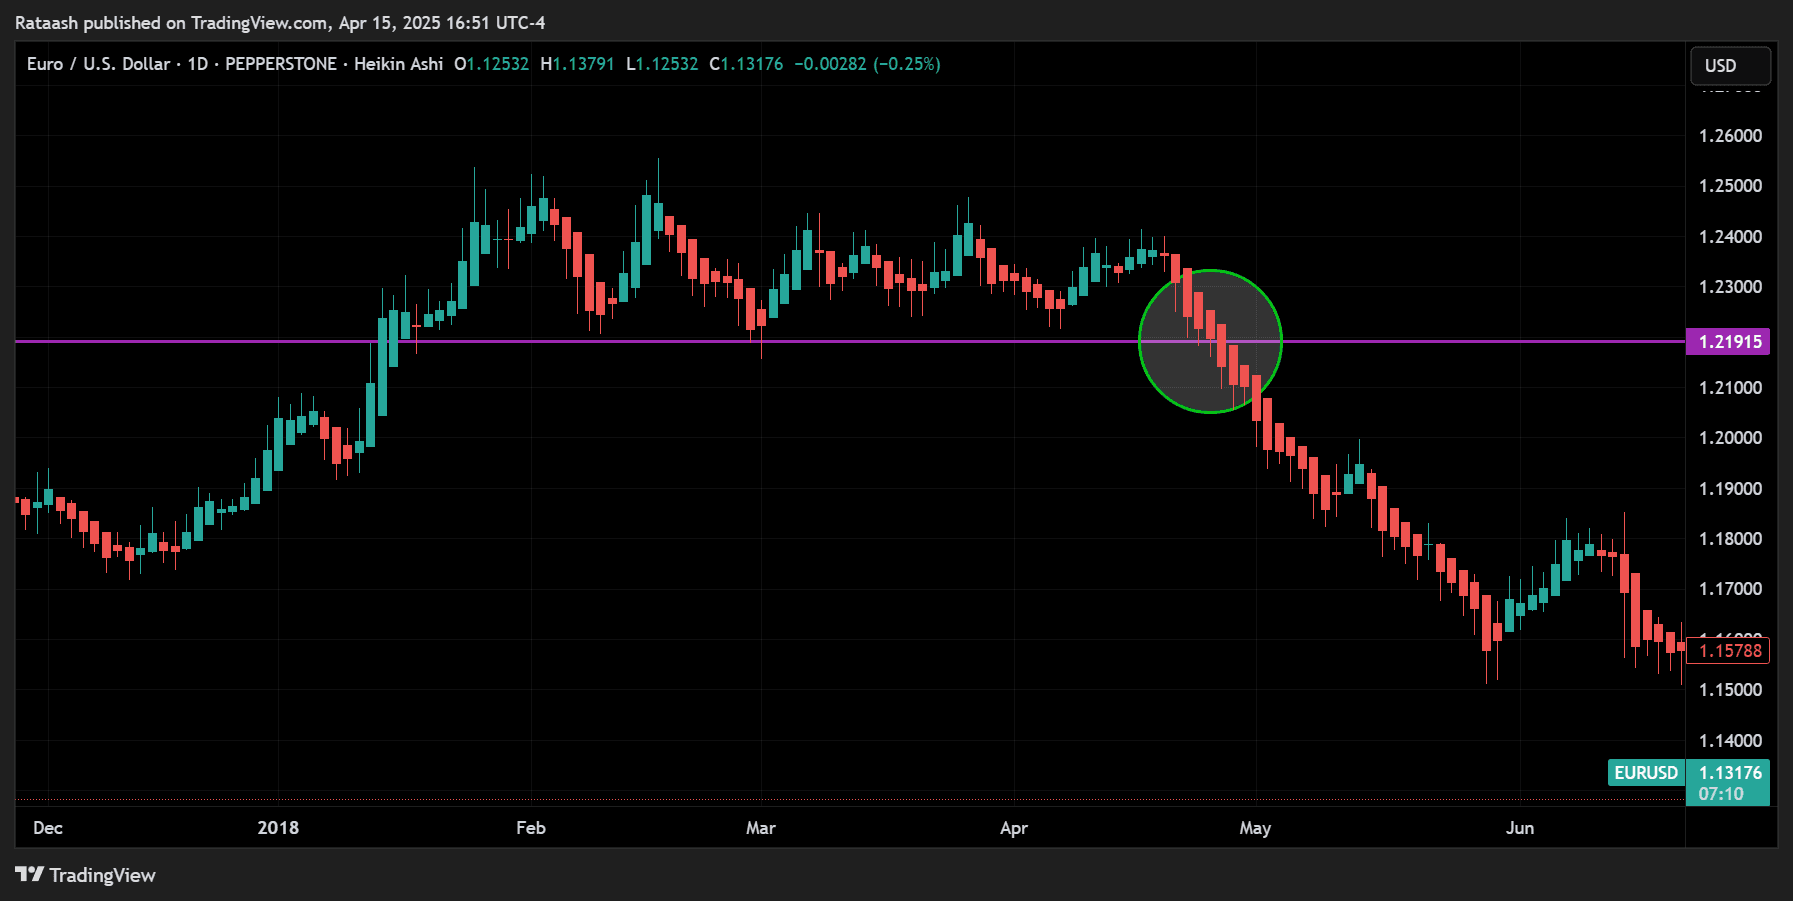
Example 2: Breakout in a Downtrend with Confirmation Indicator
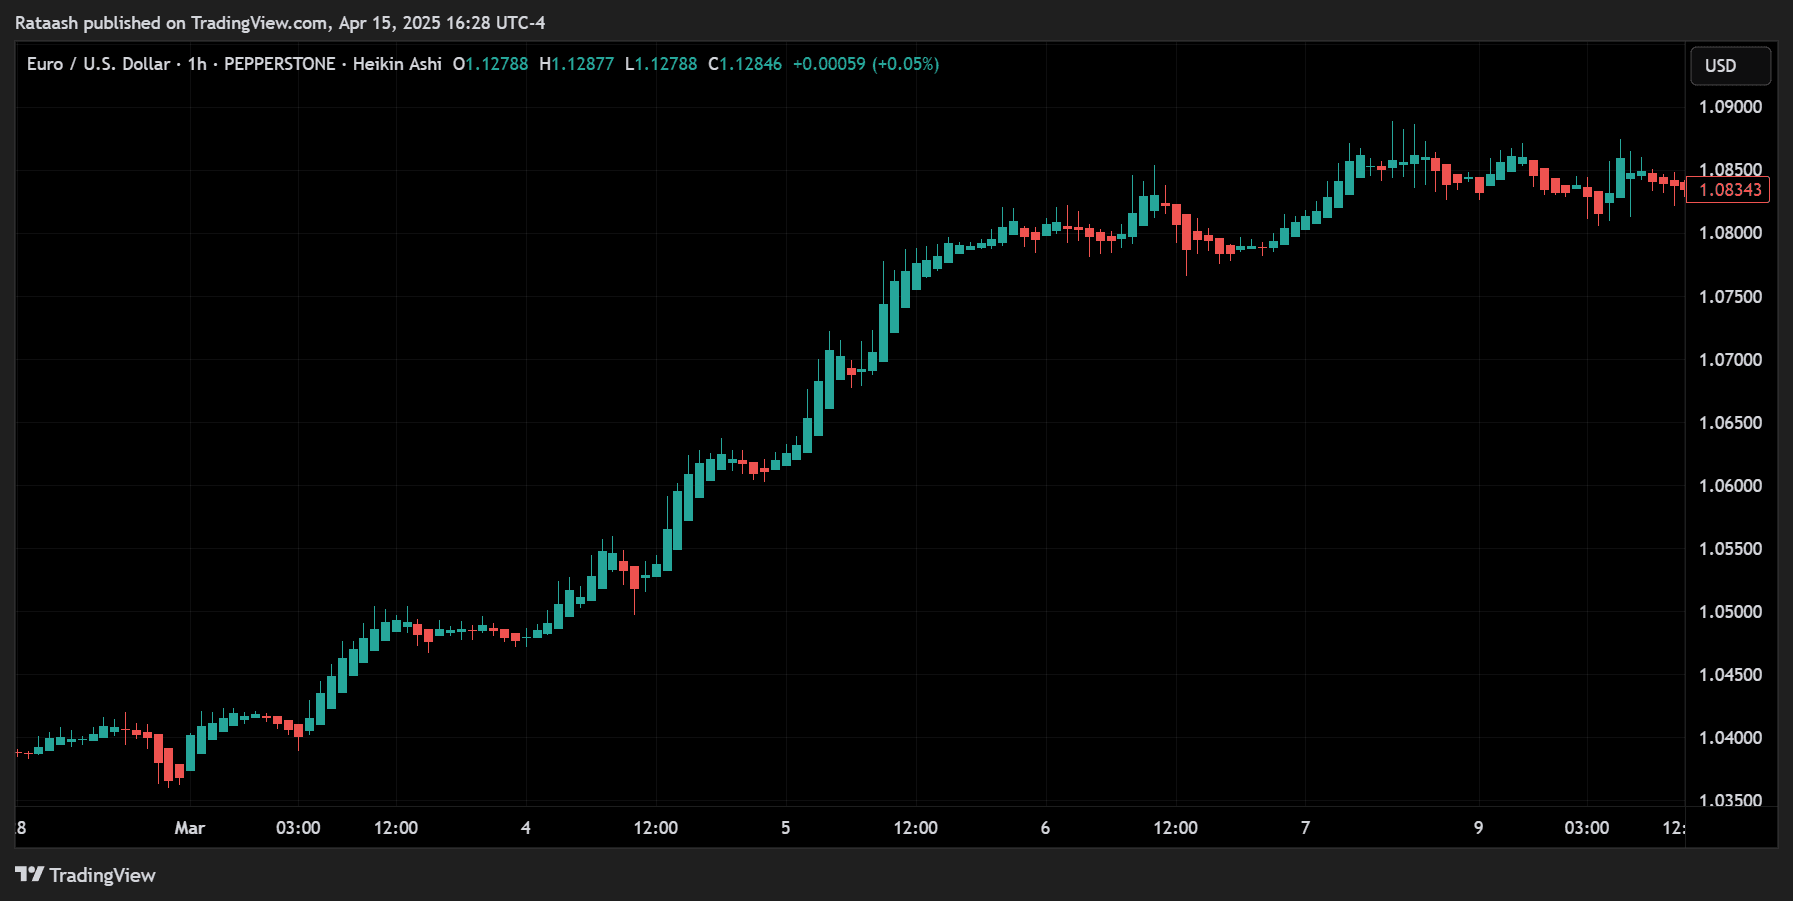
- Scenario – On GBP/USD 1-hour chart, you notice a consolidation forming after a previous downtrend. The Heiken Ashi candles are mostly red, but the price is stuck in a small range.
- Indicator Check (Optional) – The 20 EMA is below the 50 EMA, confirming a bearish bias. RSI is also hovering below 50, suggesting bearish momentum.
- Breakout – Price breaks below the consolidation range, forming a decisive red Heiken Ashi candle with no upper wick. You enter short.
- Stop Loss – Just above the consolidation high or a recent swing high.
- Trade Management – As each new red Heiken Ashi candle forms, you trail your stop loss or hold until you see a color change signaling a potential reversal.
In this scenario, the combination of Heiken Ashi plus a breakout below a key support level in a bearish environment can lead to a high-probability short.
Risk Management & Position Sizing Mastery

While the above strategy details how to use Heiken Ashi to enter and exit trades, the cornerstone of success lies in risk management and position sizing. Let’s dive deeper:
Determining Your Stop-Loss Levels
Because Heiken Ashi bars can occasionally have smaller wicks during strong trends, ensure you’re not placing your stop loss too close. If the market experiences a normal fluctuation, you could be stopped out prematurely. A common tactic:
ATR (Average True Range) Filter: Check the ATR(14) value on your Heiken Ashi chart. If it’s 20 pips, consider adding a small buffer (e.g., 1 x ATR) below the candle’s wick for a long position. This approach accounts for typical volatility.
Calculating Your Position Size
- Determine the Pips at Risk: Subtract your entry price from your stop-loss price for a long trade; that is your pips at risk.
- Decide Your Account Risk: If you want to risk 1% of a $10,000 account, that’s $100.
- Position Size Formula:
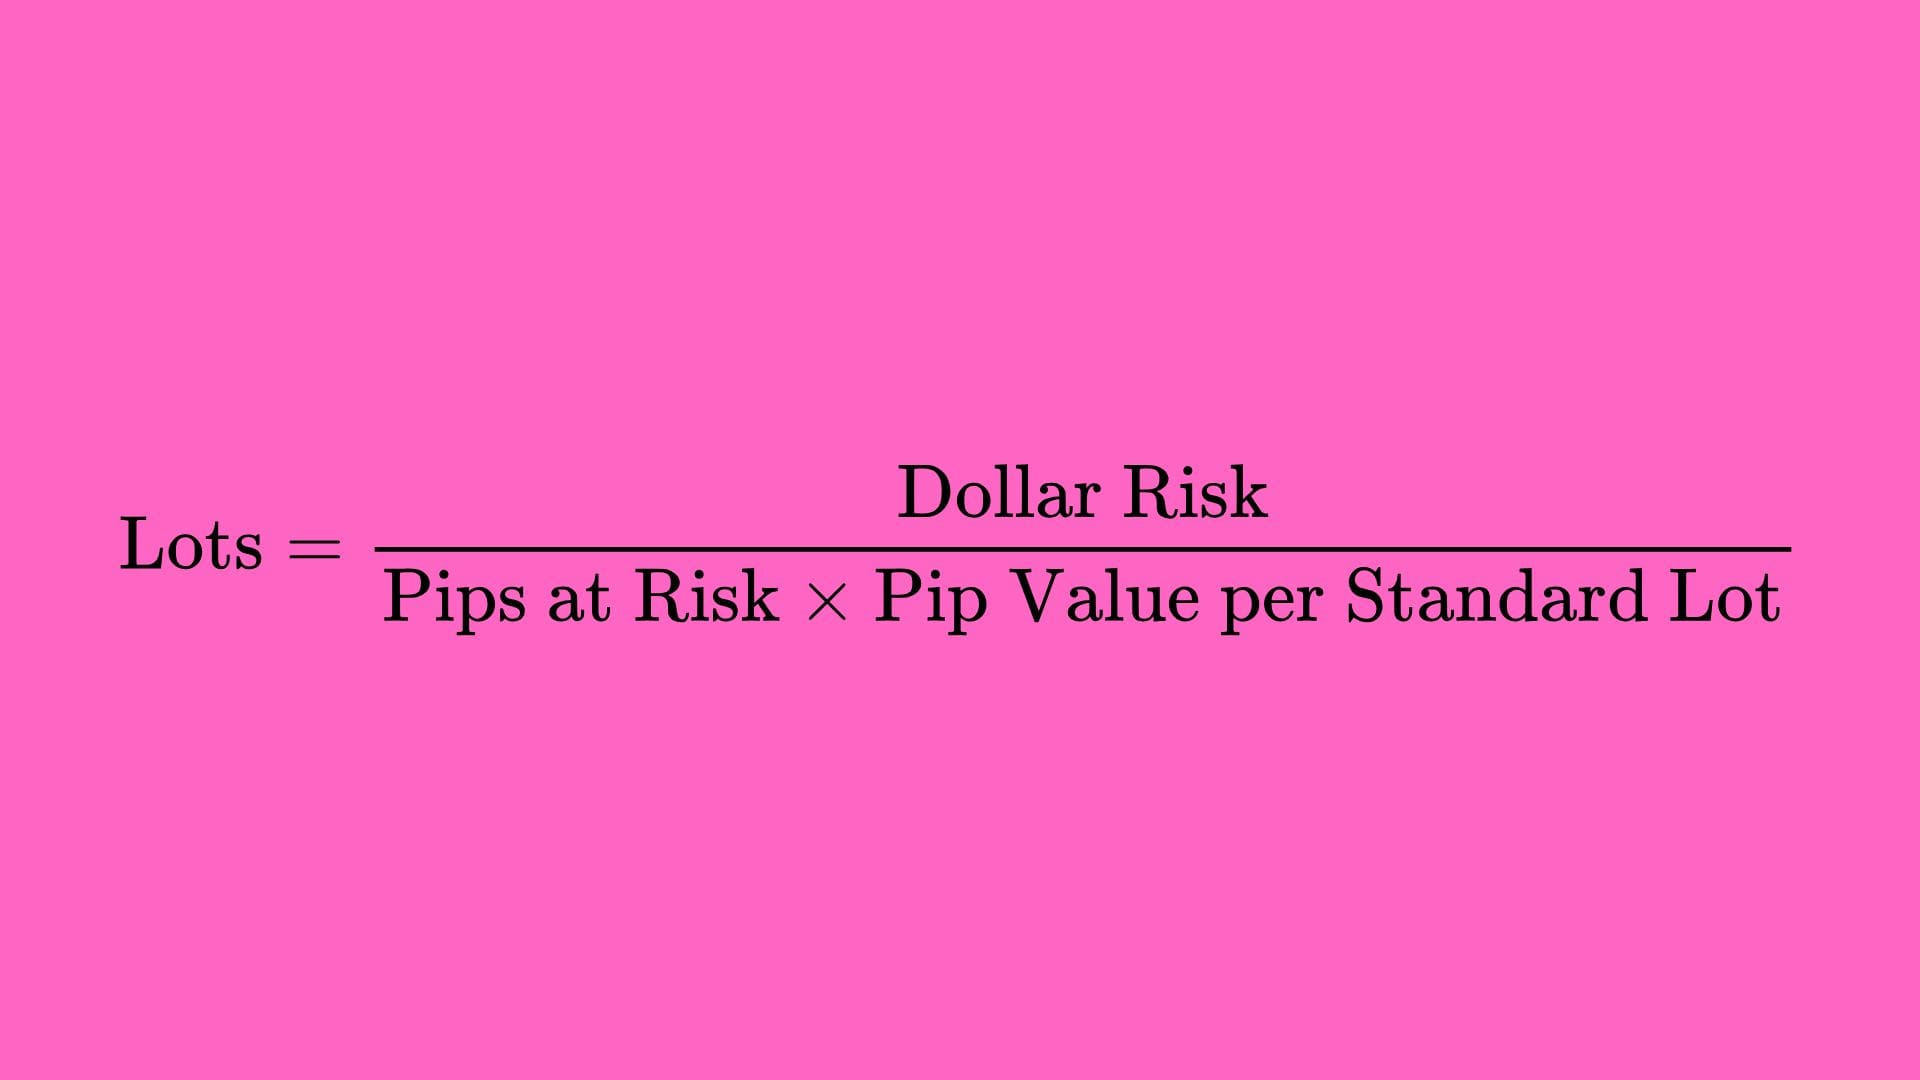
For many Forex pairs, 1 pip in a standard lot is $10. If you’re risking 50 pips, your total cost if stopped out would be 50 x $10 = $500 per standard lot. Therefore, to limit it to $100, you’d take 0.2 of a standard lot.
You can also use our lot size calculator.
Handling Multiple Trades & Correlated Pairs
- Limiting Correlation – If EUR/USD and GBP/USD often move in tandem, opening large positions on both might effectively double your risk to the USD side.
- Diversification – Consider trading uncorrelated pairs or limiting your total risk exposure if you have open trades on multiple correlated currency pairs.
Common Pitfalls & How to Avoid Them

Despite Heiken Ashi’s smoothing capabilities, traders still make mistakes. Here are common pitfalls and solutions:
1. Trading Against the Higher Timeframe Trend
You see a short-term color change on a lower timeframe and jump into a trade, only to be whipsawed by the larger trend.
Solution: Always check the next higher timeframe (e.g., daily or 4-hour) to ensure you’re not trading against a dominant trend.
2. Ignoring News & Major Events
Even a smooth Heiken Ashi chart can be disrupted by high-impact news (e.g., Non-Farm Payroll, interest rate decisions).
Solution: Keep track of the economic calendar and avoid or reduce risk around major announcements.
3. Setting Stops Too Tightly
Placing a stop-loss too close to your entry because Heiken Ashi wicks are small can lead to frequent stop-outs.
Solution: Use an ATR-based approach or a buffer below (or above) the most recent swing level.
4. Overcomplicating with Too Many Indicators
Adding numerous oscillators, lines, and bands can obscure the clarity Heiken Ashi is designed to provide.
Solution: Keep it simple. One or two indicators for confirmation is typically enough.
5. Not Letting Winners Run
Exiting too soon out of fear, missing out on the true potential of a strong trend.
Solution: Use trailing stops or wait for a genuine candle color change to exit, relying on Heiken Ashi’s inherent trend-following strengths.
By being aware of these pitfalls, you’ll be better prepared to use Heiken Ashi as an effective weapon in your trading arsenal.
Adapting the Strategy to Different Market Environments
Forex markets are dynamic; some are more trending (e.g., during a strong economic shift), while others are range-bound for weeks or even months. How does this strategy fare in various conditions?
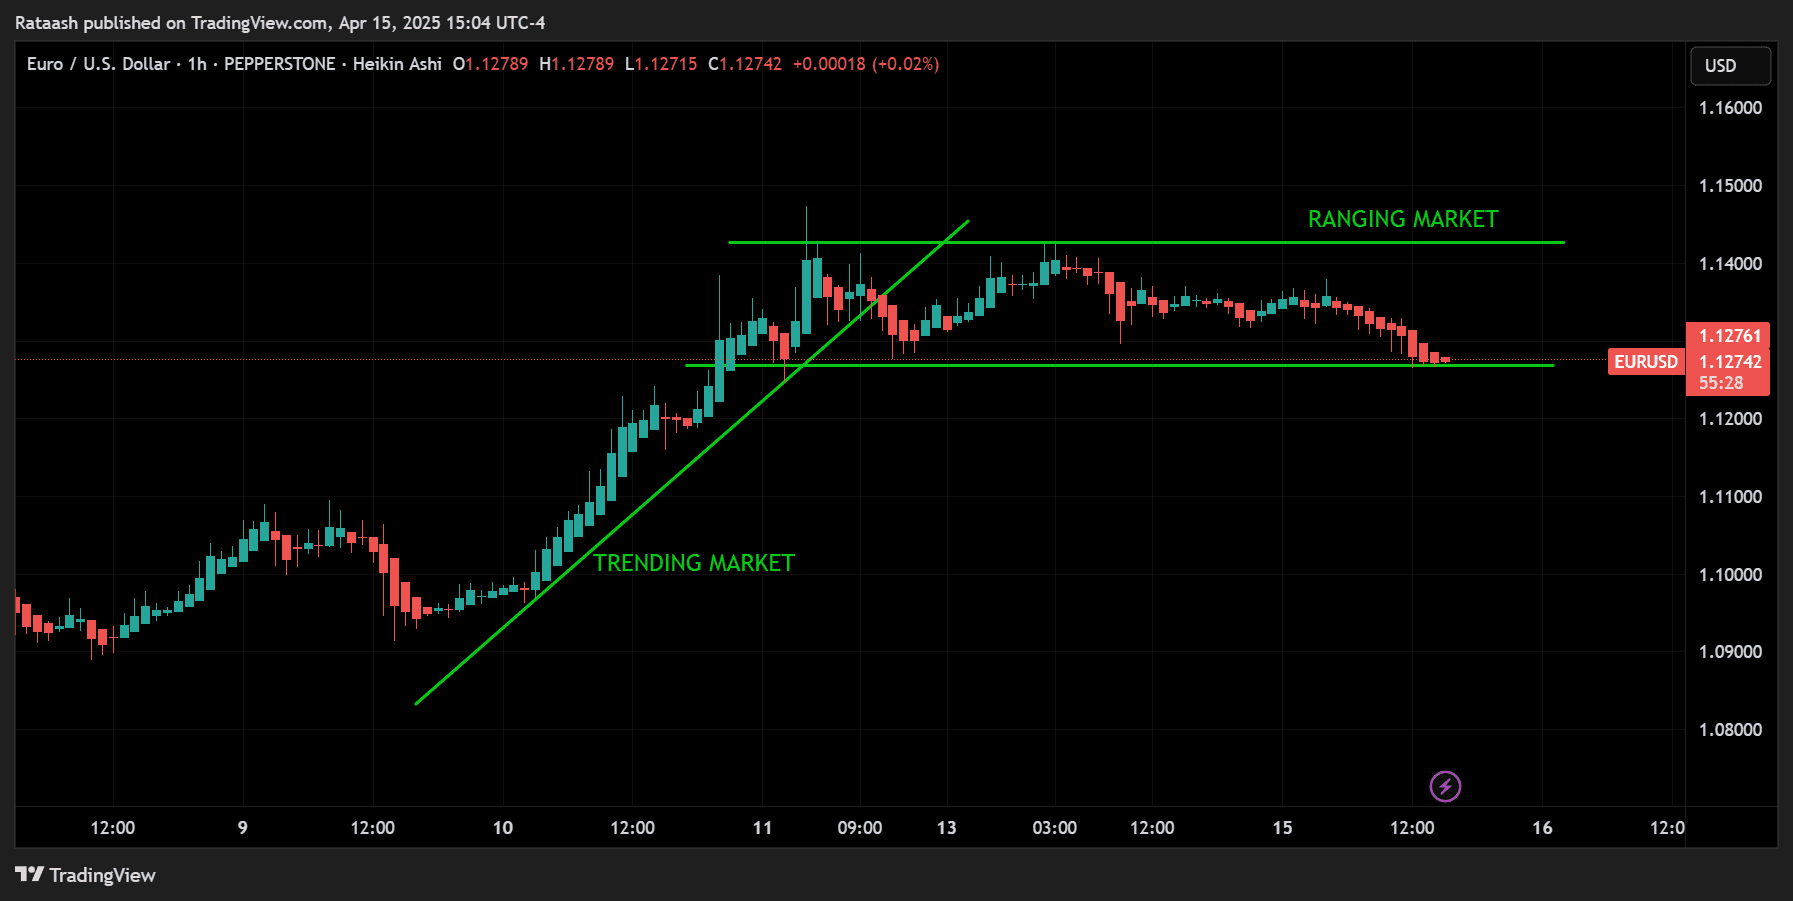
Trending Markets
- Ideal Environment: Heiken Ashi thrives here. The smoothing effect captures big runs with minimal confusion, keeping you in trades for longer.
- Tip: Use trailing stops to capitalize on large, extended moves.
Range-Bound or Choppy Markets
- Challenge: You’ll see frequent color flips, leading to potential whipsaws.
- Tip: Stand aside or trade only confirmed breakouts from the range. Combining Heiken Ashi with major support/resistance or Bollinger Bands can help identify range extremes.
News-Driven Volatile Markets
- Risk: The smoothness of Heiken Ashi may not protect you from sudden price spikes or slippage during news.
- Tip: Reduce position sizes or avoid trading during major news events. If you do trade, widen your stops to account for volatility.
Frequently Asked Questions
Is Heiken Ashi Suitable for Beginners?
Absolutely. Heiken Ashi provides a simplified view of price action. Beginners often find that it reduces the “analysis paralysis” caused by the noise of standard candlesticks. However, practice on a demo account and combine Heiken Ashi with solid risk management before going live.
Can I Use Heiken Ashi for Scalping?
Yes, but you must be mindful of the inherent lag. If you’re scalping on 1-minute or 5-minute charts, Heiken Ashi’s smoothing could delay your signals slightly. Some scalpers prefer standard candles for immediate price data. Still, Heiken Ashi can be used effectively if you remain disciplined and manage tight stops.
Which Currency Pairs Work Best?
Heiken Ashi can be applied to all liquid currency pairs. Pairs that trend well (e.g., GBP/JPY, EUR/JPY, or major pairs during strong market conditions) tend to offer more substantial moves for this method. However, the core strategy remains consistent across most Forex pairs as long as liquidity and volatility are sufficient.
How Does the Heiken Ashi Forex Strategy Differ from Normal Candlestick Strategies?
While normal candlestick-based strategies rely on real-time open and close prices to form patterns like pin bars, engulfing bars, and dojis, Heiken Ashi “averages out” the price to show smoother, more continuous trends. This helps filter out minor price fluctuations and short-term spikes, but it also introduces a slight lag. The main difference is that you trade with more confidence in the trend’s direction but may see signals slightly delayed compared to standard candlestick patterns.
Do I Still Need Other Indicators?
Not necessarily. A pure price-action trader can effectively use Heiken Ashi alone. However, many traders add a simple moving average or RSI as a complementary filter to reduce false signals. It all depends on your comfort level and how you interpret the market.
Putting It All Together: A Sample Trading Plan
Below is a concise sample trading plan you can adapt to your style:
Market to Trade: EUR/USD, GBP/USD, USD/JPY, or major crosses.
Timeframe: Primary analysis on 4-hour, confirm trend on daily, refine entries on 1-hour if desired.
Indicators: 20 EMA and 50 EMA (optional).
Entry Signals:
- Minimum of two consecutive Heiken Ashi candles in the same color confirming a trend.
- The 20 EMA is above the 50 EMA (for a bullish bias) or below the 50 EMA (for a bearish bias), if using moving averages.
- For breakouts, wait for a decisive bar that breaks recent support/resistance in line with Heiken Ashi direction.
Stop Loss:
- Below (for longs) or above (for shorts) the most recent swing point or Heiken Ashi wick, plus an ATR-based buffer.
- Risk per trade limited to 1-2% of account.
Exit & Profit Target:
- Color change on Heiken Ashi or a trailing stop that follows the candle wicks.
- Partial profit at 1:1 or 1:1.5 risk-to-reward, then let the remainder ride if the trend continues strongly.
Risk Management:
- No more than 2 or 3 open positions at once if they’re correlated pairs.
- Daily max loss limit to preserve capital.
This sample plan is straightforward, focusing on Heiken Ashi candles with optional confirmation tools. Adjust timeframe, indicators, or risk percentages based on your preferences.
Final Thoughts on Heiken Ashi for Consistent Profits
Heiken Ashi helps simplify trend identification by filtering out market noise, allowing traders to follow price movements with greater clarity and less stress. While not perfect, pairing Heiken Ashi with disciplined entries, solid risk management, and smart exits can improve consistency.
Key Takeaways
- Heiken Ashi reveals clearer trends with fewer false signals
- Wait for confirmation with consecutive candles and minimal wicks
- Use proper stop-loss techniques and manage risk wisely
- Let profits run with trailing stops or exit on candle color change
- Keep a trading journal to refine your strategy over time
With patience, structure, and ongoing refinement, the Heiken Ashi strategy can be a reliable tool for capturing smoother trends and consistent profits in the Forex market.