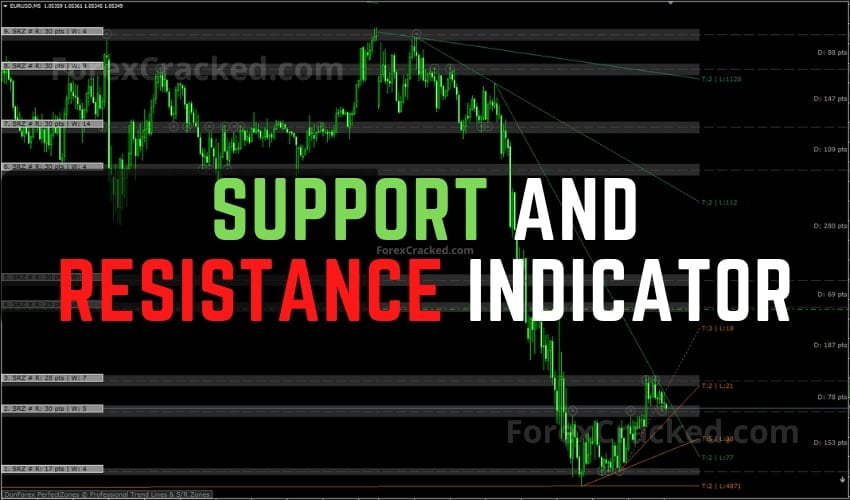
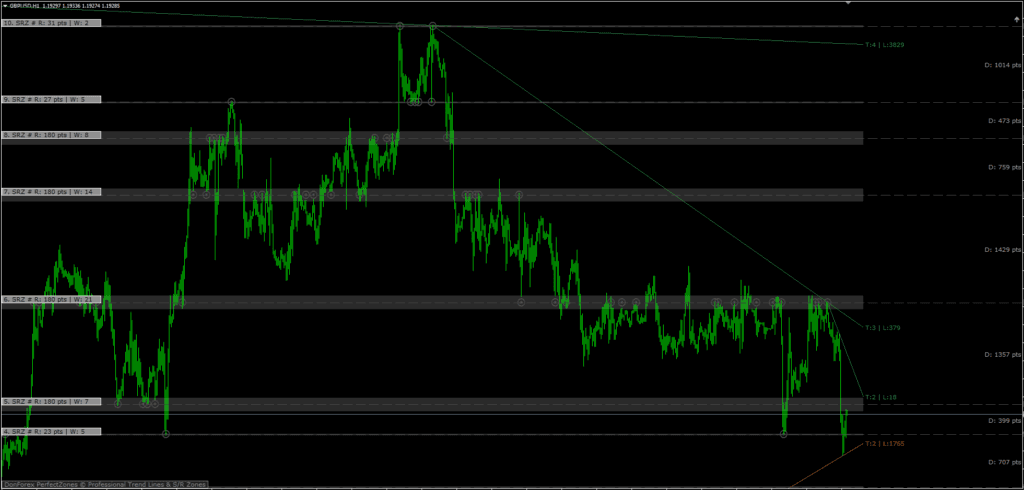
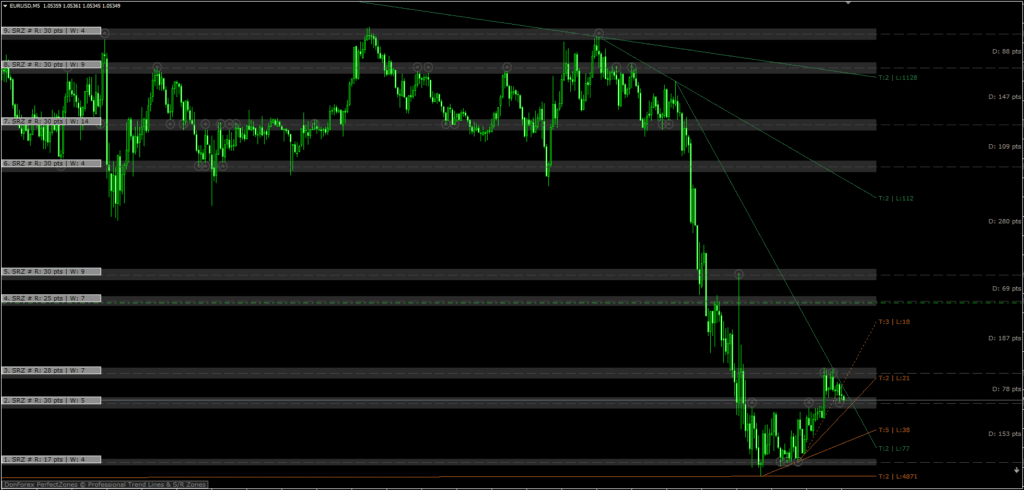
This Support and Resistance Indicator for MT4 is a highly advanced indicator that automatically draws the support and resistance zones and trend lines. Support and resistance are one of the most popular forex market Analyses used by thousands of traders worldwide.
- Works with an utterly unique calculation method
- Automatically draws Support and Resistance zones.
- Automatically draws trend lines.
- Displays the broken but still actual trend lines (dotted lines)
- Calculates and displays the following:
- The range of the Support and Resistance zones (in points)
- The ‘weight’ of the Support and Resistance zones (the higher value, the more significant zone)
- The distance between two adjacent zones (in points)
- The length of the trend lines (number of bars)
- The number of touches of the trend lines (the higher value, the more significant line)
- Indicates whether there are no more Support and Resistance zones in the given direction (with an arrow)
- Adjustable intervals for Support and Resistance zones and trend lines (number of bars)
- Selectable sensitivity (2 grades)
- Adjustable trend line style
- Automatically calculates the colors of Support and Resistance zones from the chart’s background color (very convenient feature)
- Color settings for trend lines
- Work with offline charts
This Support and Resistance Indicator is primarily manual. It does produce standalone signals, but I don’t recommend using them only. Any decisions to enter the market and to set protection stops or profitable exit stops will depend on the trader. Therefore, the trader must be familiar with the principles of risk and reward and use initial support and resistance areas to set entries and exits. So this Support and Resistance Indicator is perfect for that.
The support and Resistance Indicator indicator isn’t a standalone trading indicator, But it can be very useful for your trading as additional chart analysis, to find trade exit position(TP/SL), and more. While traders of all experience levels can use this system, it can be beneficial to practice trading on an MT4 demo account until you become consistent and confident enough to go live. You can open a real or demo trading account with most MT4 Forex brokers.
This Support and Resistance Indicator can be used on any Forex currency pair and other assets such as commodities, Cryptos, Binary Options, Stock markets, Indices, etc. You can also use it on any time frame that suits you best, from the 1-minutes to the 4-Hour charts.
Download a Collection of Indicators, Courses, and EA for FREE
Tips on How to use this Support and Resistance Indicator
Follow money management & Don’t enter to trade within the high-impact news period. Exit from your trades half & an hour from the high-impact forex news.
As always, to achieve good results, remember about proper money management. To be a profitable trader, you must master discipline, emotions, and psychology. It is crucial to know when and when not to trade. Avoid trading during unfavorable times and market conditions like low volume/volatility, beyond major sessions, exotic currency pairs, wider spread, etc.
- Search for charts that are “clear” (ex. nice top/bottom peaks, no choppy, short candle-wicks)
- These clear charts respect better the Support and Resistance levels, so they give more reliable signals.
- Wait until the price’s approaching a zone.
- At the Support and Resistance Indicator zone, look for the signs of a possible breakout or reversal.
- Two types of typical break-out formation:
- 1. Big and definite candle with strong momentum (faster)
- 2. Approaching the zone, the candles are getting smaller and smaller and then break through (slower)
- (Perhaps) the most reliable case is when the price breaks through the zone and then makes a retest (support becomes resistance and vice-versa)
- Reversal signs, for example, engulfing, pinball, etc … there is a lot
- An additional confirmatory factor is if there is a conjunction with any other level system (ex. Fibo, pivot, etc.)
- Of course, the trend lines are also Support and Resistance levels that have a slope
- Higher time frames give more significant Support and Resistance zones
- More Support and Resistance Indicators HERE


Please,,, where to put the file dfx_perfectzones .key ??? n to library ???
in the file folder when you click on mql4 there is a file folder
There is no instruction regarding where to put the “key” file – any suggestions to make this indicator work, please?
Please refer to the “How to install MT4 files.pdf” File. copy the “.key” file to the Files folder.
Sorry and tanks !!
Hay que probarlo, pinta bien!!!
We miss the MT5 version
Wanted it
[…] Support and Resistance Levels: This tool involves marking out price points where the market has historically shown a reaction. These levels are further numbered based on the frequency of the market’s response in the recent past. […]
please upload the mt5 version this is a really good indicator but its mt4
[…] potential price reversal locations on the forex price chart. These points often double as critical support and resistance levels, integral to various technical analyses and trading […]
[…] in spotting and leveraging potential breakout opportunities. It achieves this by marking important support and resistance levels crucial for understanding market trends and […]
Please can we get an update for this indicator for 1420 metatrader