Being a successful Forex trader takes work. Becoming an expert in this field takes years of practice and learning. However, even if you’re a beginner, there are some Forex indicators that you should know about.
In this article, we’ll discuss the ten most essential Forex indicators and how you can use them to improve your trading skills. So, read this article whether you’re just starting or trading for years!
What Are Forex Indicators?
Forex indicators are tools traders use to measure the performance of a currency pair. We can use these indicators to identify trends and potential trading opportunities.
There are many Forex indicators, and each trader will have a different preference. However, some indicators are more popular than others and are worth learning about. In this article, we will discuss 10 Forex indicators that every trader should.
1. RSI – Relative Strength Index
RSI (Relative Strength Index) is one of the most popular oscillator indicators. It was developed by Welles Wilder and plotted the ratio of average up-periods to average down-periods over a certain period.
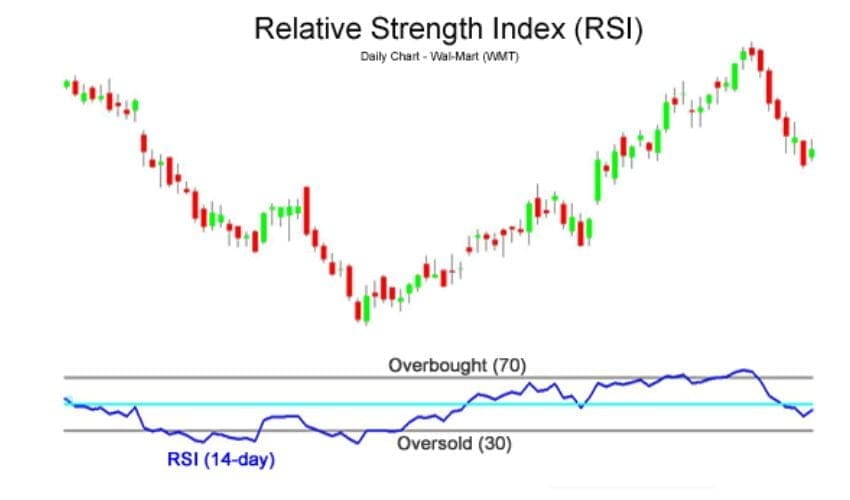
RSI is used to measure overbought and oversold conditions in the market. Traders use it to identify when security is nearing overbought or oversold levels and to make trading decisions accordingly.
2. Bollinger Bands
Bollinger Bands are a technical indicator used to measure market volatility. John Bollinger created them in the early 1980s.
Bollinger Bands are composed of three lines: an upper line, a lower line, and an intermediate line. The bands widen and narrow as volatility increases and decreases.
When the market is quiet, the bands will be close together. Then, as the market becomes more volatile, the bands will move further apart.
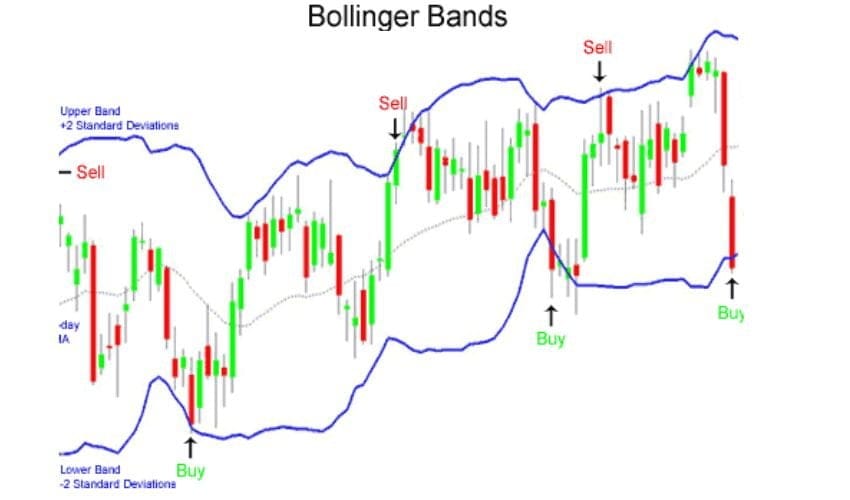
Bollinger Bands can identify overbought and oversold conditions. You can also use them to measure price volatility.
- Read More Using EMA in a Forex Strategy
3. Parabolic SAR
The Parabolic SAR is technical indicator traders use to identify potential trend reversals and entries. In its most basic form, the Parabolic SAR is displayed as a series of dots next to prices on the chart. The dots may be either above or below the price, depending on which way the trend is running.
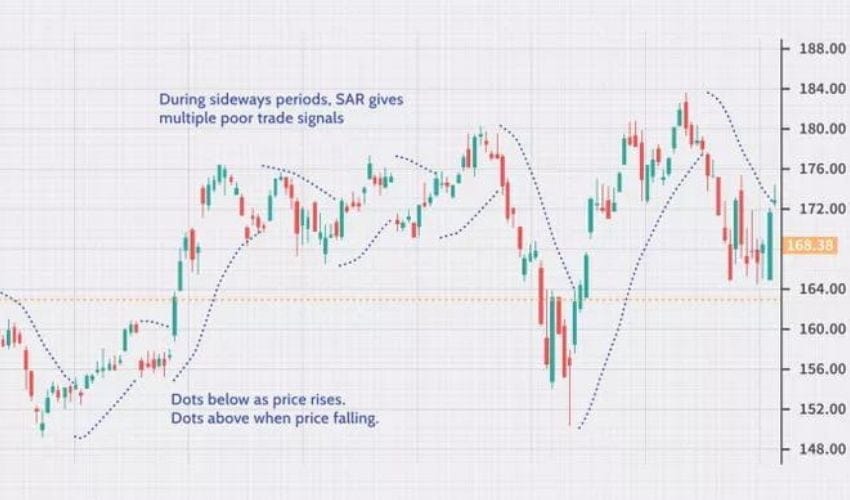
The Parabolic SAR is a great way to monitor the momentum of a trend. When the dots are above prices, it indicates a bearish trend, and when they’re below prices, it indicates an upward trend. It also creates buy and sell signals for traders. For example, if the dots move from above to below price, it’s a signal that you should enter long trades; if they move from below to above price, it’s a signal that you should enter short trades.
The key with the Parabolic SAR is to use it with other mt4 indicators, such as support levels or moving averages. This will give you more accurate signals and allow you to find more profitable trading opportunities.
4. Moving Average Convergence/Divergence (MACD)
The fifth indicator on our list is the Moving Average Convergence/Divergence (MACD). This indicator is used to measure the momentum of a currency pair. It takes the past price movement and creates a line that shows whether the pair’s momentum is increasing or decreasing.
The MACD looks at two moving averages and takes the difference between them. If the lines are close together, the pair has little momentum. If they are further apart, there is more momentum in the pair. The MACD also has a histogram which gives you an idea of how strong that momentum is and whether or not it’s increasing or decreasing.
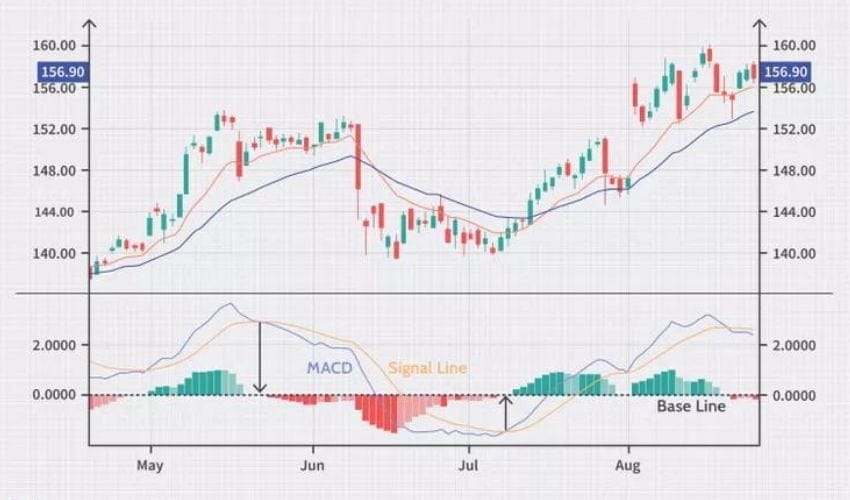
By using the MACD, traders can get an idea of which way a currency pair might be headed and make better trading decisions.
5. Stochastic Oscillator
The Stochastic Oscillator is a momentum indicator that compares a Forex pair’s closing price over time to the high and low of that same period. This oscillator focuses on the severity of recent price changes, making it especially useful for spotting overbought or oversold signals. It also allows you to identify potential price reversals by looking for divergence between the indicator and price.
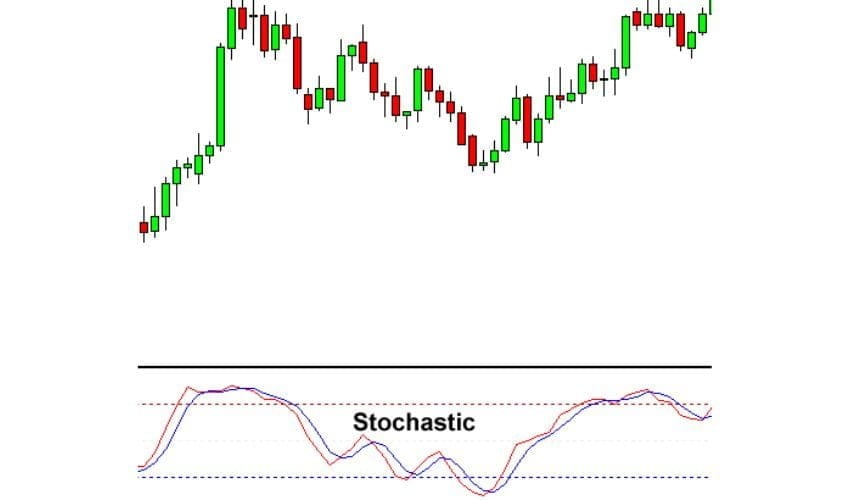
The Stochastic Oscillator has two main components: %K, the fast line, and %D, the slow line. %K measures the current price relative to a range, and %D takes an average of %K over time. Together they can help you identify when prices are near their highs or lows and also help you spot potential buy and sell signals.
6. Average Directional Index (ADX)
The Average Directional Index (ADX) is a valuable tool for traders to gauge the strength of a trend in the market. This is done in two ways: first, by measuring how strong the trend is, and second, by determining if it’s rising or falling. The ADX indicator does this by computing a trend’s overall force or strength and looking at how the price moves relative to a certain period.
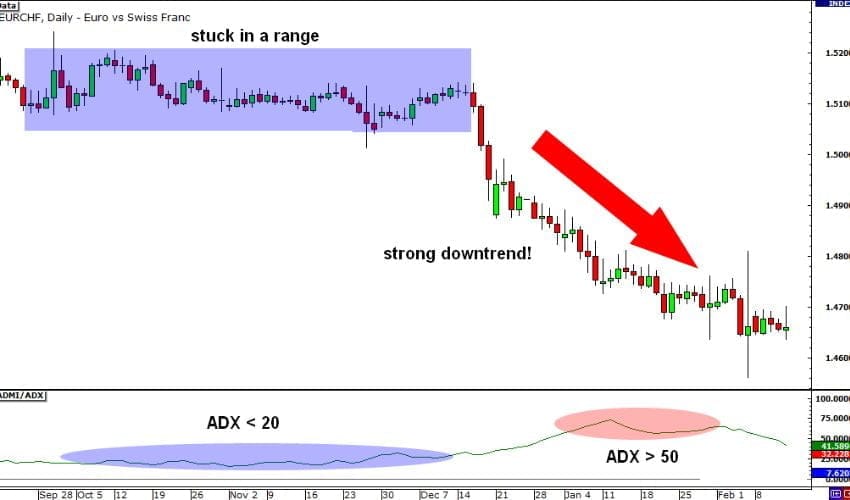
The ADX indicator gives you an intuitive way of visualizing trends in an orderly fashion, which can help you better plan your trades. It also makes it easier to detect emerging trends and measure the strength of existing ones. To use it successfully, look for readings above 25 (which indicate a strong trend) and use other indicators like moving averages and oscillators to confirm signals and decide when to enter or exit a position.
7. Ichimoku Kinko Hyo
Ichimoku Kinko Hyo, also known as the Ichimoku Cloud, is one of the more popular indicators used by forex traders. This indicator consists of a series of lines that form a cloud-like structure that helps identify support and resistance levels.
The Ichimoku Cloud is composed of five lines, each with its unique purpose. These include Conversion Line (Tenkan Sen), Base Line (Kijun Sen), Leading Span 1 (Senkou Span A), Leading Span 2 (Senkou Span B), and Lagging Span (Chikou Span). Together, these five lines combine to give traders a clear picture of the overall trend or direction of the Forex market, making it easier to identify potential entry and exit points.
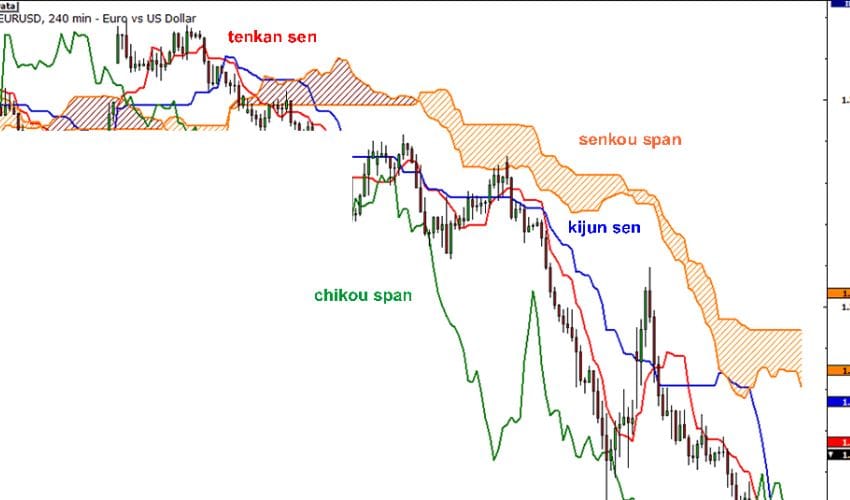
What’s remarkable about this indicator is that it also displays visual cues that tell traders when to buy or sell. For example, a bullish crossover between the Tenkan Sen and Kijun Sen lines usually signals an uptrend. In contrast, a bearish crossover between those two lines usually signals the start of a downtrend. With this information, traders can make decisions about their trades more confidently.
8. Fibonacci Retracement
Traders use Fibonacci Retracements to identify potential support and resistance levels in a market. It is based on the Fibonacci sequence of numbers, which can be used to identify patterns in various markets.
The Fibonacci Retracement tool is easily accessible on most trading platforms and can be drawn on a chart without difficulties. Draw the tool between two points representing the high and low of a price movement, and it will automatically calculate the retracement levels for you at 23.6%, 38.2%, and 61.8%.
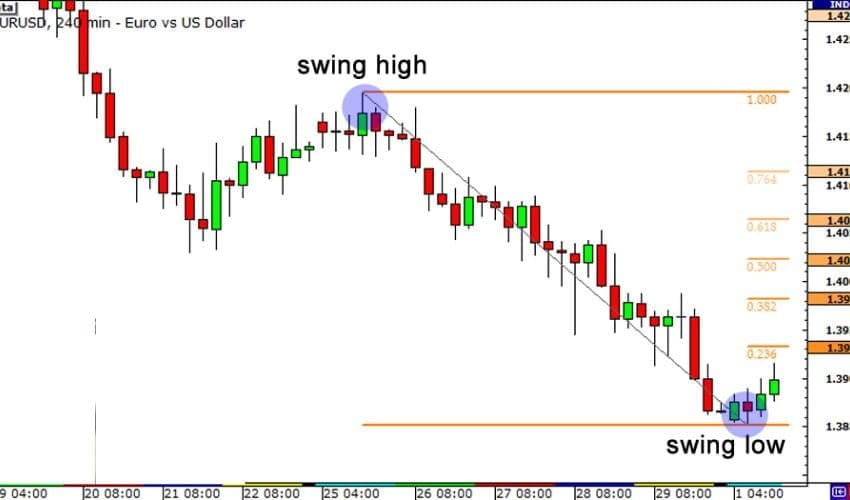
These retracement levels are seen as potential support or resistance levels for the market, and traders may use them as entry or exit points when making trades. Of course, these numbers aren’t exact, but they represent a general idea of where prices may reverse course.
9. Money Flow Index (MFI)
The 10th and final indicator you should know about is the Money Flow Index (MFI). This indicator measures the money flow from buyers to sellers in an asset over a period. The higher the MFI, the stronger the buying pressure, and the lower the MFI, the stronger the selling pressure.
The MFI helps you determine whether there’s a potential for a trend change by looking at large changes in price about large changes in volume. For example, if there’s an increase in price but a decrease in volume, this could signify a market reversal. On the other hand, if there’s an increase in both price and volume, this could be an indication of continued buying interest.
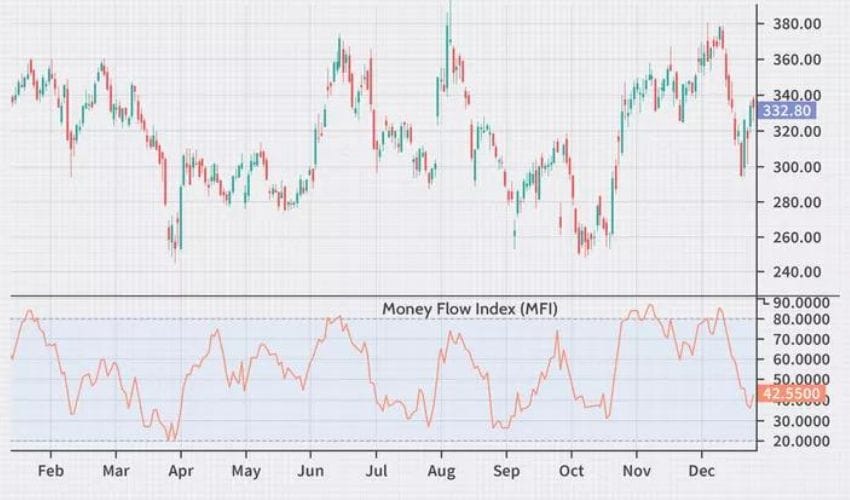
It’s important to note that the MFI is lagging, so it can’t predict future price direction but instead confirms current market trends. It can also help traders identify possible overbought/oversold conditions that could lead to profitable trading opportunities.
10. Average True Range (ATR)
The Average True Range (ATR) is an important indicator for measuring volatility. It shows the average price movement over a given period, which helps you understand how much potential there is for a security’s price to move. ATR ranges from 0 to infinity, and higher values indicate higher volatility.
The ATR is calculated based on the true range, which includes the current high or low and the previous close. The average of this true range is then calculated by taking the total of all the values divided by the number of days in the measured period. This gives you an indication of whether recent movements have been greater or smaller than in the past.
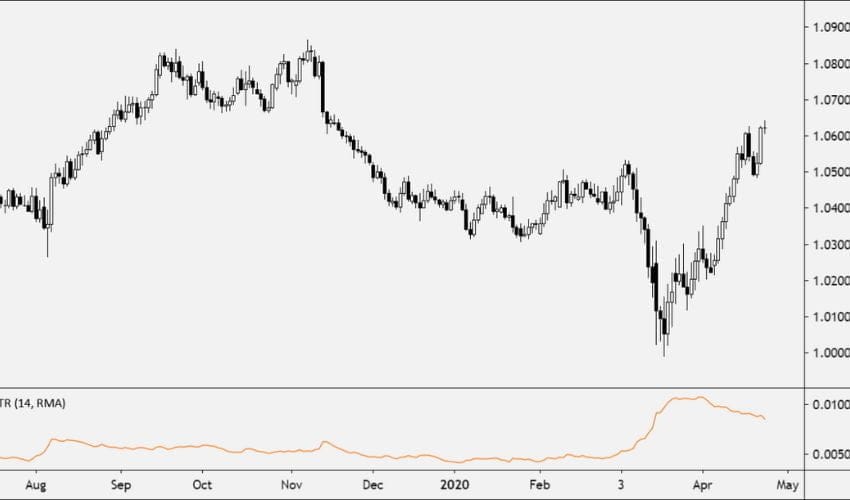
The benefit of using this indicator is that it can help traders identify when markets are signs of trending up or down, as well as when they are consolidating or in search of a new direction. Understanding these clues can then decide how to trade going forward and how much risk should be taken in any given position.
Conclusion
Various Forex indicators are available, and each trader should become familiar with the most important ones. These Forex indicators can help you spot trends and make profitable trades.
We have 200+ Premium Indicators, Trading Systems, and strategies FREE to Download HERE.


Thanks Admin.