Getting Started
The purpose of this HEIKIN ASHI Strategy is for longer time frame trading. This Strategy is intended for the Daily time frame, but I have successfully traded it on as low as the 1hr time frame.
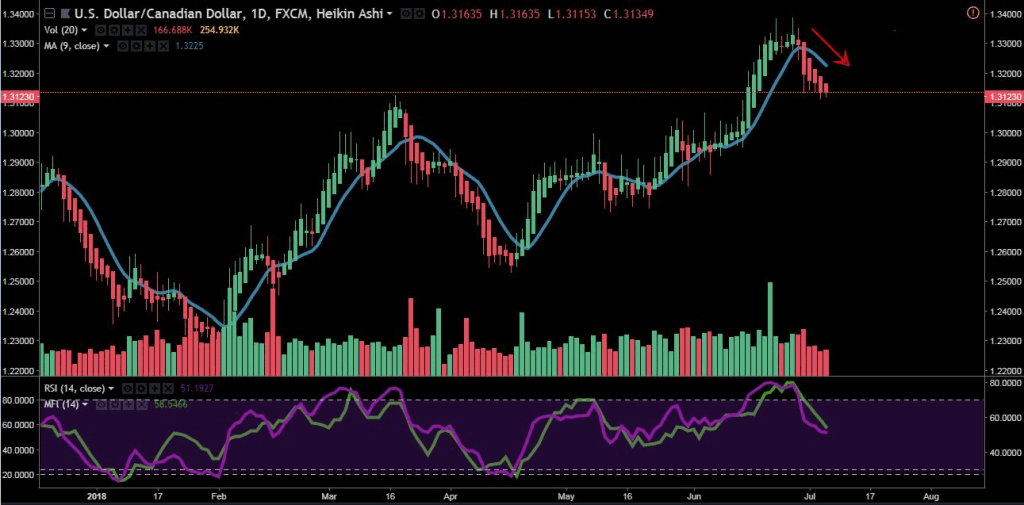
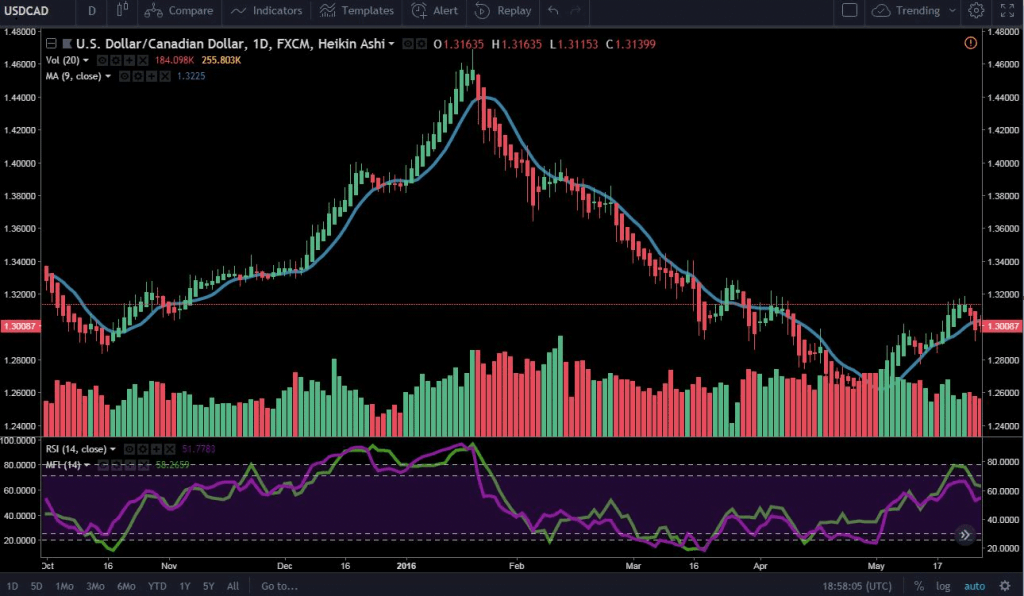
This Strategy consists of using Heikin Ashi candlesticks in conjunction with four indicators. Those four indicators include:
1.Volumes (colored)
2.9 Simple Moving Average (closed)
3.14 Period RSI (closed) (70 / 30 levels)
4.14 Period Money Flow Index (80 / 20 levels)
You can refer to the picture at the top for visual reference. You can also place the MFI on top of the RSI, as shown above, but it is an entirely personal preference.
How to Trade HEIKIN ASHI
The Strategy itself is quite simple. There are five rules you must follow to trade this Strategy successfully.
- There MUST be Clear evidence of a reversal
- The RSI MUST be above the 70 level for a bearish trade or below the 30 levels for a bullish trade
- The MFI MUST be above the 80 level for a bearish trade or below the 20 level for a bullish trade
- The candlestick you are trading MUST match in the color of the matching volume bar below
- (MOST IMPORTANT) the candlestick you are trading MUST NOT be touching the 9 EMA at all.
(^ This means you will usually never be taking a trade-off of the 1st 1-2 candlesticks of a new trend)
Read More : Which Forex News Releases are the Safest to Trade?

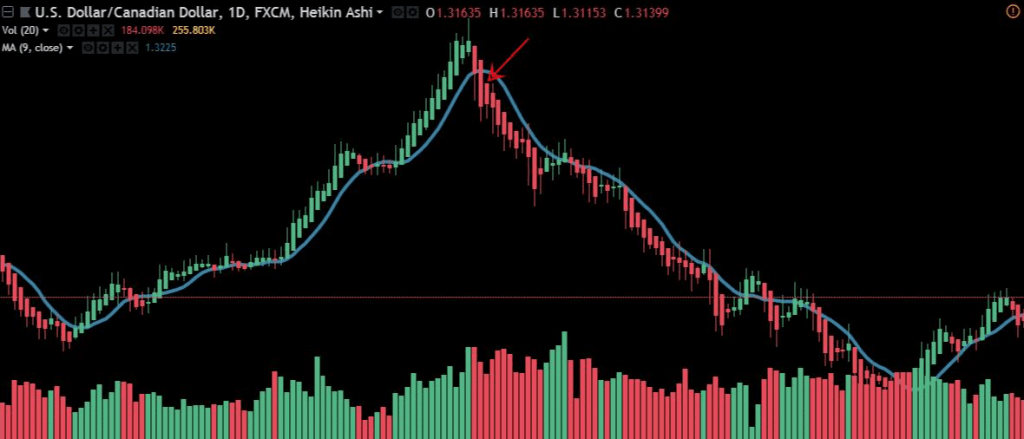
This picture shows a perfect example of a bearish trade using this Strategy. There is clear evidence of a reversal. Price is above the 70/80 levels on the RSI &
MFI. The bearish candlestick matches the bearish volume bar below, and the candlestick is not touching the 9 EMA.
We would of took a sell off of this candlestick.

As you can see this resulted in a very profitable trade!
Read More : Bollinger Bands Trading Strategy
Download a Collection of Indicators, Courses, and EA for FREE


No link for download