

Our trading decisions will be based on actions that price can perform in relation
to trendlines. There are three scenarios that price can perform:
I will now explain each scenario and demonstrate in charts.
- Bounce
- Breakout
- Pullback
Bounces
Bounce occurs when price touches a Support or Resistance level and bounces in
the opposite direction. These are strong signals that we will incorporate in our
trading repeatedly.
Examples for bounces were shown in the last pages:
Price bounced several times on these support and resistance levels. The more
bounces – the stronger these levels are. We will only trade on levels that have at
least 2 bounces. Levels with 1 bounce only are not strong enough to serve as
trading signals.
Breakouts
Breakouts occur when price breaks a support or resistance level. They are usually
accompanied with high volume and big movement of price. We will not trade
these signals.
Examples for breakouts:
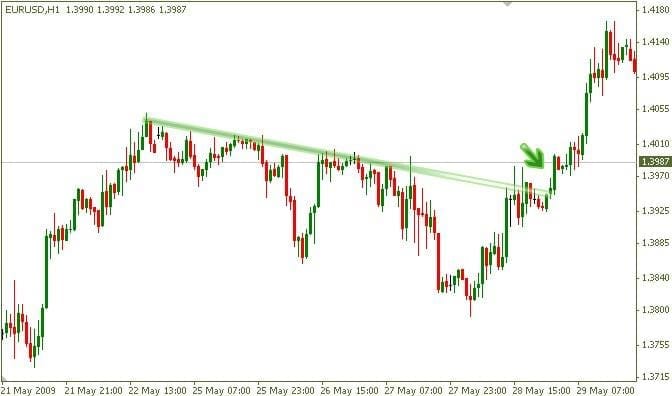
Fig. 1: Breakout of a dynamic Resistance level
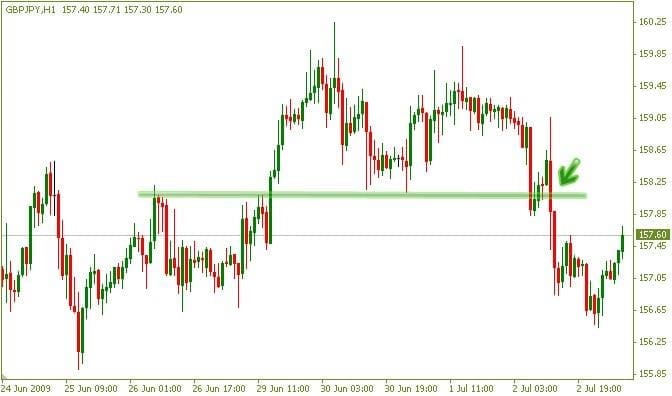
Fig. 2: Breakout of horizontal Support level
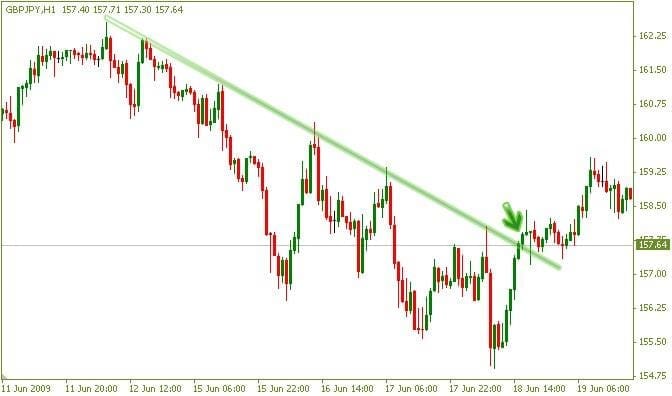
Fig. 3: Breakout of Resistance trendline
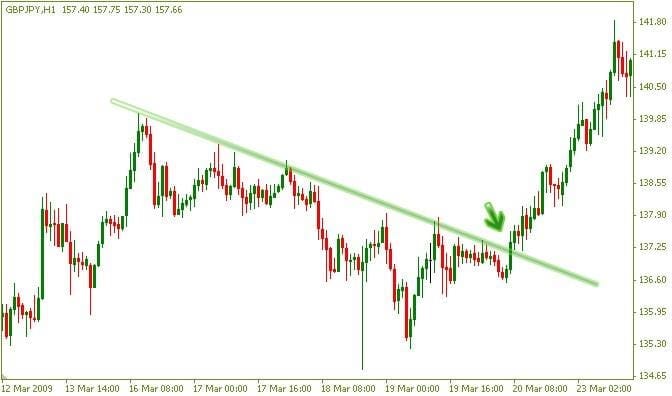
Fig. 4: Powerful breakout of Resistance trendline
Breakout signals attract many inexperienced traders that mistakenly think that
the Breakout is a profitable signal.
Breakout is usually an unreliable signal whose continuation is doubtful. Price may
appear to break a certain level but will close below it – this is known as ‘Fakeout’.
This happens a lot, especially when trading in small time-frames (Day Trading).
When trading stocks, you can trade breakouts, though you will suffer from the
same drawback these signals have.
This drawback is the inability of placing a stop loss at a logical location. When
entering on a breakout, we don’t know where to place the stop loss, as the price can retrace, touch our stop-loss order (closing our trade) and continue in the original direction. In order to place a stop loss, it must be far from price – thus decreasing our profitability.
We will now describe the main signal we will trade, one with highest power and
reliability.
Pullbacks
Pullbacks occur when price re-touches a Support\Resistance previously broken.
This is one of the highest quality signals and we will trade them in many chart
patterns.
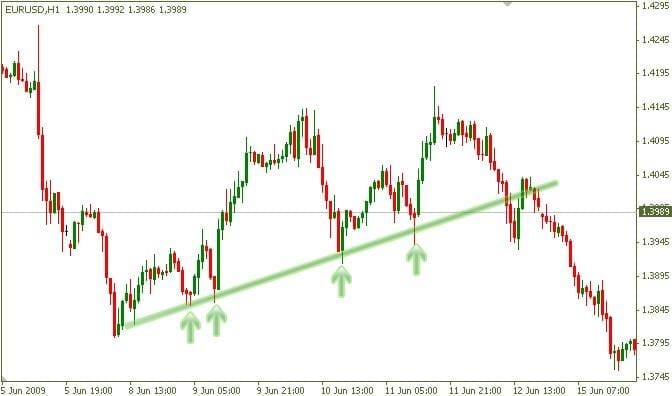
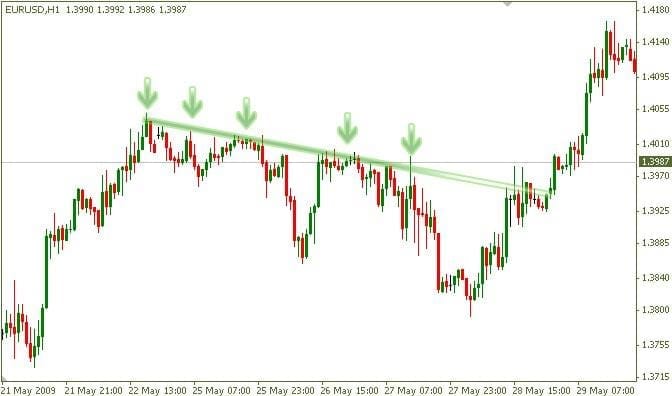
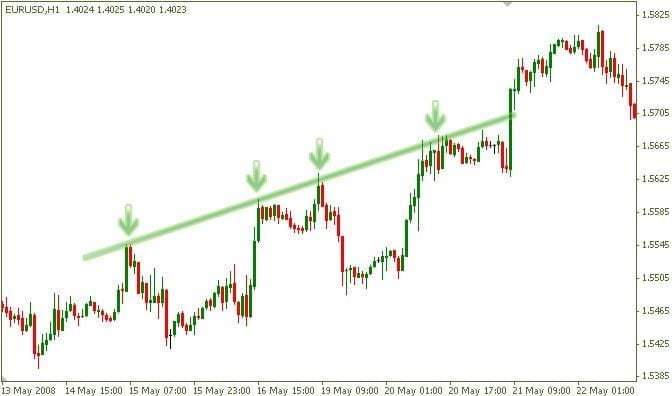
Examples for pullbacks:
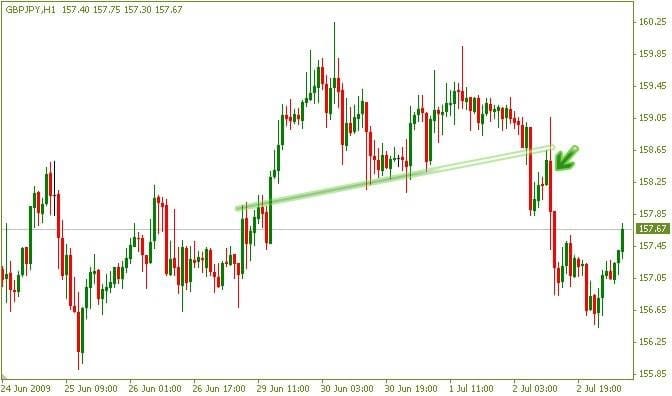
Fig. 5: Price broke Support trendline, then re-touched it – and continued down
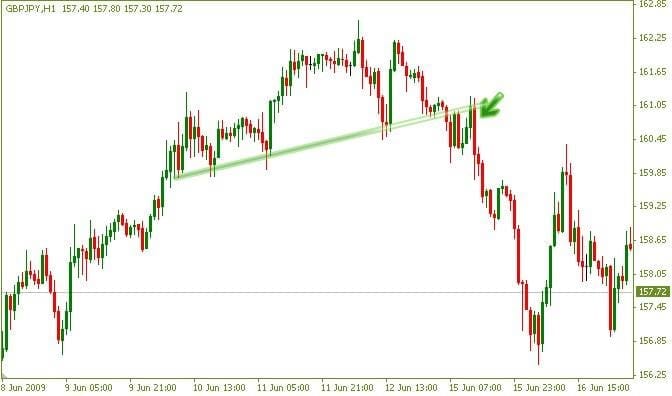
Fig. 6: Pullback after the breakout of Support. Note the strength of the movement and the precise reversal signal.
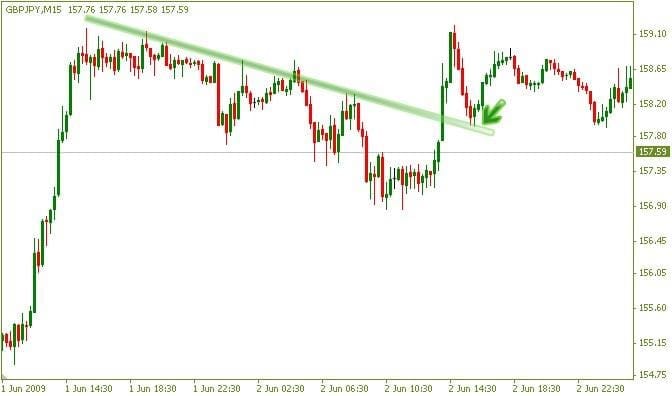
Fig. 7: Precise pullback after breakout of Resistance trendline
Note that pullbacks should occur at few bars after the breakout. If the pullback
doesn’t occur quickly we will discard it as a potential trade. This is because
psychological levels tend to lose their reliability as they became older. Always aim to trade the newest trend lines and discard the old ones.
The pullback is an extremely strong trading signal, which results in frequent
winning trades. This is empowered by the fact that when trading pullbacks, we
are actually trading with the prevailing trend! The breakout that came before the
pullback confirmed the strength of the trend – and enhances the quality of our
signal.
Read More : A low-risk approach for better profits; one-minute forex scalping strategy
When Trade is Confirmed
We will now describe a very important subject – the exact timing of trades. Until this point, we have discussed the scenarios which we will trade (bounces and pullbacks). Now we will describe when exactly each scenario is confirmed – and trade should be entered. Do not worry if the rules are not completely understood – numerous examples of these techniques will be given in the following chapters.
Bounce
Bounce is confirmed after:
- Price created one candle in the opposite direction of the previous candle.
- A second candle passed the low of the previous (for short trades) or high(for long trades).
Examples:
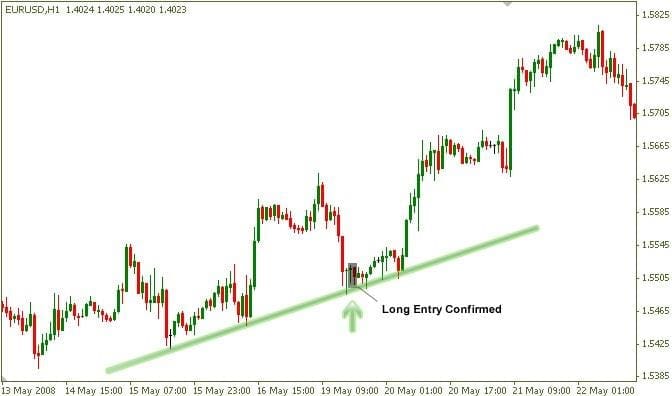
Fig. 8: Long entry confirmed after the second Bullish candle closed
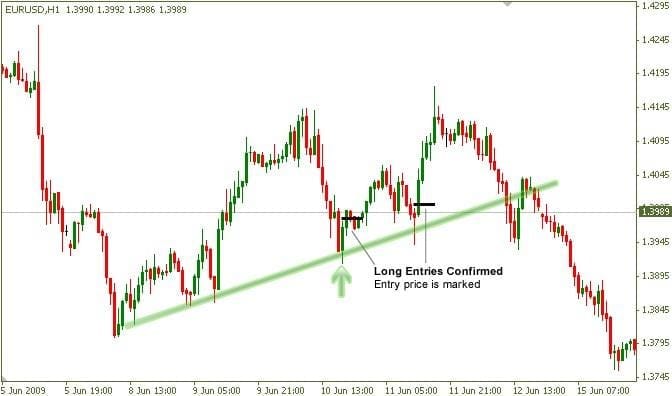
Fig. 9: Entry prices are marked on chart
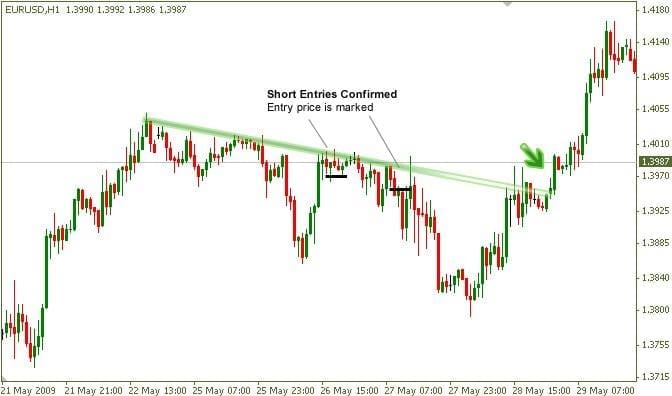
Fig. 10: Short entries are marked on chart
Pullback
The pullback is confirmed the same way as a bounce.
At all future chart pattern examples, the exact entry point will be marked.
I also recommend that you take part in the Forum section at https://justforforex.com/, there are many forexes experienced
traders who will be able to answer all your questions. This will shorten your learning curve as you learn from the experts.
Download a Collection of Indicators, Courses, and EA for FREE