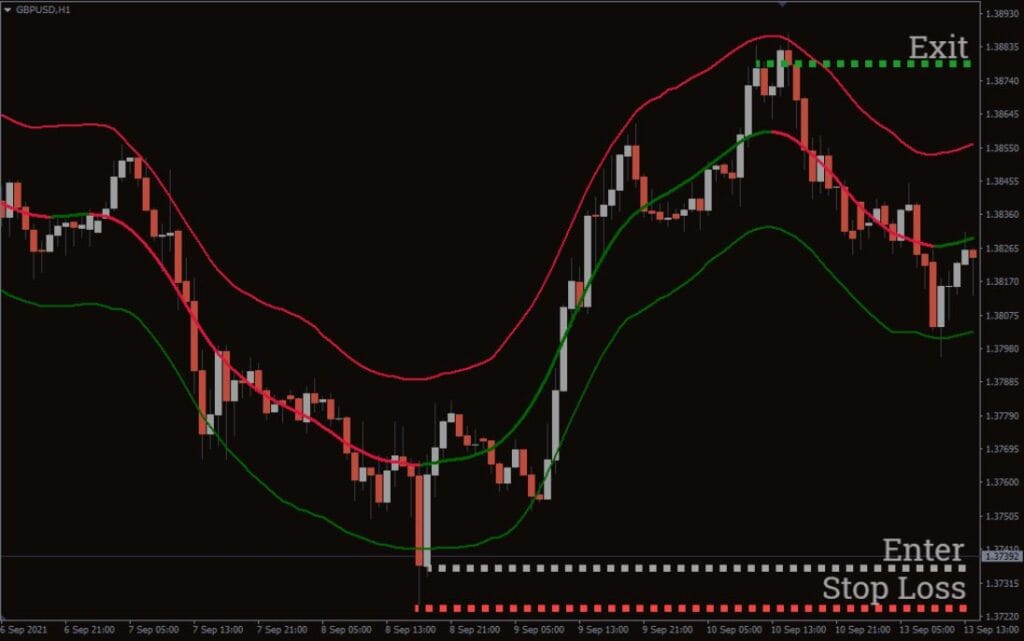
The TMA Centered Bands Indicator for MT4 draws bands on the chart and tells you the overall price trend. For example, it plots three bands of red, green, and red-green color.
The top bands comprise red color, the lower band consists of red color, while the middle band depicts the red-green color.
The bands are made up of moving averages, and each one of them has a MA period. TMA comes from triangular moving averages, as the indicator draws triangular bands.
The price will fluctuate between these bands whenever a trend changes its course, thus producing entry and exit points.
How to trade the TMA Centered Bands Indicator?
The TMA Centered Bands Indicator utilizes the moving average power to plot bands on the chart.
Each band has different functionality. For example, when the price goes above the upper band, there is a chance that it’ll reverse. Similarly, when the price goes below the lower band, there’s a potential for a reversal. The middle band gauges the trend and turns green or red depending on the direction of the trend.
You can take short positions when the price goes above the upper band. On the other hand, you can take long positions when the price slides below the lower band.
The middle band is a mediator between the upper and lower bands. Whenever a trend changes its path, it turns red or green. Green is a signal of an uptrend, while red illustrates a downtrend.
TMA-centered bands buy strategy
- The price should go below the lower band.
- Please wait for the price trend to continue its route.
- Enter the long trade at the lower band.
- Place a stop-loss near the low of an entry point.
- Exit the trade when the middle band turns red.

TMA centered bands sell strategy
- The price should go above the upper band.
- Please wait for the price trend to continue its route.
- Enter the short trade at the upper band.
- Place a stop-loss near the high of an entry point.
- Exit the trade when the middle band turns green.
Conclusion
The TMA Centered Bands Indicator works on every timeframe so you can use it on all trading strategies. In addition, the indicator presents you with an overall picture of the direction of the trend.
As there is no holy-grail system, the possibility of loss does exist with the indicator.
You can also combine the TMA Centered Bands Indicator with confirmation indicators like moving averages or the RSI to further confirm the trend.
TMA Centered Bands MT4 Forex Indicator Free Download
Read More Candlestick EA – Consistently Profitable EA FREE Download


Repainting crap, the middle line repaints backwards, in the beginning showing for example red, the if the tred changes and goes up, it changes about 10 candles back to the green color, and its already too late to enter. Deleting this, not recommended.
This whole website should be deleted.
Repainting signal shows when to exit trade. It acts as entry and as exit stop.
Exaclty, repainting signal shows when its too late to take the trade or too late to exit, this indicator can empty your account.
combine two tma bands indicators or tma with Bollinger. Use entry points following trend entering same direction where trend is going to when price breaks top band on bullish and use the same band as stop loss which will act as trailing stop.
There are additional setups changing TMA bands settings. Also, you can use TMA bands to see and use when is flat market and change trading style by that.
TMA indicator was never to be used alone, but only as an additional indicator. And that so hated by most traders “repainting”, on this indicator makes sense to use.
Just use breaking TMA bands towards trend on the trending market – That’s what most people miss on this indicator.
Yep! This is it 100%. TMA band is for trend following (with other confluences, obviously). It’s NOT for counter-trend or overbought/oversold/ divergence strategy