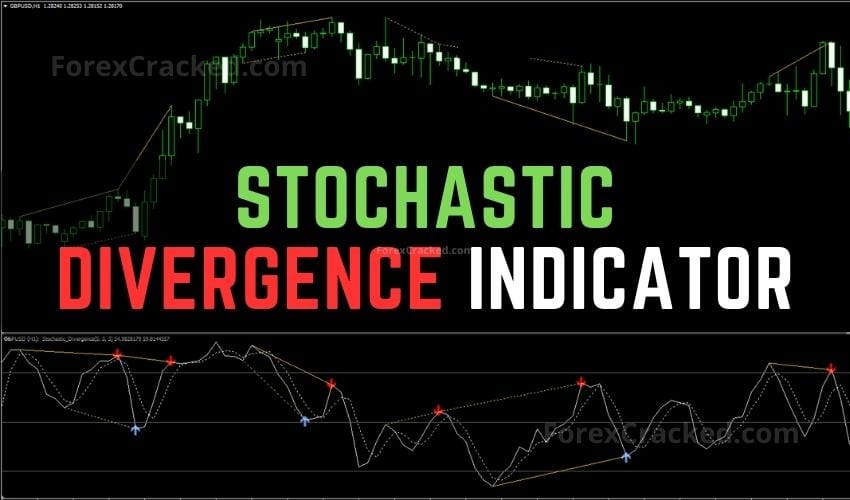
The stochastic Divergence Indicator is an MT4 indicator designed to automatically draw Stochastic Divergences in MT4. Its potent capabilities allow it to effectively identify potential reversals in market trends, an essential aspect of successful trading.
What sets this indicator apart is its ability to automatically detect divergences, a task often challenging and time-consuming when done manually. By drawing trendlines on the price chart and the indicator window, the SDI allows spotting counter movements between the price and the Stochastics, allowing traders to discern possible trend reversals more effectively.
Enhancing this intuitive system, the SDI provides visual arrow signals to underline bullish or bearish divergences. This feature simplifies predicting price reversals, making the tool particularly helpful for experienced traders and beginners. Another striking feature of the SDI is its adeptness in searching for and identifying divergences within a given timeframe.
For an even more comprehensive understanding of market trends, the SDI includes the option to display arrows on the chart that correspond to identified divergences. This intuitive visual aid makes tracking and analyzing market patterns more accessible and less complicated.
The SDI is designed to allow for exhaustive market analysis, enabling traders to gauge the effectiveness of divergences in their chosen market. Its ability to adjust according to the selected timeframe allows traders to customize their divergence searches based on their specific strategies. This adaptability makes the SDI a versatile tool that caters to various trading styles, from Scalping to Day trading.
You can set it to send you a signal alert via platform pop-ups and Email. This is helpful as it means you do not need to stare at the charts all day, waiting for signals to appear, and you can monitor multiple charts simultaneously.
This Stochastic Indicator can be used on any Forex currency pair and other assets such as commodities, Cryptos, Binary Options, Stock markets, Indices, etc. You can also use it on any time frame that suits you best, from the 1-minutes to the Month charts.
This Divergence Indicator isn’t a standalone trading indicator System. Still, it can be very useful for your trading as additional chart analysis, to find trade exit position(TP/SL), and more. While traders of all experience levels can use this system, practicing trading on an MT4 demo account can be beneficial until you become consistent and confident enough to go live. You can open a real or demo trading account with most Forex brokers.
What is Stochastic Divergence
Stochastic Divergence is a concept used in technical analysis that refers to the discrepancy between the Stochastic Oscillator indicator and the price action of an asset. This divergence is typically used to identify potential reversals in the prevailing trend and can be a powerful tool when used correctly.
The Stochastic Oscillator is a momentum indicator that shows the position of a security’s closing price relative to its price range over a specified period. The indicator oscillates between 0 and 100, and readings below 20 are oversold, while readings above 80 are overbought.
In the context of Stochastic Divergence, traders and analysts look for instances where the price of an asset and the Stochastic Oscillator are not moving in the same direction. There are two primary types of Stochastic Divergence:
- Regular (or Classic) Divergence: This occurs when the price of an asset is making higher highs, but the Stochastic Oscillator is making lower highs (bearish divergence), or when the price is making lower lows, but the Stochastic Oscillator is making higher lows (bullish divergence). Regular divergence is typically used as a signal of a potential trend reversal.
- Hidden Divergence: This type of divergence occurs when the price of an asset is making lower highs, but the Stochastic Oscillator is making higher highs (bearish hidden divergence), or when the price is making higher lows, but the Stochastic Oscillator is making lower lows (bullish hidden divergence). Hidden divergence is typically used as a signal of trend continuation.
Although Stochastic Divergence can be a powerful tool for predicting potential reversals or trend continuation, it’s not foolproof. It should be used with other technical analysis tools and indicators to confirm signals and reduce the risk of false positives.
How is it used in Forex Trading
Like many other technical indicators, Stochastic Divergence is widely used in forex trading. Traders employ this tool to detect potential trend reversals or trend continuations, which can help them time their trades more effectively.
Here’s how you could use it in forex trading:
- Identifying Regular Divergence: Regular (or classical) stochastic divergence is a potential sign of a trend reversal. When the price increases but the Stochastic Oscillator makes a lower high, it signals a possible bearish trend reversal (bearish divergence). Conversely, when the price records a lower low but the Stochastic Oscillator forms a higher low, it could indicate a possible bullish reversal (bullish divergence).
- Identifying Hidden Divergence: Hidden stochastic divergence can signal the continuation of an existing trend. A lower price and a higher high in the Stochastic Oscillator signal a hidden bearish divergence (suggesting the continuation of a downtrend). Similarly, a higher price and a lower low in the Stochastic Oscillator indicate a hidden bullish divergence (suggesting the continuation of an uptrend).
- Timing Entries and Exits: Traders use stochastic divergence signals to time their trades. For instance, upon recognizing a bearish divergence, a trader might decide to enter a short position, expecting the price to fall. Similarly, a bullish divergence could be an opportune moment to enter a long position, anticipating the price to rise.
- Confirmation of Other Signals: Stochastic divergence is often used in conjunction with other technical analysis tools for confirmation. For example, if a bearish divergence is detected during an uptrend, a trader might wait for a bearish candlestick pattern or a resistance level break to confirm the trend reversal before entering a trade.
- Risk Management: Stochastic divergence can also be used to manage risk by helping traders set stop-loss orders. A trader might place a stop loss just above the recent high in case of a bearish divergence or just below the recent low in case of a bullish divergence.
While stochastic divergence is a powerful tool, it should be noted that it is not infallible. There may be false signals, so it is essential to consider other market factors and employ risk management strategies. Using this tool as part of a comprehensive, well-rounded trading strategy can significantly enhance decision-making in forex trading.
Download a Collection of Indicators, Courses, and EA for FREE
Input Parameters
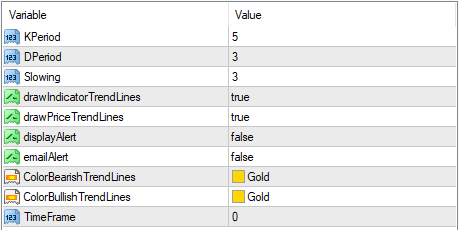
- KPeriod – The period of the %K line. This is the main line of the Stochastic oscillator and is indicated by a solid line.
- DPeriod – The period of the %D line. This is the moving average of the %K line and is indicated by a dotted line.
- Slowing – This is the smoothing parameter. Increasing this parameter reduces the indicator’s sensitivity and is used mainly to filter out market noise.
- drawIndicatorTrendLines – enable/disable the display of lines on the price chart
- drawPriceTrendLines – enable/disable the display of lines on the indicator window
- displayAlert – enable/disable notifications in the Alert window
- emalAlert – enable/disable email notifications
- ColorBearishTrendLines – set colors for bearish divergence lines
- ColorBullishTrendLines – set colors for bullish divergence lines
- TimeFrame – to search for divergences on the current timeframe, leave 0. For example, to search for divergences on M15, specify 15.
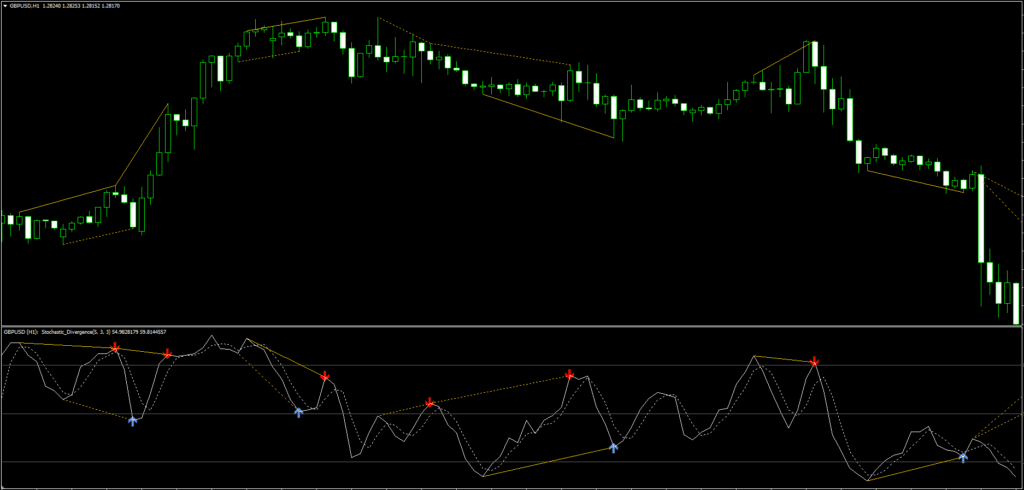
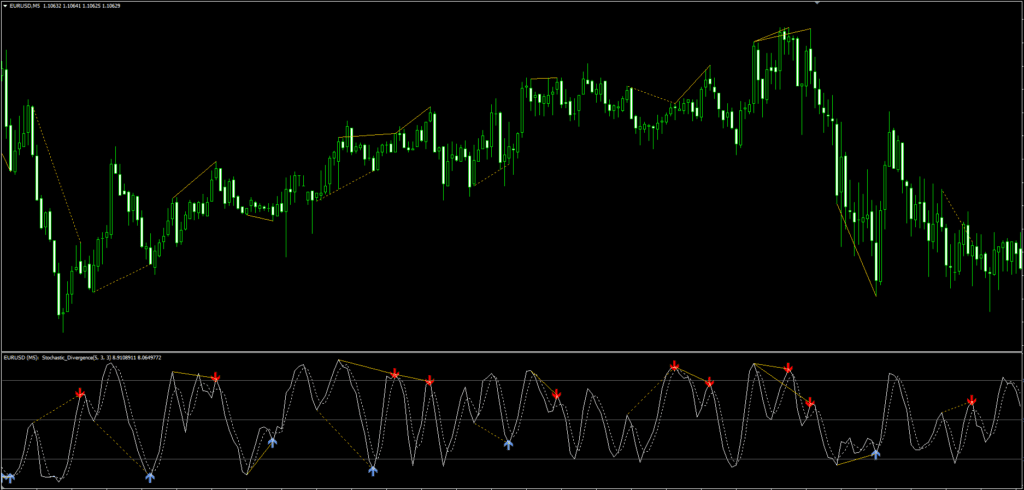
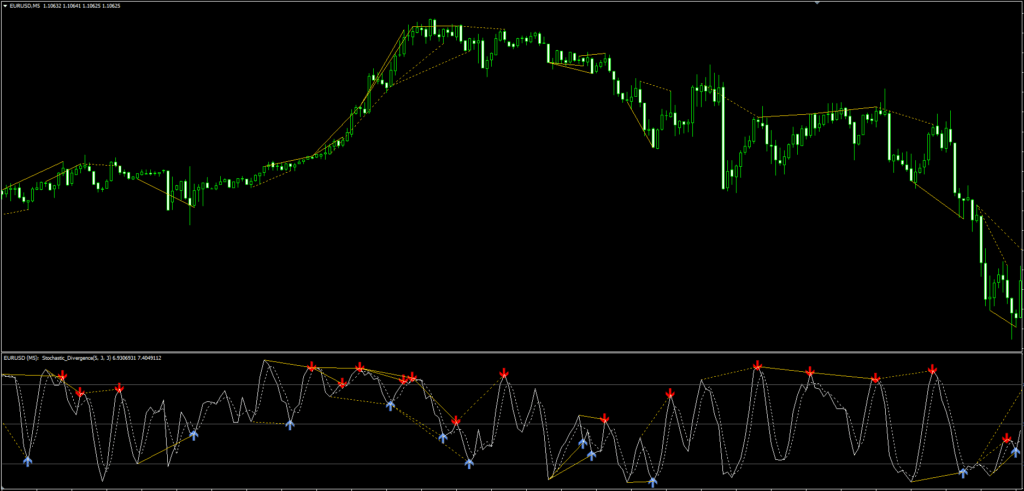
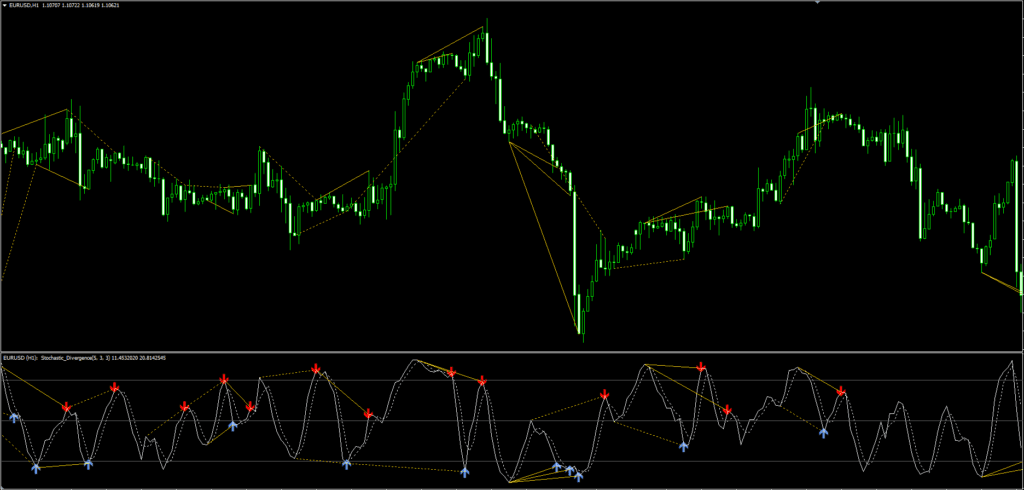
A divergence, in trading terminology, arises when there is a disconnect between the price movement and the Stochastics. For instance, if the price creates a lower low and the Stochastics illustrate a higher low, this discrepancy is referred to as a bullish divergence. In the Stochastic Divergence Indicator window, this bullish divergence is signaled by a blue arrow pointing upwards.
A bearish divergence, on the other hand, occurs when the price achieves a higher high while the Stochastics plots a lower high. This opposite movement is signaled by a red arrow pointing downwards in the indicator window.
- Read More THE RSI DIVERGENCE STRATEGY
Conclusion of this Divergence Indicator
In conclusion, the Stochastic Divergence Indicator is a dynamic tool that enhances the predictive accuracy of trading strategies by efficiently identifying trend divergences. Its alert system, multiple timeframe compatibility, and customizable nature make it a valuable addition to any technical analyst’s toolkit.



MT4 program crashes
MT4 1380