


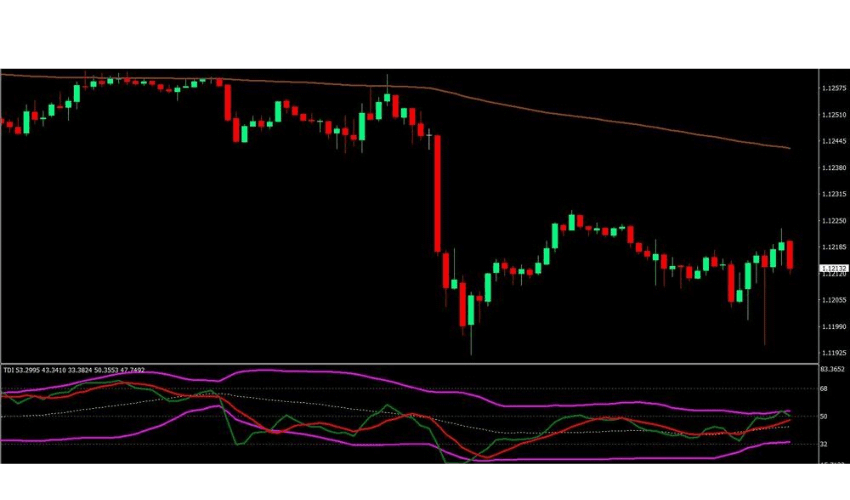
You can now download the Simple TDI Breakout Trading Strategy for free. The TDI (Traders Dynamic Index) indicator is one of the most commonly used custom technical indicators among forex traders. The indicator puts a lot of information into one indicator. It has a Bollinger Band-like feature that allows traders to identify oversold and overbought market scenarios on a dynamically moving line, which also use as a resistance or support. It is indicated on a fixed range, allowing for an oversold and overbought market condition to be identified based on that range. It also has an RSI line that mirrors the price movement, and it has a signal line derived from a Moving average used as a crossover signal. These all features make the TDI one of the complete technical indicators available to all forex traders.
Simple TDI Breakout forex Trading Strategy works well on all timeframes and currency pairs.
How to trade with Simple TDI Breakout Trading Strategy?
This forex trading strategy combines a TDI indicator-based entry signal and a breakdown or breakout from resistance or support. Moreover, this strategy should have a higher success rate because it combines both a clear indicator and a commonly traded price action strategy.
To filter trades further and identify the market’s direction easier, add the 200 EMA (Exponential Moving Average ). If the price is over the 200 EMA, we only take long trade setups.
Buy (Long) Trade Setup
Entry
- Price should be over the 200 EMA (brown)
- there must be resistance as price retraces down (green)
- Price should break and close over the resistance line
- TDI: the RSI line (green) should cross over the Signal line (red)
- Open a buy entry at the close of the candle with all of the above rules
Stop Loss
Place the stop loss at the swing low below the entry candle
Take Profit
Place the take profit at 1.5x risk on the trade stop loss.
Sell (Short) Trade Setup
Entry
- The price has to be below the 200 EMA (brown)
- A support line can be identifiable as the price goes back up (green)
- Price has to break and close below the resistance line
- TDI: the RSI line (green) should cross below the Signal line (red)
- Enter a sell market order at the close of the candle with the confluence of the above rules
Stop Loss
Place the stop loss at the swing high above the entry candle
Take Profit
Set the take profit at 1.5x the risk on the stop loss
How to download and install an indicator?
To install the TDI indicator on your MT4, you need to follow below steps:
- Use the “Download Indicator” button at the bottom of the article.
- Save the file to your computer.
- Extract and move the files to the MT4>Indicator folder of the MT4 software file directory.
- Restart your Metatrader platform.
- Navigate to “Indicators.”
- And select the “Simple TDI Breakout Trading Strategy” template to apply it on the chart.
Read More: Using EMA in a Forex Strategy
Download a Collection of Indicators, Courses, and EA for FREE
Hi I need to learn. How can u help me
[…] Traders Dynamic Index(TDI) […]