Welcome to our weekly market analysis from ForexCracked.com! It’s the third week of June. Wow, time flies!
It is not the news, government, or politics that drives the market; rather, it is the supply and demand between buyers and sellers. The only thing that drives the market prices is the orders that people send to the markets.
This analysis article isn’t about telling you when to buy or sell. It’s about teaching you how to approach the market effectively. Every day, I follow the same routine before I start trading. In this article, I’ll briefly explain the technical aspects of what’s happening and what actions I take in these situations. Your goal is to understand what I do so you can follow the same process on your own.
Upcoming Events for This Week
These events include macroeconomic reports, economic indicators, and, generally, what’s going on in the world. Only the most important ones are considered here. You can check the forexfactory.com for all the events.
17/06/2024
At around 8:30 AM, the Empire State Manufacturing Index report will be released. This news can cause some volatility in USD pairs.
18/06/2024
At around 12:30 AM, the RBA will release its monetary policy statement. This news has high volatility for AUD pairs.
Around 8:30 AM, the US will release its Retail Sales Report. This event can cause slight volatility for USD pairs.
19/06/2024
At around 2:00 AM, CPI data for GBP will be released. This important index measures inflation so that this news will affect GBP pairs.
US banks will be closed for Juneteenth. Expect less liquidity and high volatility in USD pairs.
Around 6:45 AM, New Zealand will release its GDP report. This will affect NZD pairs.
20/06/2024
Around 3:30 AM, the Swiss National Bank releases its monetary policy statement, which is highly volatile news for CHF.
Around 4:00 AM, the Swiss National Bank holds a press conference that may also affect CHF pairs.
Around 7:00 AM, the Bank of England releases its monetary policy statement, which is a highly volatile event for GBP pairs.
Around 8:30 AM, the US releases its unemployment claims report, which shows some volatility in USD pairs.
21/06/2024
Around 2:00 AM, England will release its retail sales report, which is a slightly volatile event for GBP pairs.
Around 3:15 AM, French Flash Manufacturing & Services PMI will be released, potentially causing some volatility in EUR pairs.
Around 3:30 AM, the German Flash Manufacturing & Services PMI will be released, also likely causing some volatility in EUR pairs.
Later, around 4:00 AM, Flash Manufacturing & Services PMI will be released for EUR.
Around 4:30 AM, England will release its Flash Manufacturing & Services PMI, which may cause some volatility in GBP pairs.
Around 9:45 AM, the US will release its Flash Manufacturing & Services PMI, which could lead to some volatility in USD pairs.
In conclusion, this week is crucial for the economy, as monetary policy statements and CPI data scheduled for release affect currencies. Market dynamics will be driven by fundamental factors that overshadow any price action influenced by supply and demand alone. Fundamental analysis, including these news events, holds greater sway than technical analysis.
Forex
EURUSD:
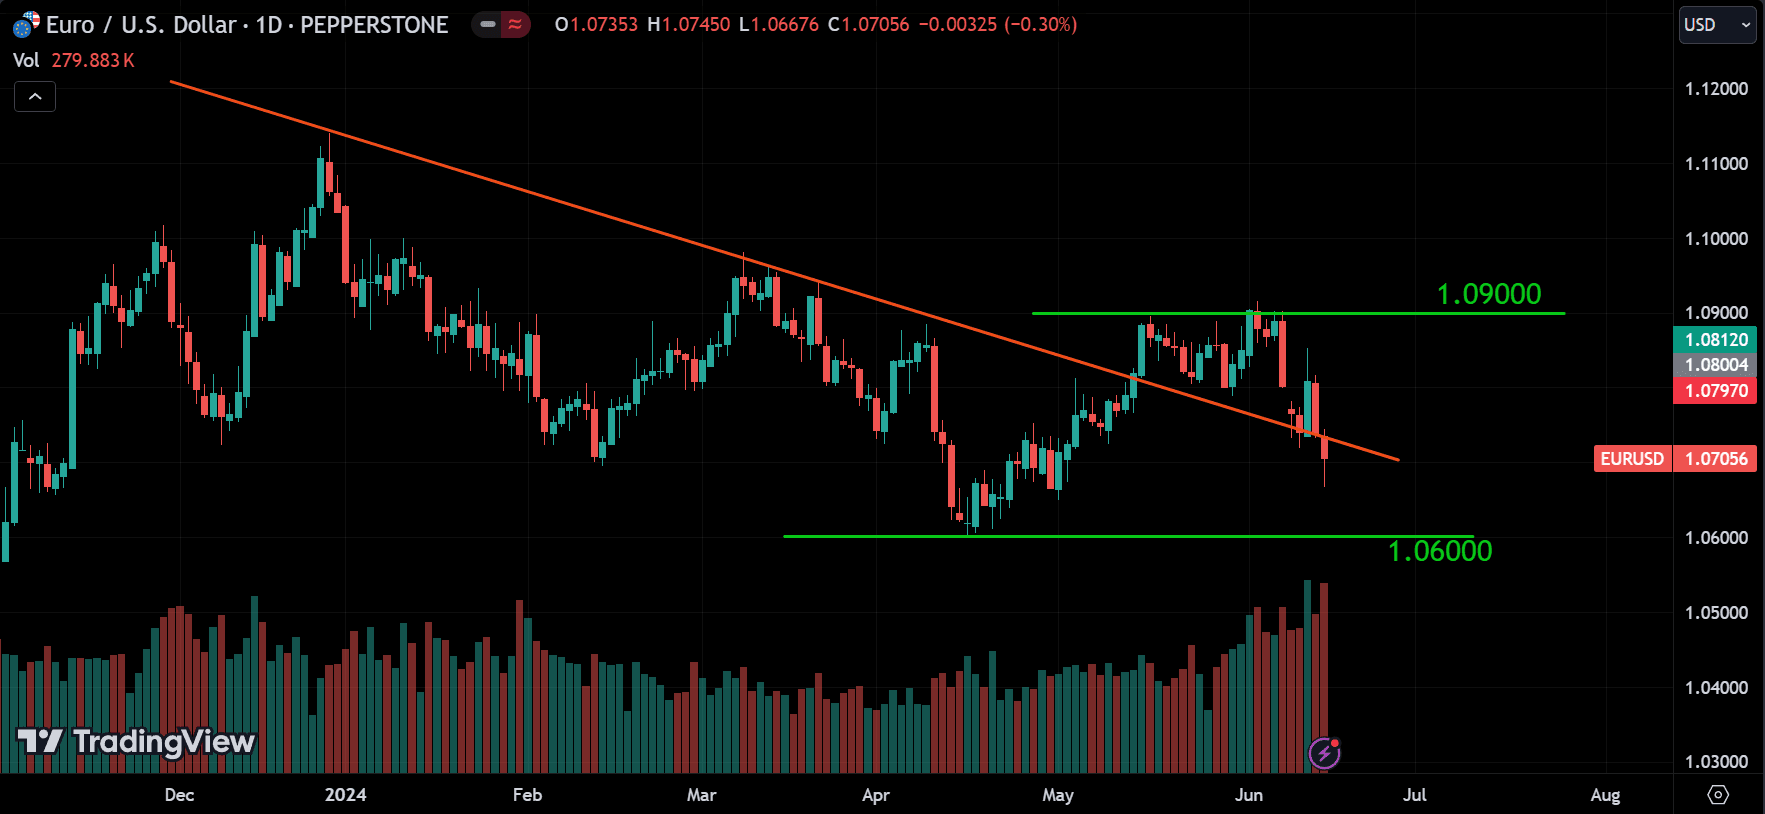
Looking at EURUSD, it has broken below the major support line and is now trading within that range. This suggests that the previous upward trend has ended, and the market is currently undecided.
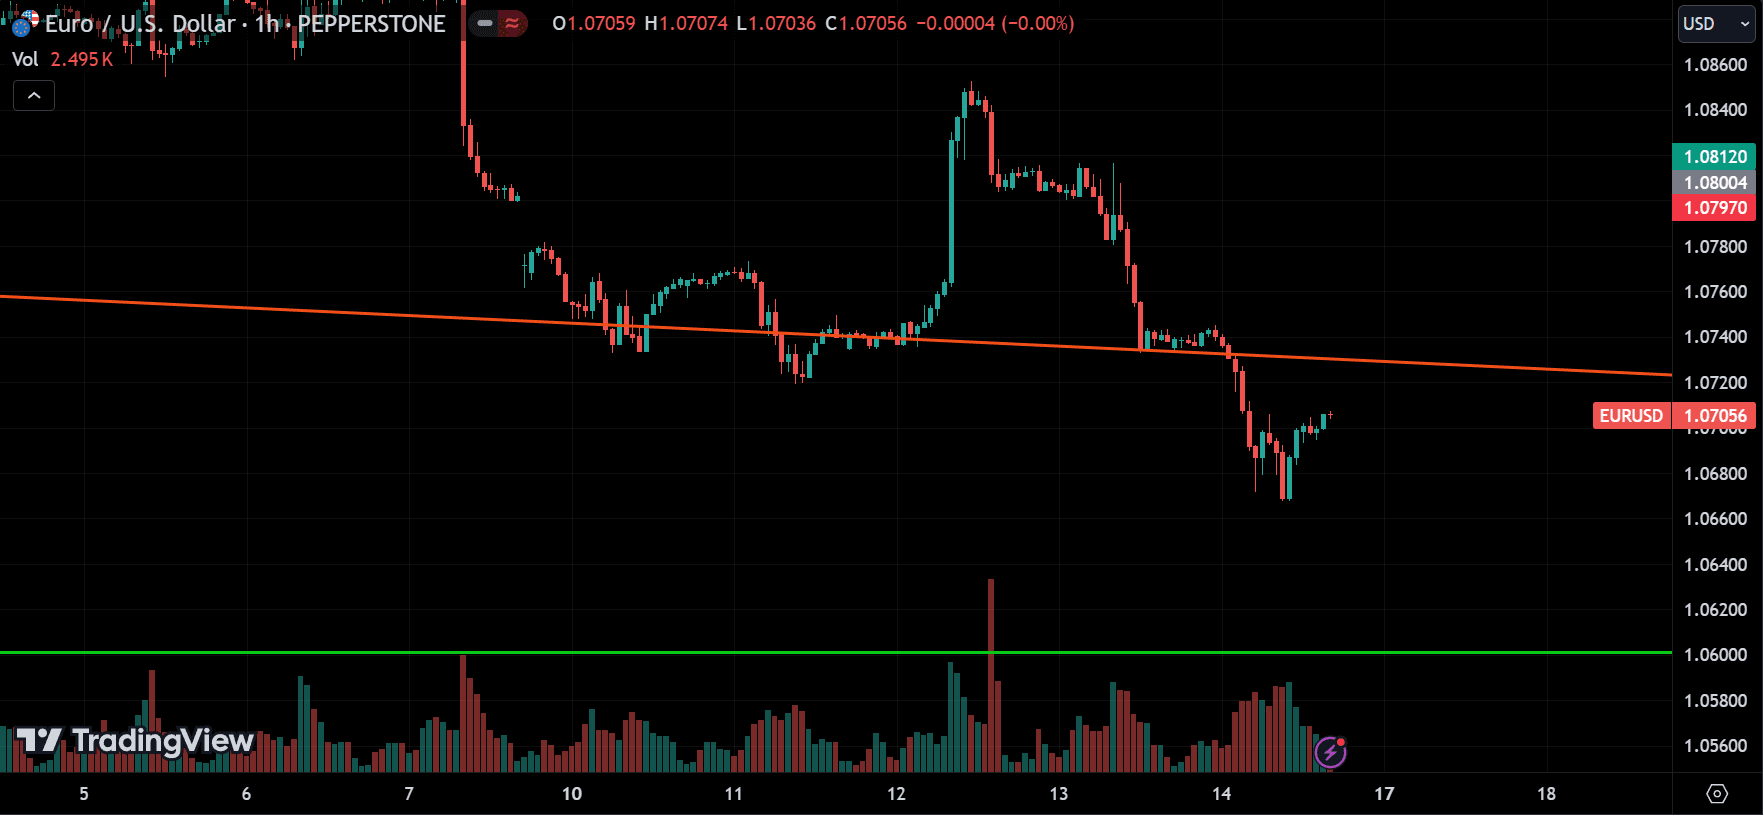
Looking at the daily chart, you can observe a support level of around 1.06000. We anticipate the price will find support near this level and potentially bounce back, possibly even before reaching it. The recent breakout was influenced by the FOMC news. As the market adjusts to this change, it is likely to move in its “true” direction. Keep in mind that if the 1.06000 level is breached, the price could continue to decline.
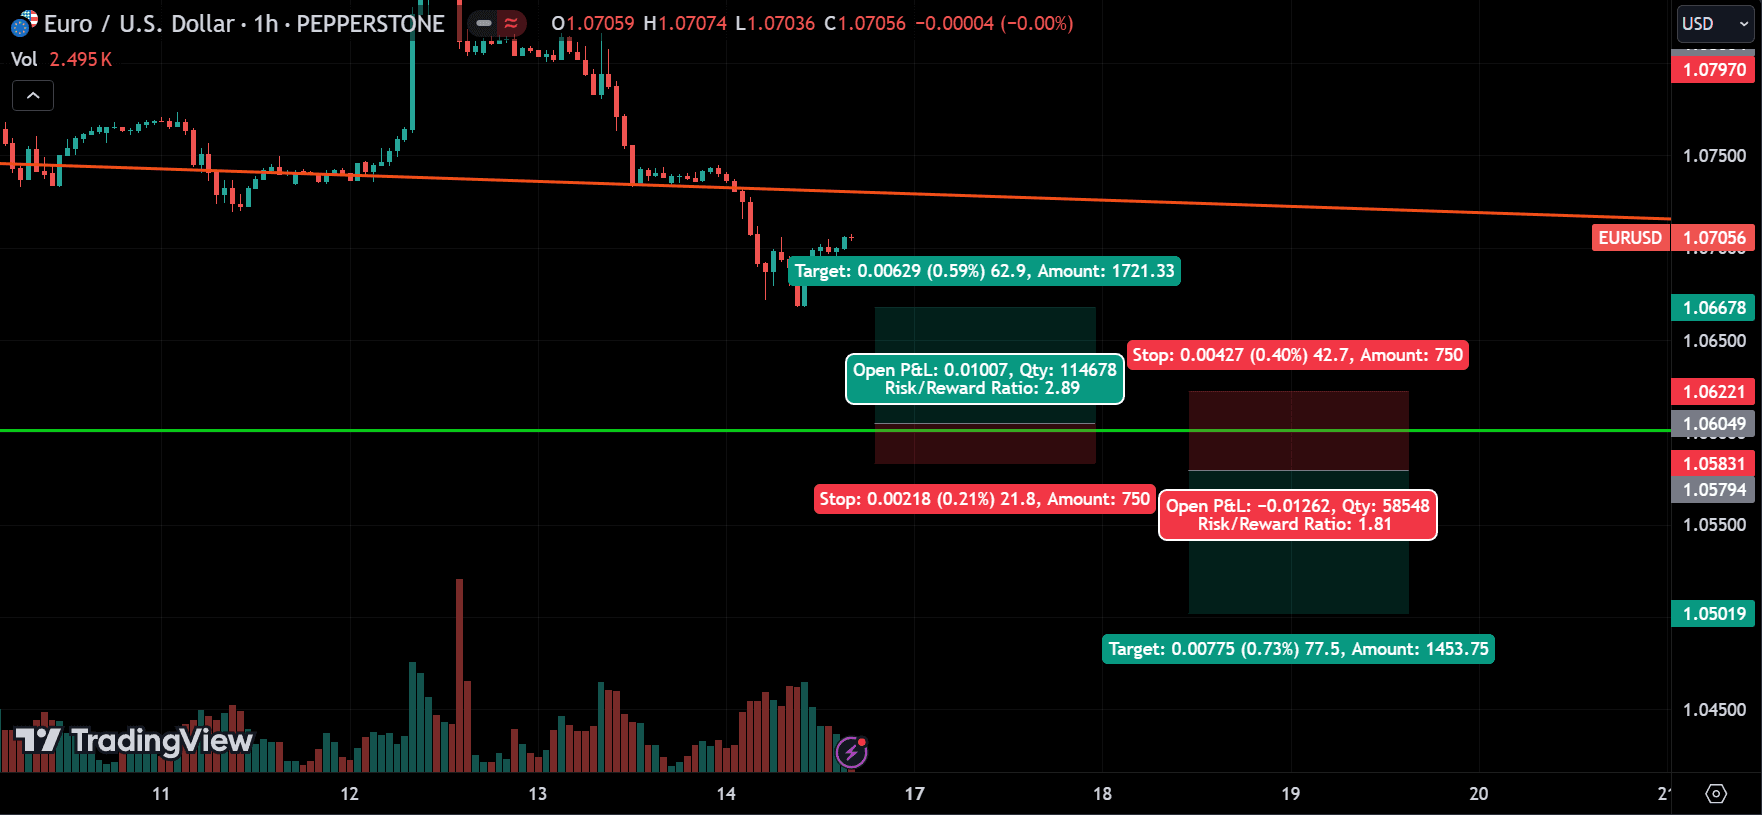
Trading Idea: If you spot a reversal pattern near the 1.06000 support level, consider buying the pair. Alternatively, if the price breaks below this support, consider selling the pair.
USDJPY:
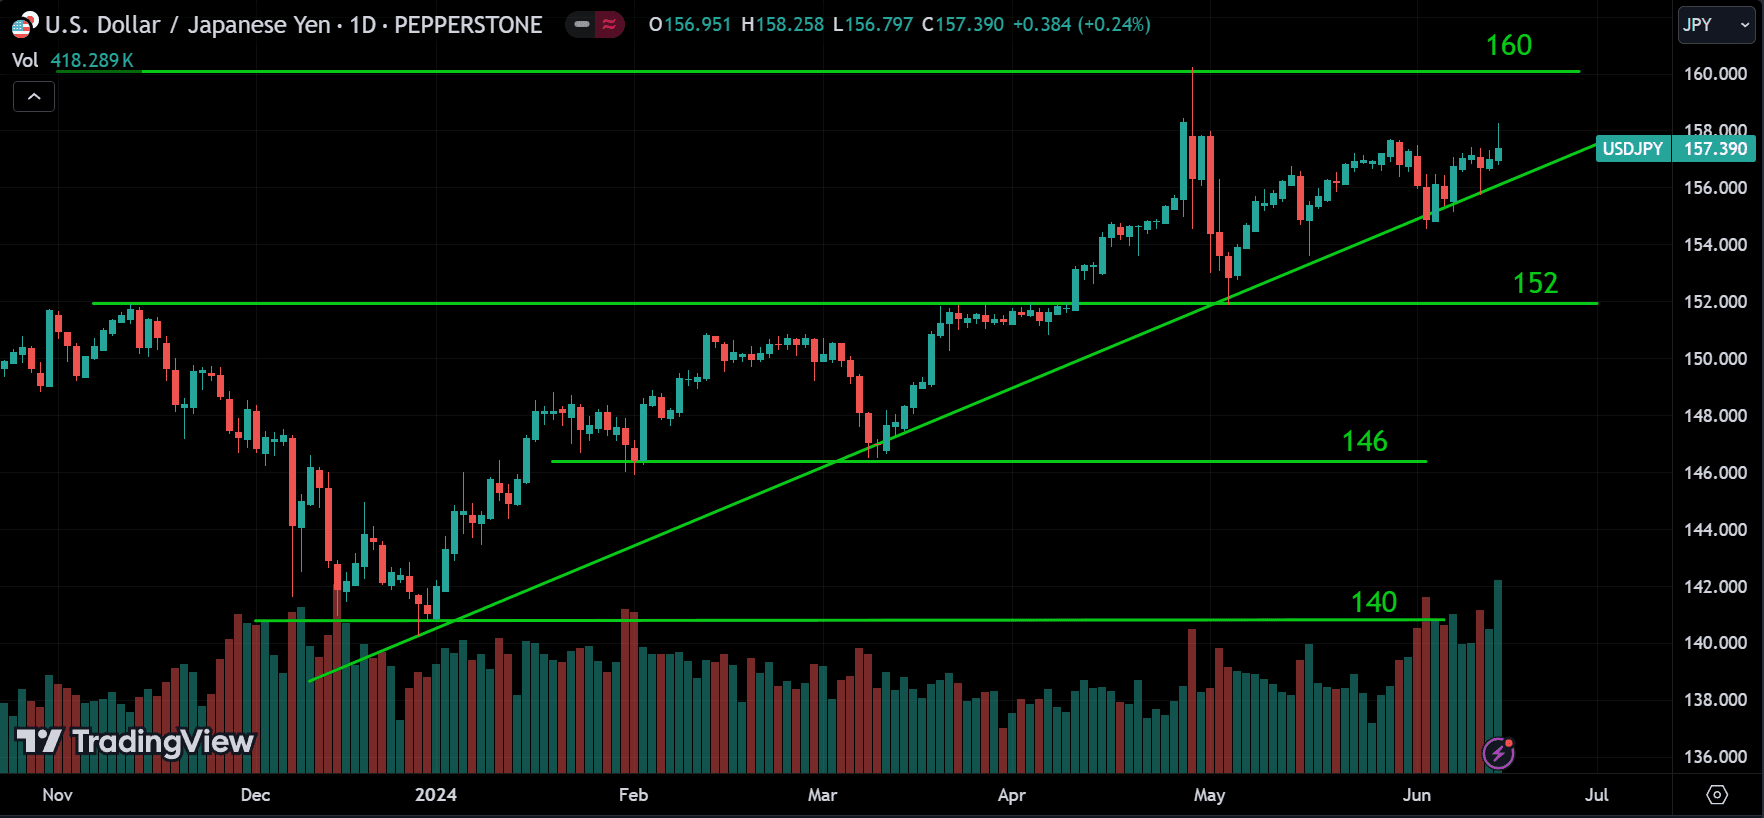
Examining USDJPY, it remains in an uptrend and is approaching the 160 level, which represents the strongest resistance for the price. The upward-sloping trend line acts as the strongest support.
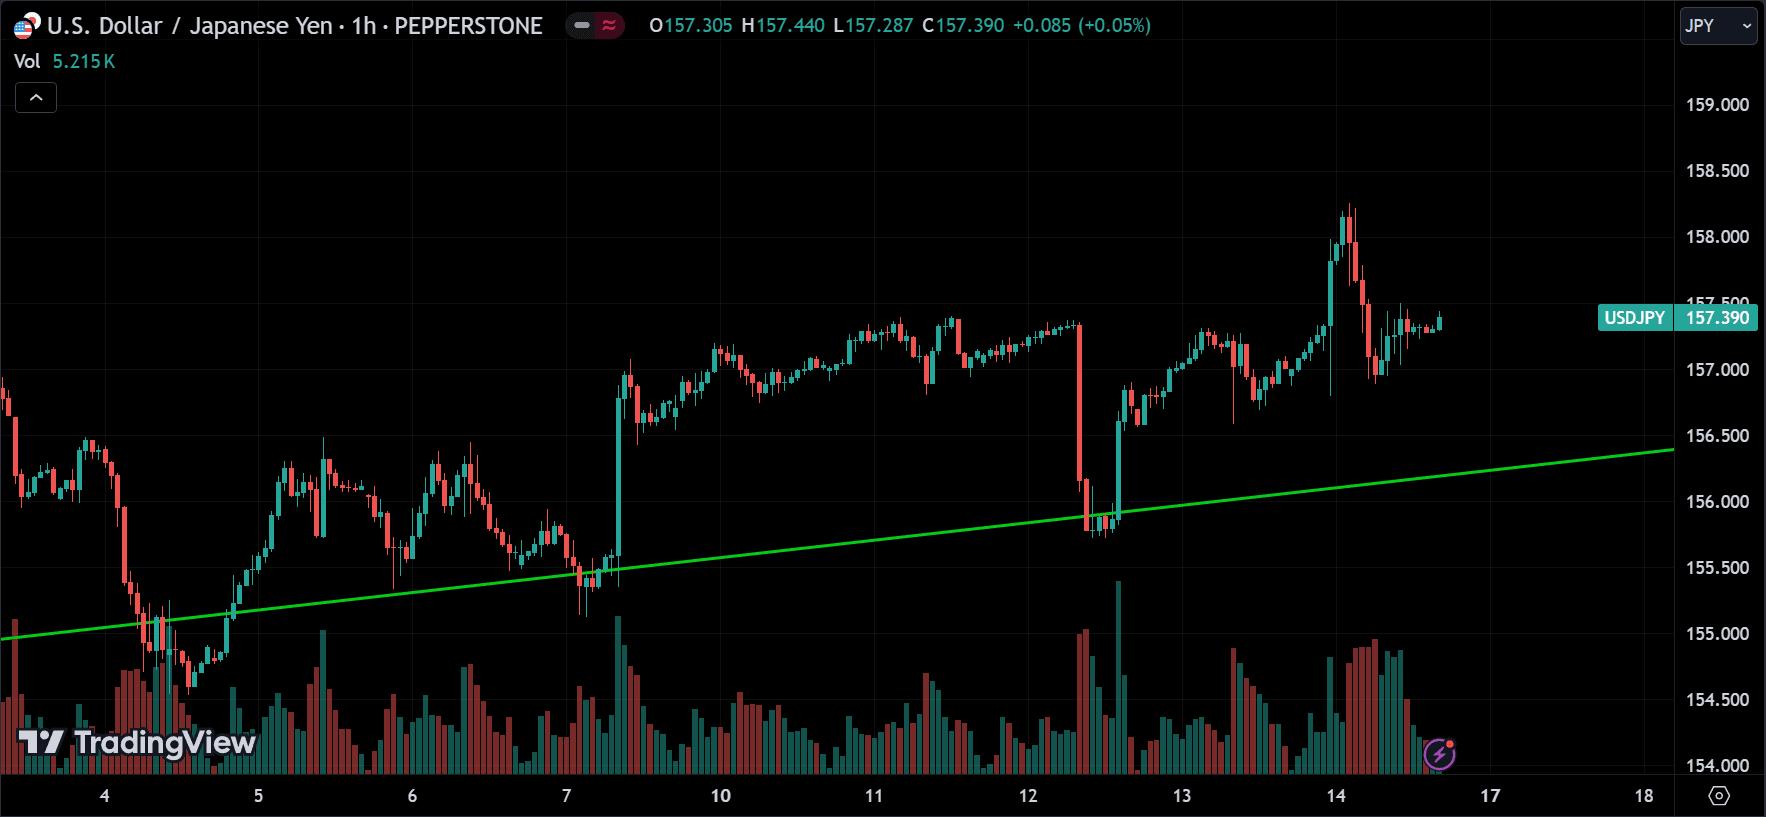
Now, examining the 1-hour chart, you can see that the price has found support around the slope line three times and rebounded. Currently, the price is above that level, suggesting two potential scenarios: the price may continue its upward movement from its current position, or it could decline back to the support and rebound again. However, be mindful that a break below this support indicates a trend change. Keep an eye out for breakouts as the overall trend remains bullish.
GBPUSD:
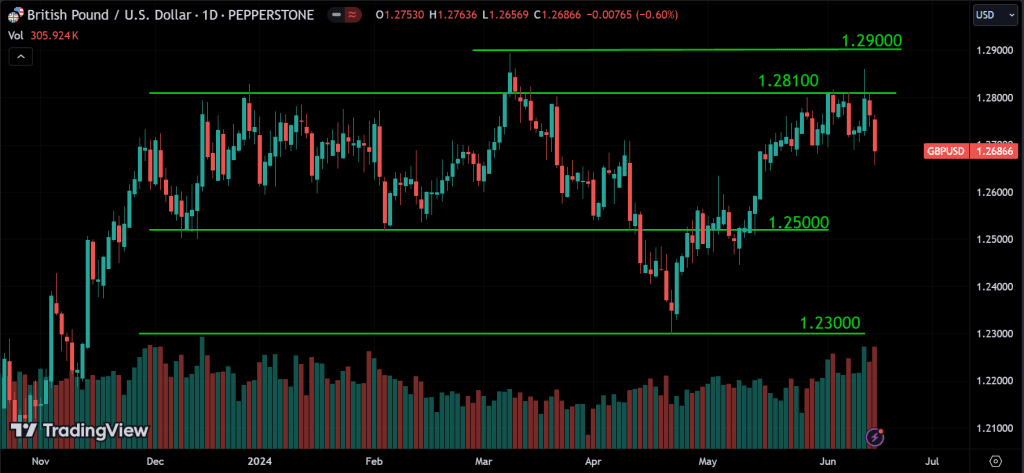
GBPUSD is currently in an uptrend. After reaching the resistance level of around 1.28100, it retraced and is now declining towards the 1.25000 level.
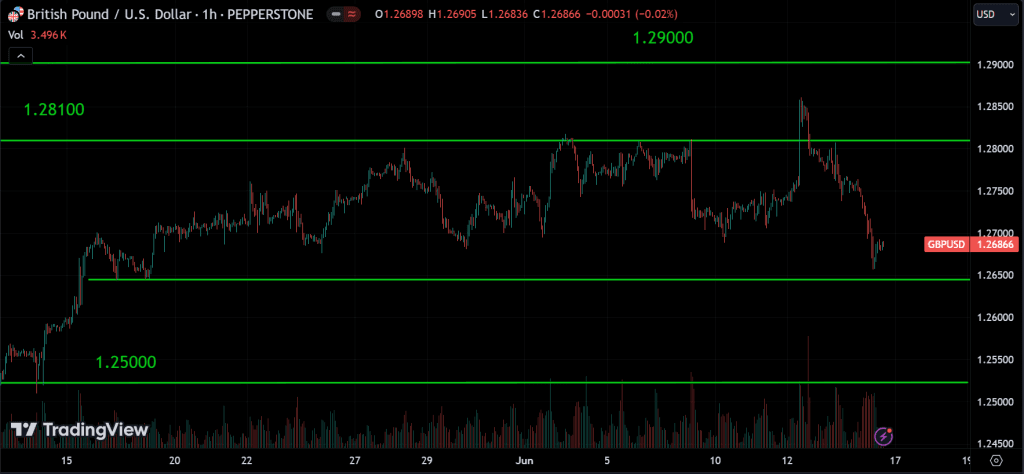
Now, looking at the 1-hour chart, you can observe support around the 1.26500 level, with the price nearing that point. We can anticipate two scenarios: the price may pull back from this level and resume its upward movement, or it could break below this support and decline toward the next support level.
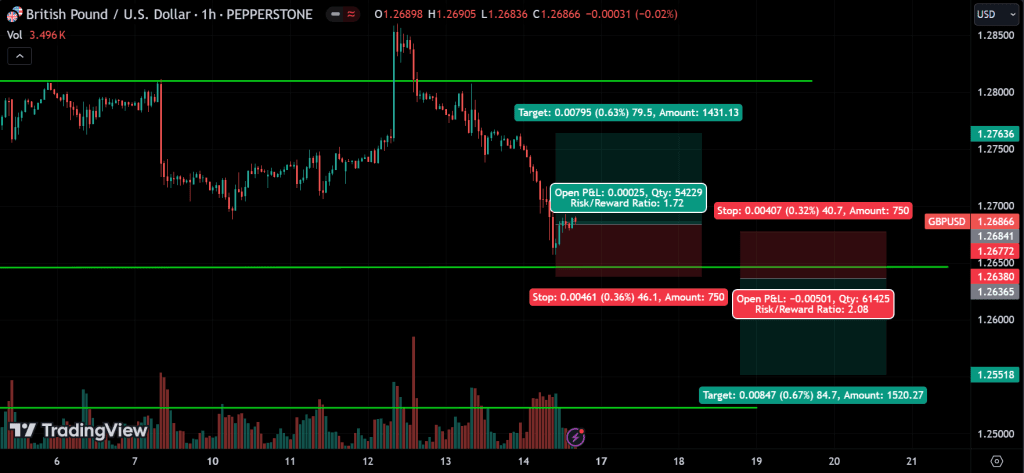
Trading Idea: Since the price is consolidating and we’ve observed a reversal signal around the support, we can consider buying the pair. Additionally, if the price breaks below this support level, there is an opportunity to sell the pair short.
USDCHF:
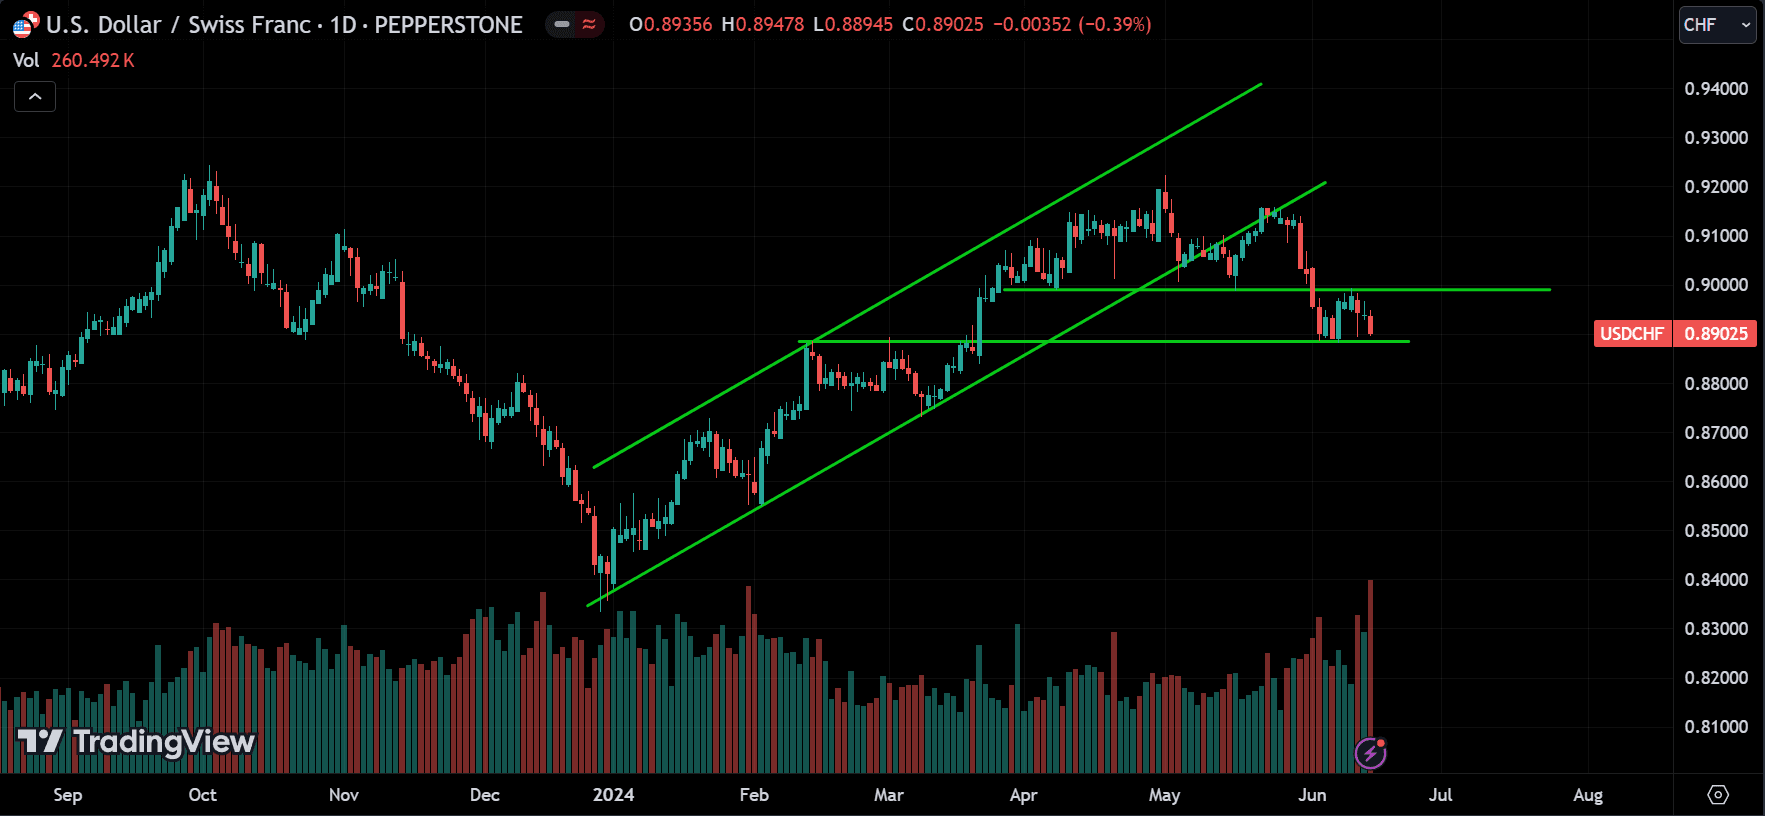
USDCHF, previously in an uptrend channel, has broken out of it and is now declining, finding support around the 0.89000 level.
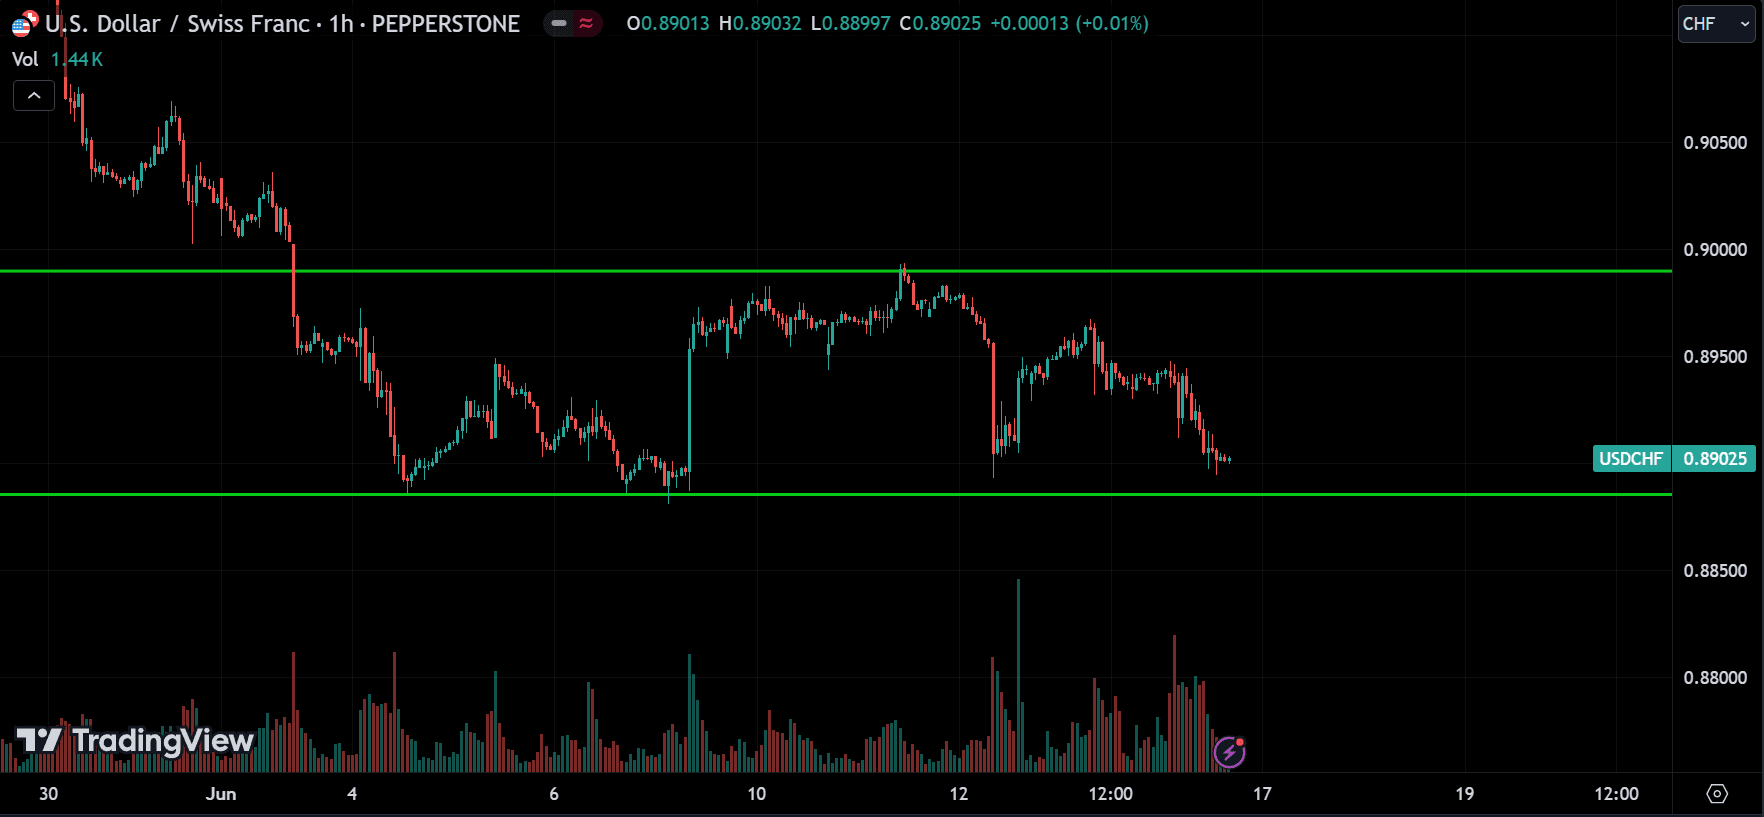
Now, observing the 1-hour chart, you can clearly see that the price is consolidating. There is support around 0.89000 and resistance around 0.90000, and the price needs to stay within this range. We anticipate the price to either rebound from the support line and move higher or break below this support and continue to decline.
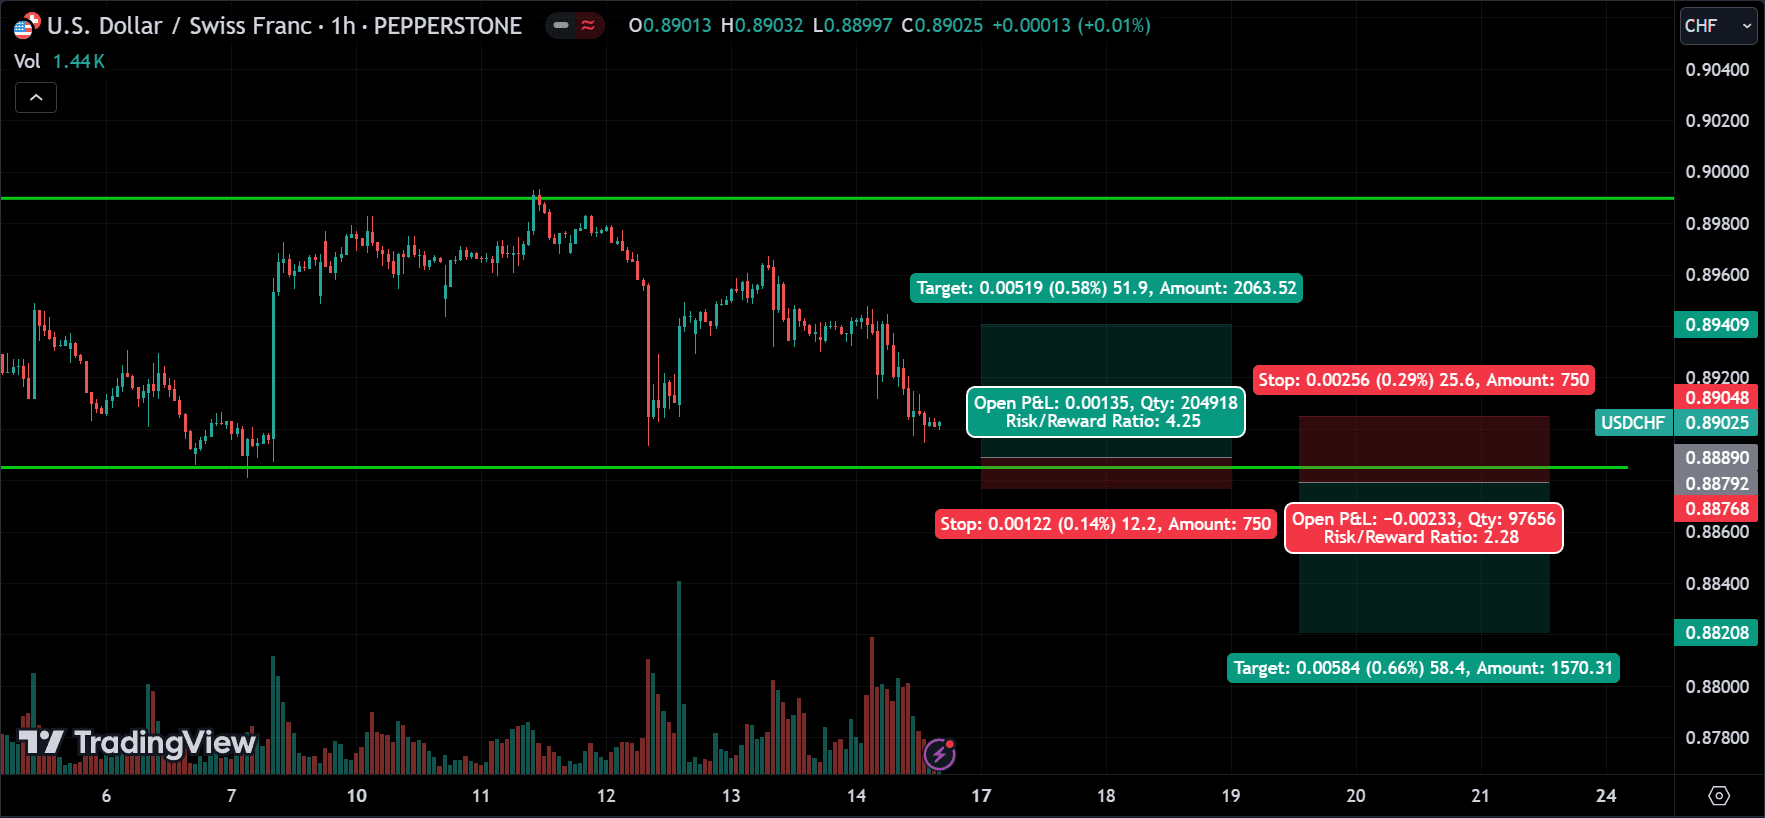
Trading Idea: Since the pair is trending downwards, consider buying if you spot a reversal signal near the support. Alternatively, you can sell the pair short if the price breaks below the support.
USDCAD:
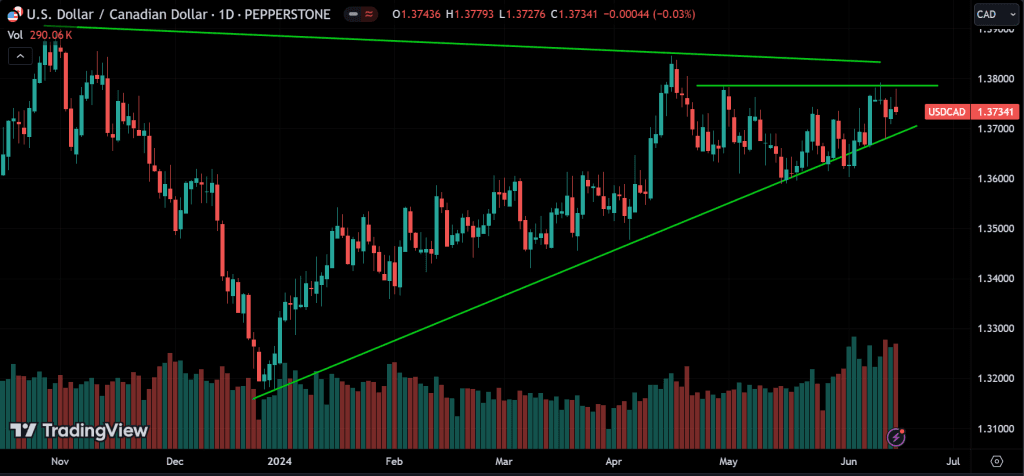
Examining USDCAD, it is currently in an uptrend, with the lower slope trend line serving as a major support level, and there are two resistance level lines.
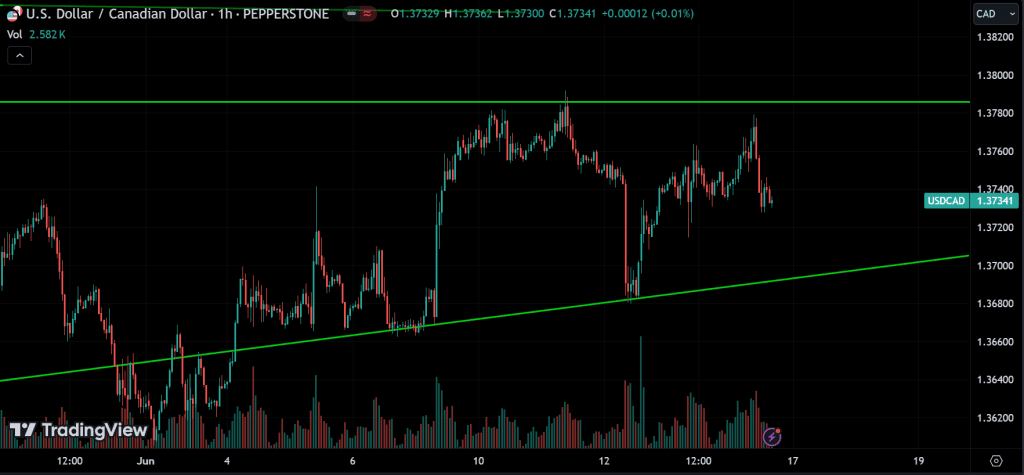
Now, looking at the 1-hour chart, you’ll notice the price is retreating from a resistance level. We might anticipate the price to decline towards the major support and rebound from there. Alternatively, the price could pull back now and move back towards the resistance level. As the price appears squeezed, a breakout is likely imminent. The direction of this breakout, whether it’s at the support or resistance, will determine the future trend. Keep an eye out for any breakouts.
AUDUSD:
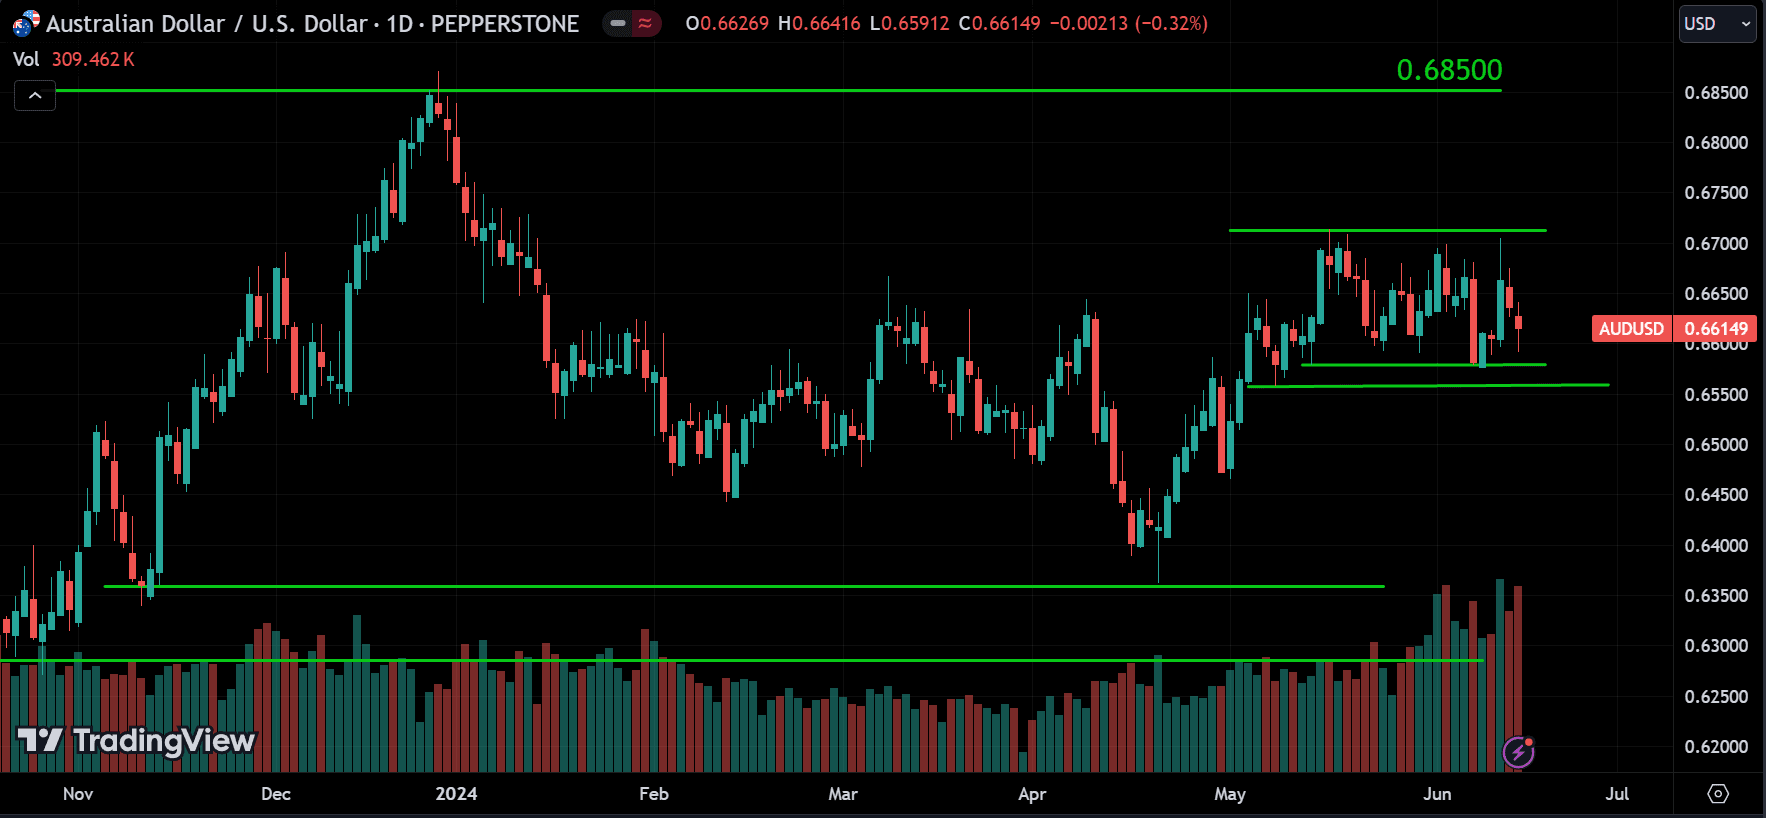
Examining AUDUSD, it is currently in an uptrend but consolidating between the levels of 0.65500 and 0.67000. These levels are currently serving as both support and resistance to the price.
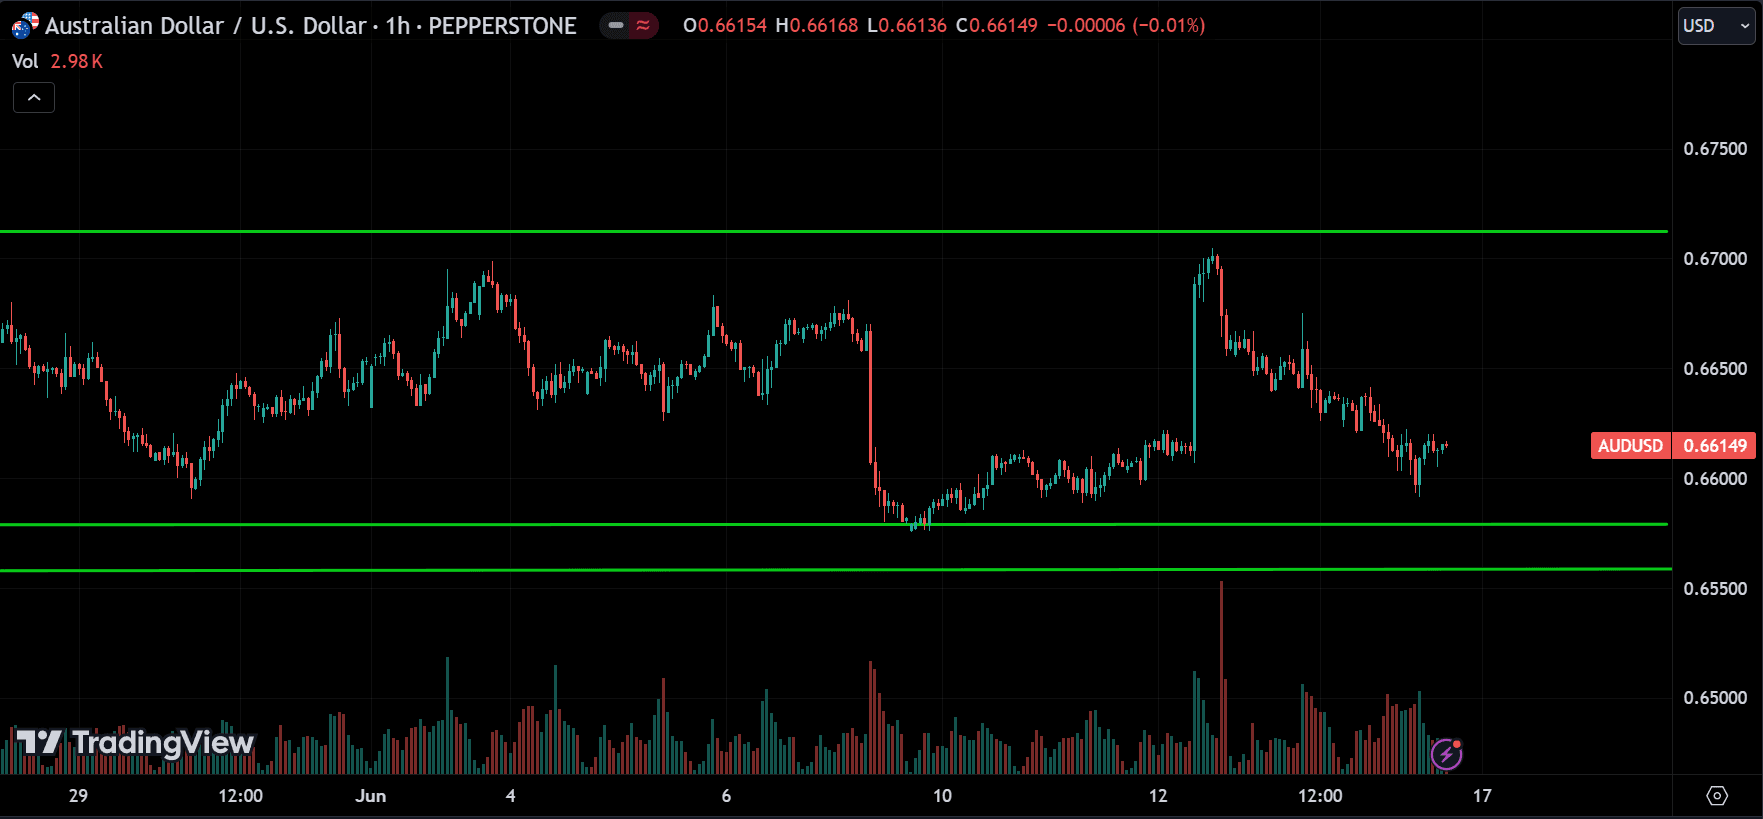
Now, observing the 1-hour chart, you can see that the price is approaching the support level. We can anticipate two scenarios: either the price breaks below this level and continues to drop, or it pulls back and begins to rise.
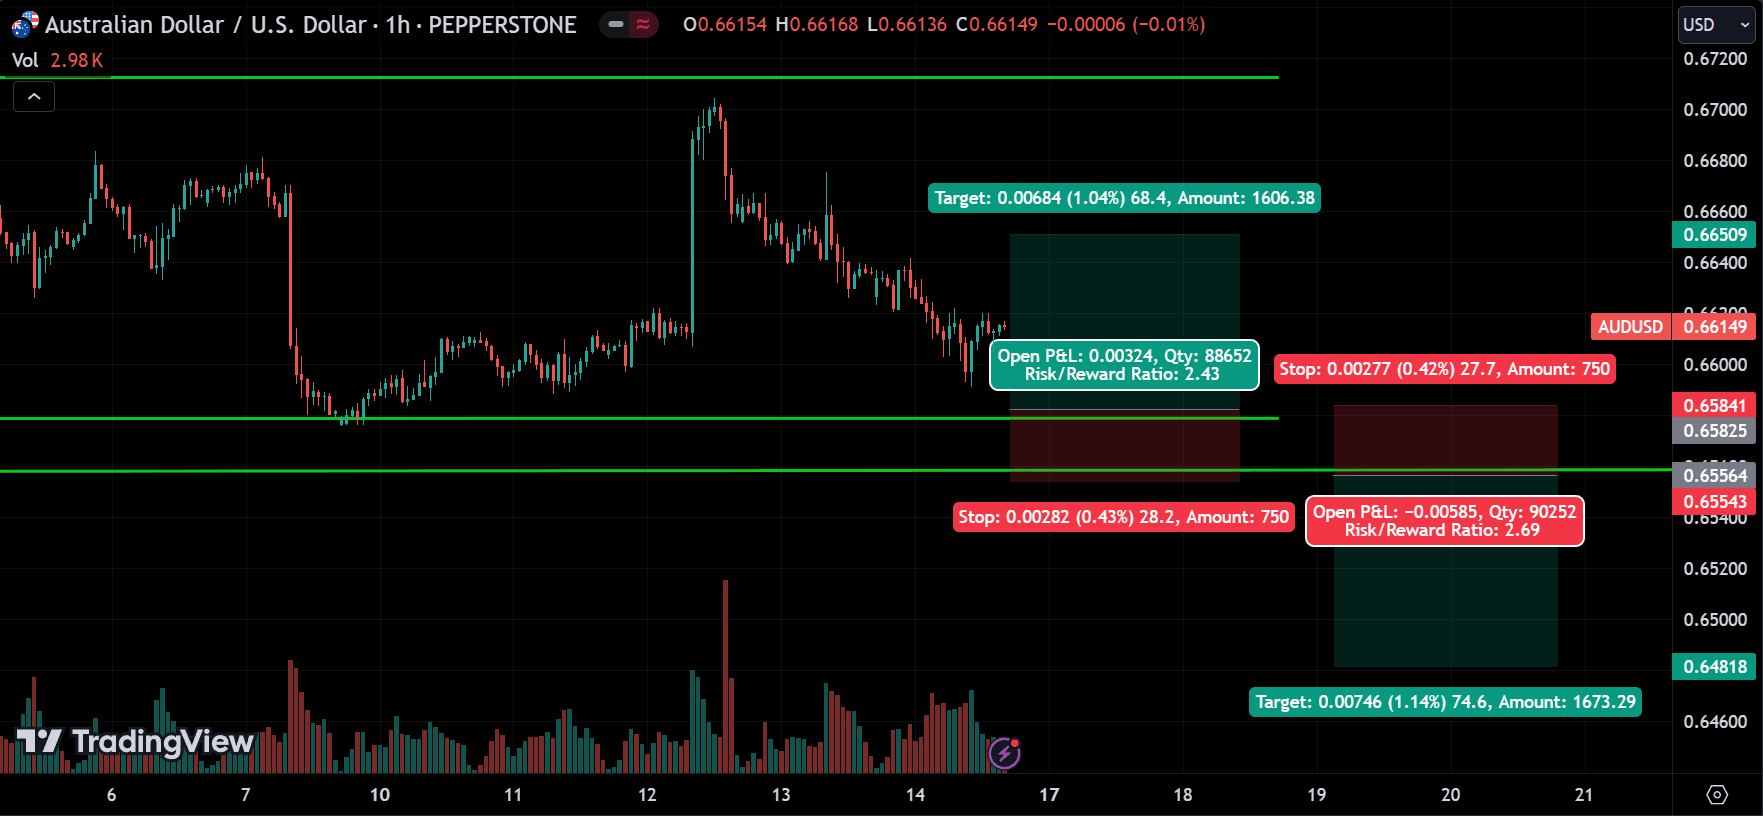
Trading Idea: Consider buying the pair if you spot a reversal signal around the support level. Alternatively, consider selling the pair if the price breaks below this major support.
NZDUSD:
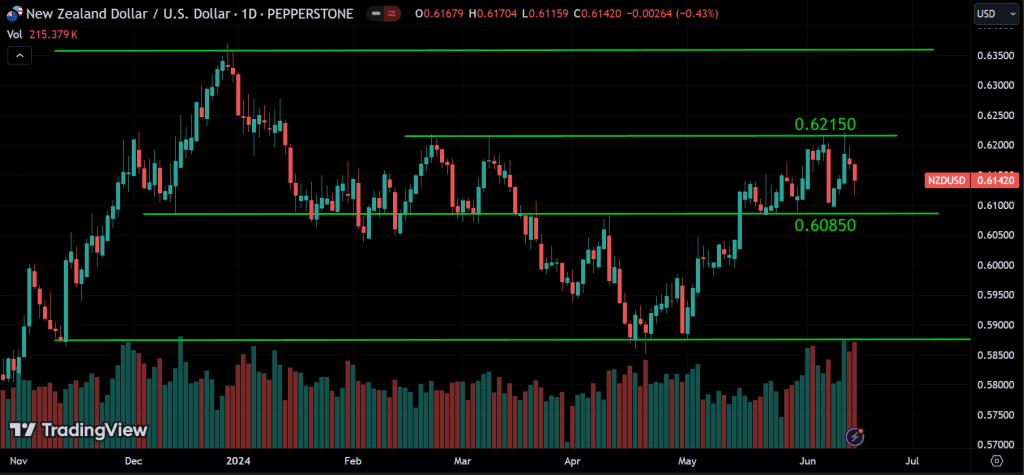
Examining NZDUSD, it is currently in an uptrend but is consolidating within the range of 0.60850 to 0.62150. These two levels serve as major support and resistance for the price.
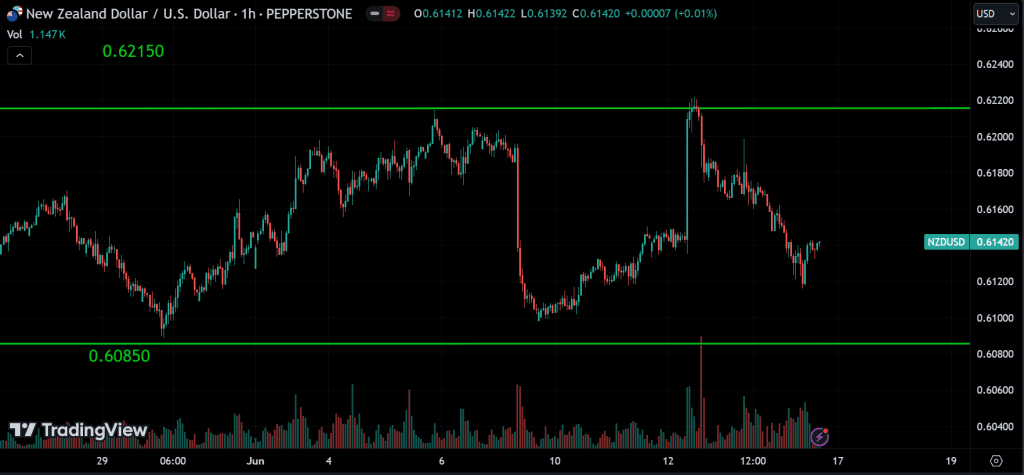
Now, examining the 1-hour chart, you can observe that after reaching the resistance level, the price fell sharply towards the support level. We can anticipate two scenarios from this movement: the price may rebound from this level to continue upward, or it could decline again towards the major support of around 0.60850 and bounce from there. It’s important to note that if the price breaks below this support range, the trend could be changing. The same applies to the resistance level as well.
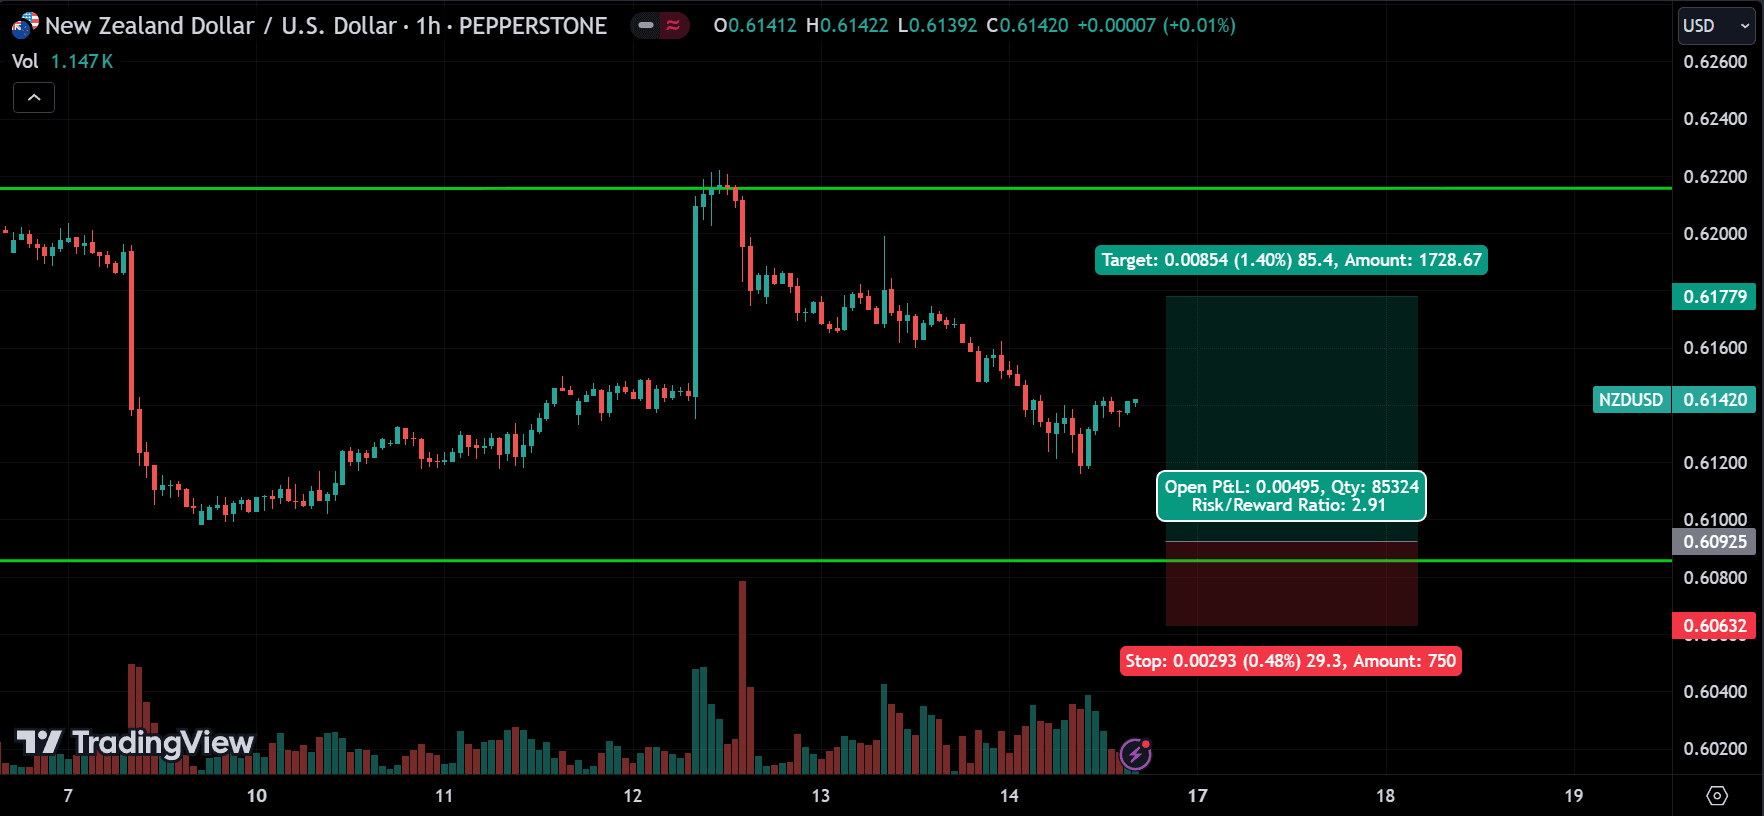
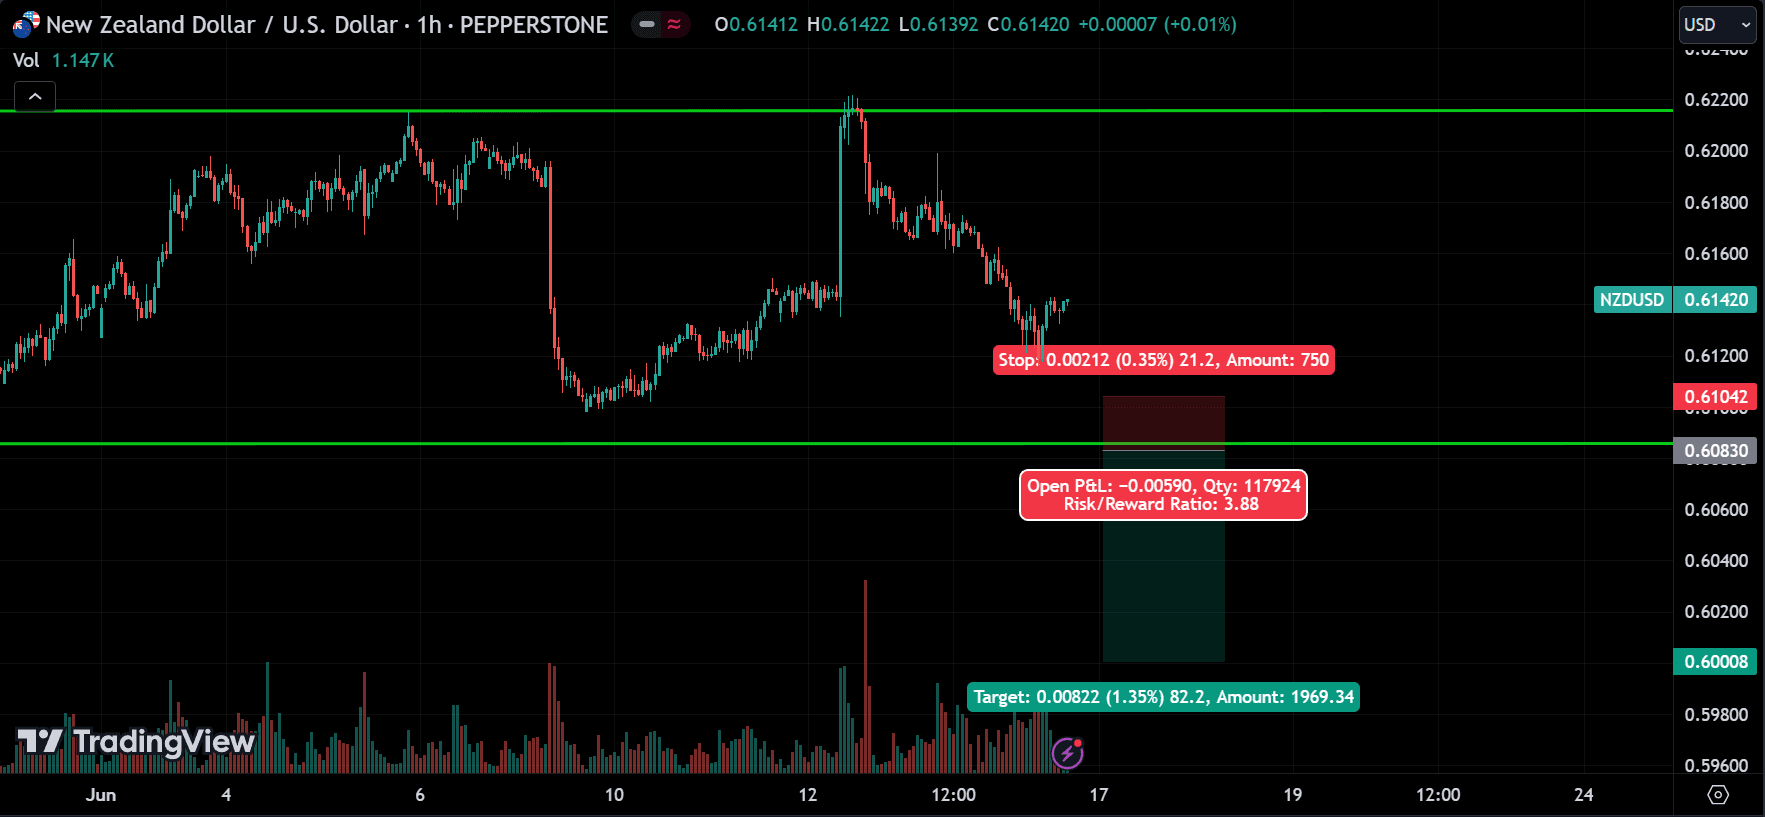
Trading Idea: Consider buying the pair if the price falls to the support and shows a reversal pattern. Conversely, consider selling the pair if the price breaks below the support line.
Now, remember that these trading ideas are just illustrative examples. The actual take profit and stop loss levels depend on your risk tolerance. Also, keep in mind that you should only take these trades when everything aligns in your favor, such as confirming them with breakouts and reversal candlestick signals. Otherwise, they may not be successful. That’s the essence of trading.
Commodities
GOLD:
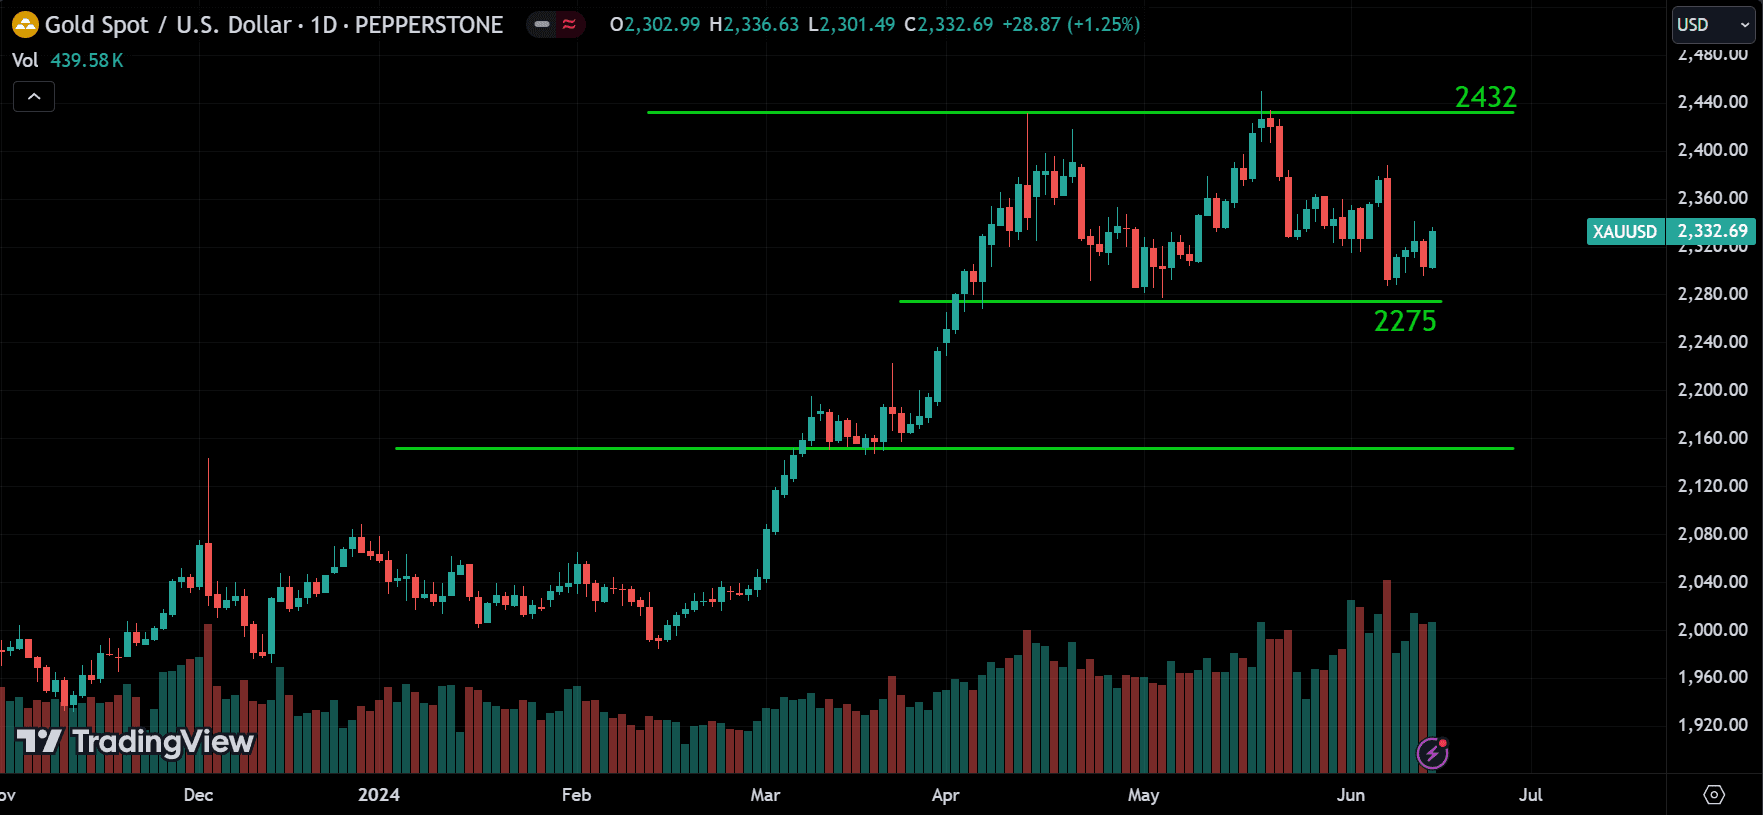
Looking at gold, after reaching a high of around 2432, the price pulled back to the support level near 2275.
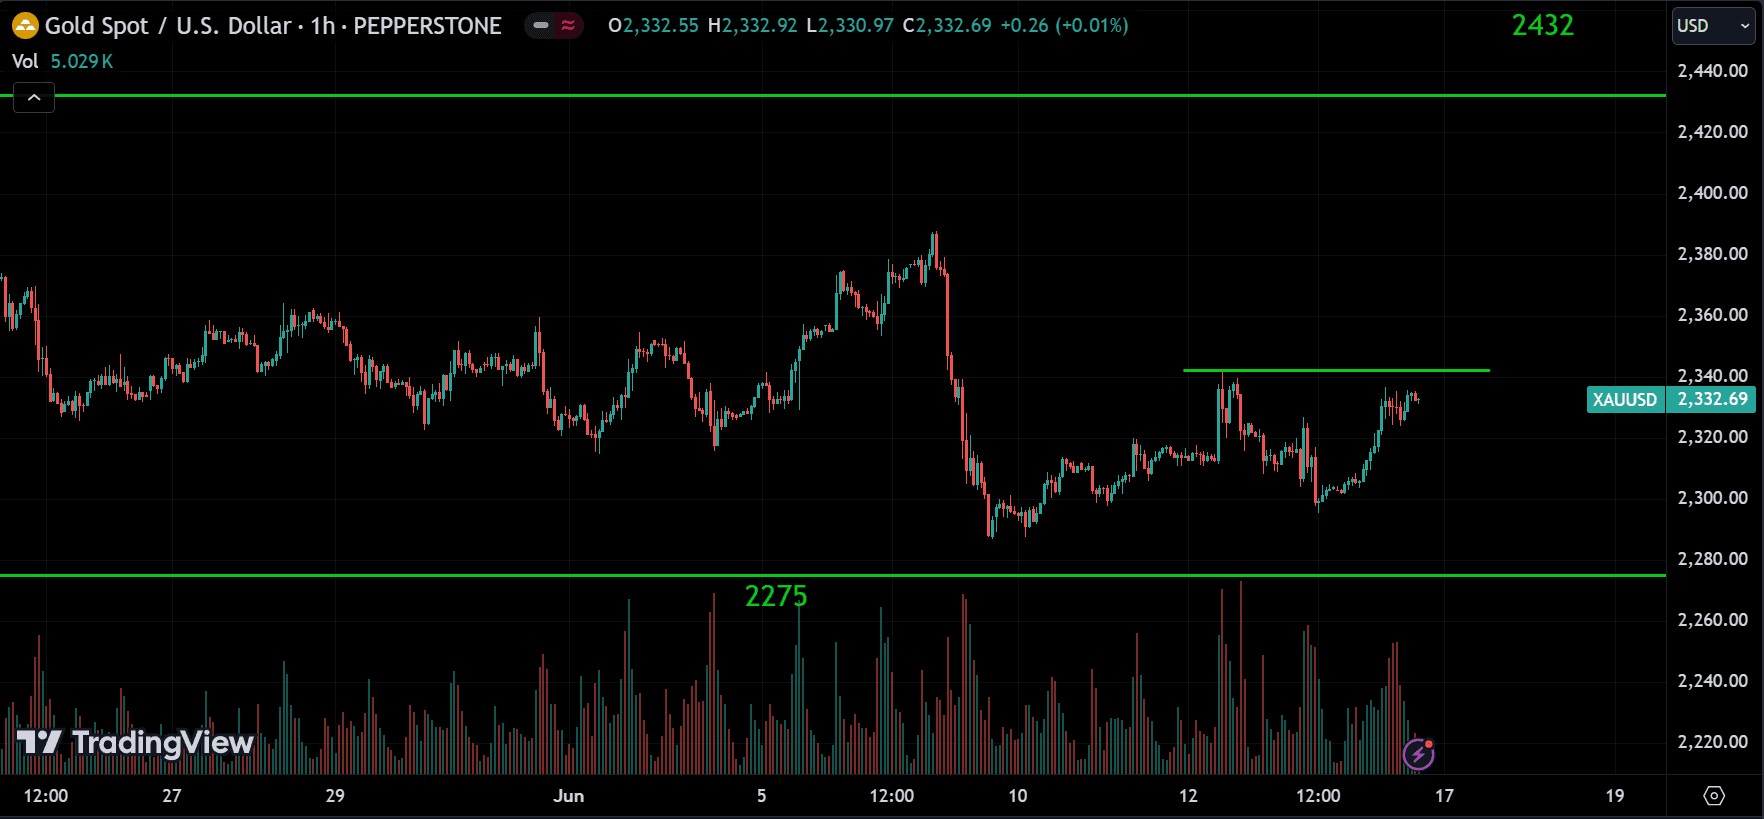
On the 1-hour chart, you’ll notice the price has bounced back from support and is now trading near a minor resistance level. If the price breaks above this resistance level, we can expect gold to continue its upward movement towards the next resistance level. However, be aware that if the price breaks below the support around 2275, it may continue to decline towards the next significant support level. Keep an eye out for any breakout opportunities.
SILVER:
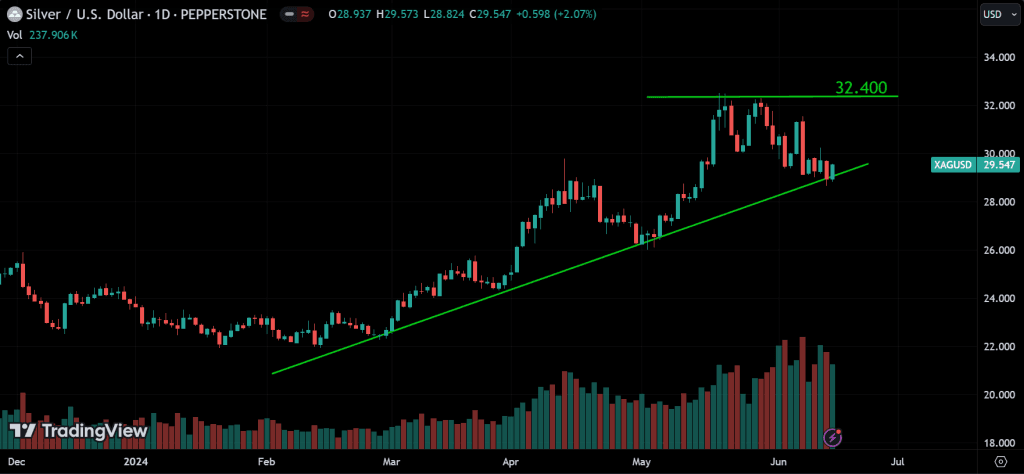
Looking at silver, it remains on an uptrend, with a major resistance around 32.400 and the upward-sloping trendline acting as major support.
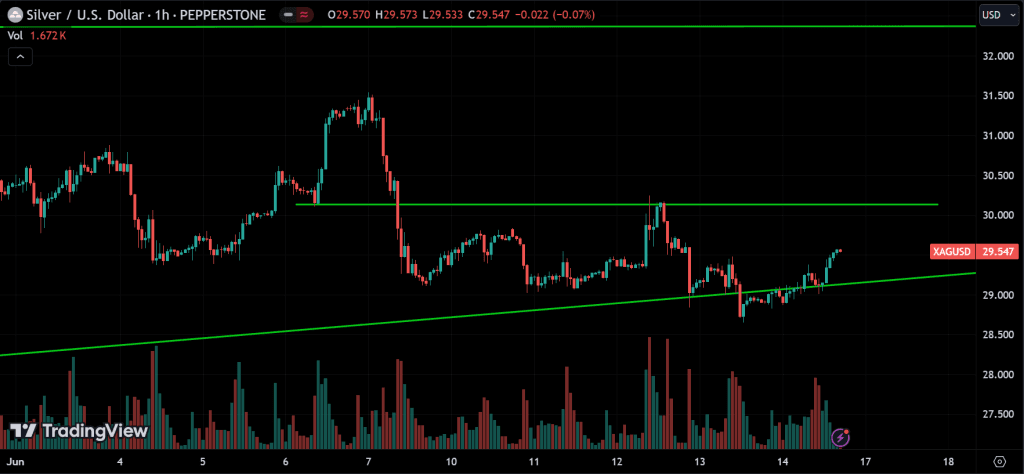
The price is currently trading near a major support line and appears to be attempting to rebound from this level. If the price breaks below this support, it could signal a shift in the overall major trend, indicating that silver is no longer in an uptrend. On the other hand, the price might pull back and continue upward toward the resistance around the 30.200 level. It could either correct from that point or break through the resistance and continue its ascent. Therefore, there are two potential breakout scenarios to watch out for, as they will determine the future direction of the price.
CRUDE OIL:
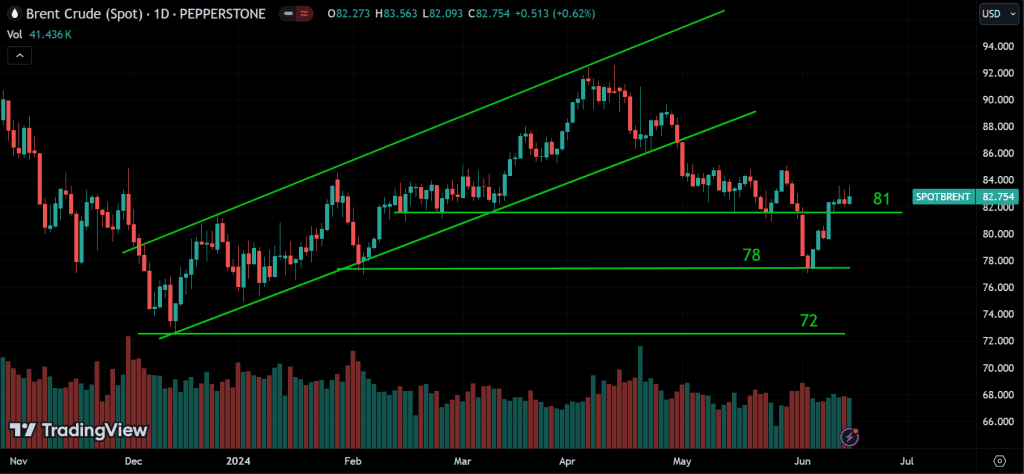
Examining Oil, after breaking the upward channel, the price dropped to a support level near 78 and rebounded from that point.
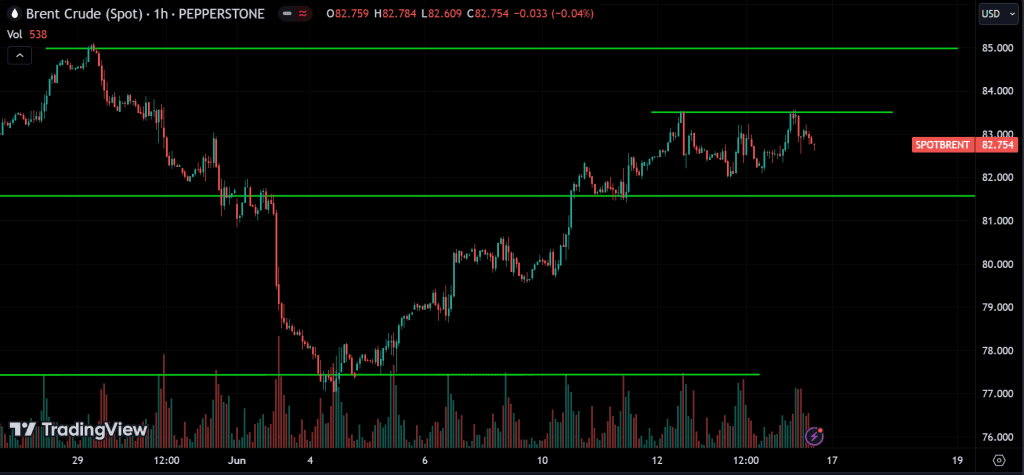
On the 1-hour chart, you’ll notice the price is near a resistance level. If the price breaks above this resistance, we can expect it to reach the next resistance around the 85 range. Alternatively, the price might pull back from this resistance and move towards around 82. Given the proximity to support and resistance levels, potential breakouts are possible. Keep a close watch, as breakouts will determine the future trend.
Cryptocurrency
BTC:
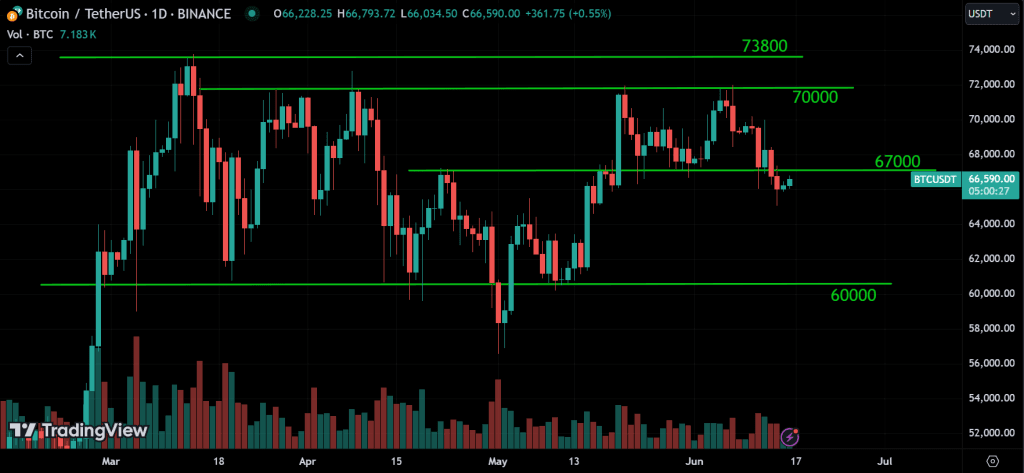
Looking at BTC, it failed to break through after testing the 70K resistance level four times since the all-time high. Now, the price has pulled back from 70K and is trading below 67K, which was the support level. If the price can’t rise above 67K, it will likely reach the 60K level. However, it’s more probable that it will move back within the 67K to 70K range. Let’s see what happens.
ETH:
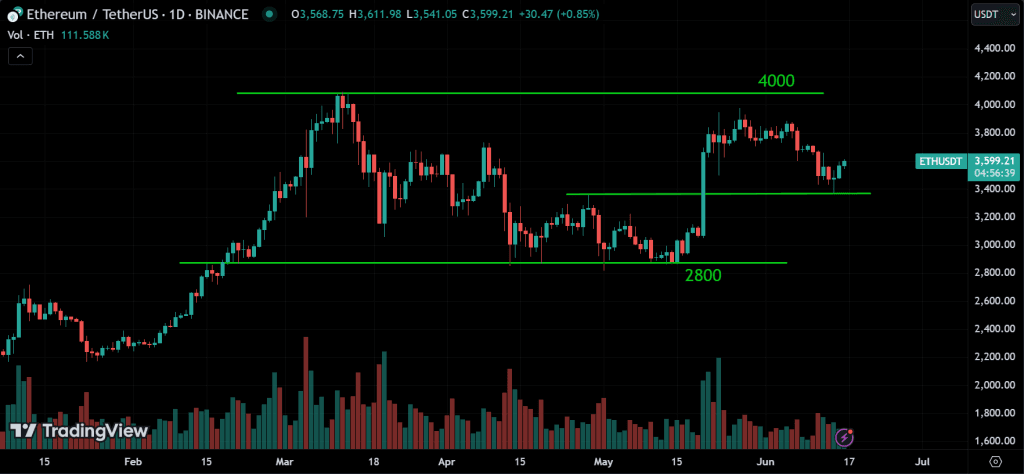
After examining ETH, after approaching the 4000 resistance level, the price was retraced, and support was found at around 3400. Now, it’s attempting to rebound from that support level. We anticipate the price to either continue rising from here or potentially decline if it breaks below this support, heading towards the 2800 level. Keep an eye out for any breakout movements.
BNB:
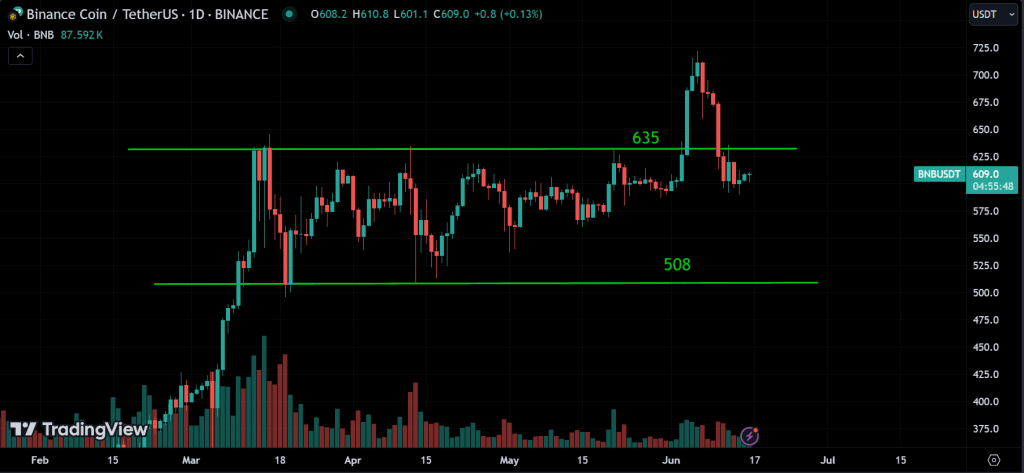
Examining BNB, it surpassed a resistance level and traded above it for several days but has since retreated back below that resistance. Currently, the price is nearing that level again. We anticipate the price to either resume its upward movement from here or potentially correct towards the support around 508. Keep an eye out for any breakout movements.
Conclusion & Disclaimer
Please provide your feedback in the comment section below on how we can further improve our market analysis. Leave feedbacks. Thank you.
It’s crucial to acknowledge the inherent unpredictability of financial markets. While we strive to offer informed perspectives on upcoming events and trends affecting various instruments, it’s important for readers to conduct their own analysis and exercise prudent judgment.
Encouragement of Independent Analysis
We strongly encourage readers to supplement the information presented here with their own research and analysis. Market dynamics can swiftly change due to a multitude of factors, and individual circumstances may vary. By conducting independent analysis, readers can tailor their strategies to align with their unique goals and risk tolerance.
No Certainty in Market Predictions
It’s vital to recognize that nobody possesses the ability to predict market movements with absolute certainty consistently. Market analysis serves as a tool to assess probabilities and identify potential opportunities, but it’s essential to remain cognizant of the inherent uncertainty in financial markets.
Aligning with High Probability
Rather than aiming for infallible predictions, our goal is to align with high-probability scenarios based on available information and analysis. This approach acknowledges the dynamic nature of markets while seeking to capitalize on opportunities with favorable risk-reward profiles.
Proceed with Caution
Lastly, while market analysis can offer valuable insights, it’s imperative to approach trading and investment decisions with caution. Markets can be volatile, and unforeseen events may impact asset prices unexpectedly. Exercise prudent risk management and consider seeking advice from qualified financial professionals before making any significant financial decisions.
Remember, the journey of financial analysis and investment is a continuous learning process, and embracing a disciplined approach can contribute to long-term success in navigating the complexities of global markets.


