
![Weekly Market Analysis [2024.07.14] ForexCracked.com](https://www.forexcracked.com/wp-content/uploads/2024/07/Weekly-Market-Analysis-2024.07.14-ForexCracked.com_.jpg)

Welcome to our weekly market analysis from forexcracked.com!
Here, we cover the major forex pairs, important commodities like gold, silver, and oil, and major cryptocurrencies like BTC and ETH.
This analysis focuses mainly on price action trading.
Before we continue with the analysis, if you don’t know much about trading, charts, candlesticks, risk management, or strategies, or if you want to improve your knowledge, consider reading our free forex course.
Upcoming Events for This Week
These events include macroeconomic reports, economic indicators, and, generally, what’s going on in the world.
Only the most important events are considered here. You can check the forexfactory.com for all the economic events and yahoo finance for news.
15/7/2024
12:00 ET: Fed Chair Powell Speaks. As the head of the central bank, which sets short-term interest rates, he has the most influence on the nation’s currency value. This event will impact USD pairs.
16/7/2024
8:30 ET: Canada releases its CPI data, an important measure of inflation. This will cause volatility in CAD pairs.
At the same time, the US is releasing its Retail Sales Report, which shows the change in the total value of sales at the retail level. This report will impact USD pairs.
18:45 ET: New Zealand releases its CPI data, which will impact NZD pairs.
17/7/2024
2:00 ET: England releases its CPI data, which will impact GBP pairs.
21:30 ET: Australia releases its Unemployment Rate report, giving an idea about the current state of their economy. This will impact AUD pairs.
18/7/2024
2:00 ET: England releases its unemployment claims report, which may cause volatility in GBP pairs.
8:15 ET: The Eurozone releases its Monetary Policy Statement, which will cause volatility in EUR pairs.
19/7/2024
2:00 ET: England releases its Retail Sales report, which may cause volatility in GBP pairs.
8:30 ET: Canada releases its Retail Sales report, which may cause some volatility in CAD pairs.
Forex Market Analysis
EURUSD:
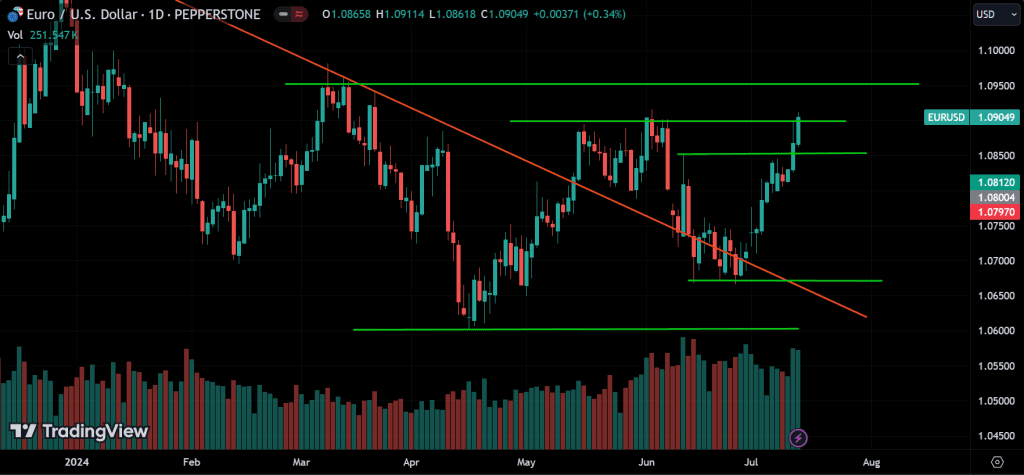
Looking at EURUSD, it’s trending up and currently at a resistance level of 1.09000, with the next resistance around 1.09500.
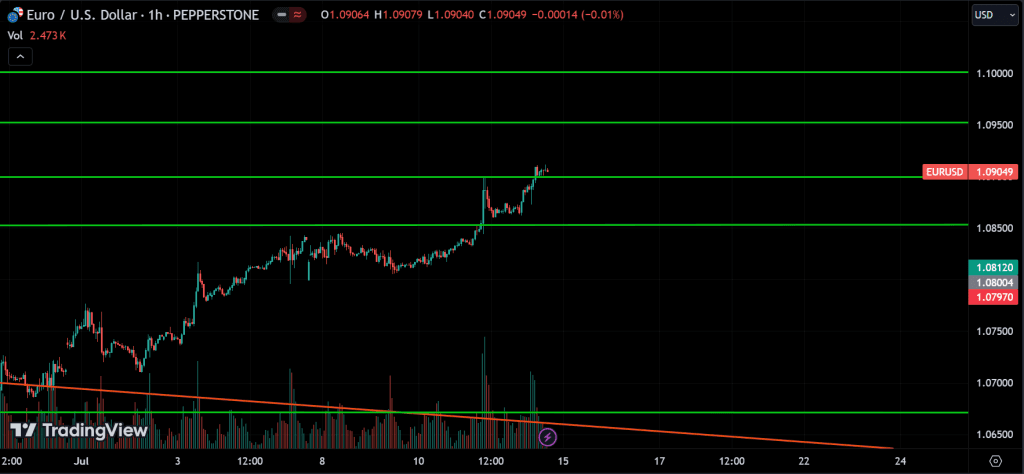
Looking at the 1-hour chart, you can see the price trading just above the resistance at 1.09000. If the uptrend continues, we can expect this momentum to keep going. We might see a pullback around 1.09500, but if that level is also broken, the price could head to the next resistance around 1.10000.
USDJPY:
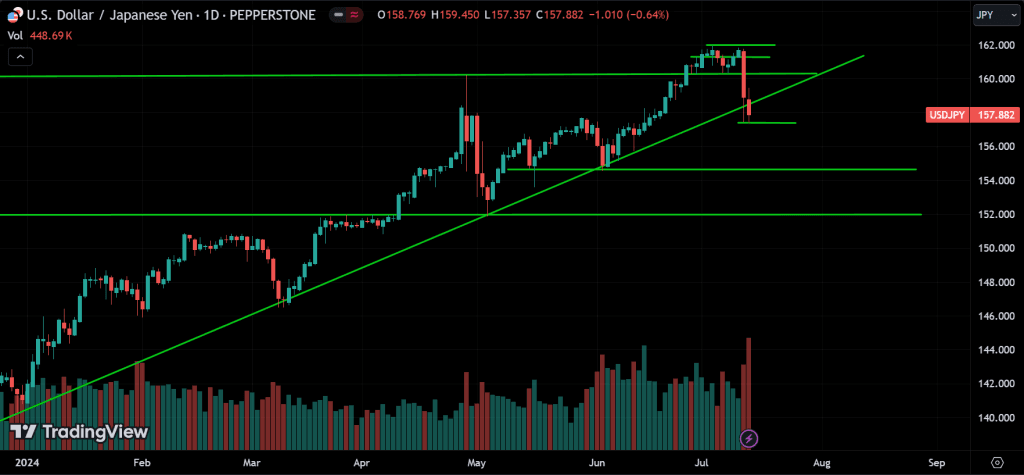
Looking at USDJPY, it was trending up, but now it seems to have broken the major support level. We can expect a new trend to form.
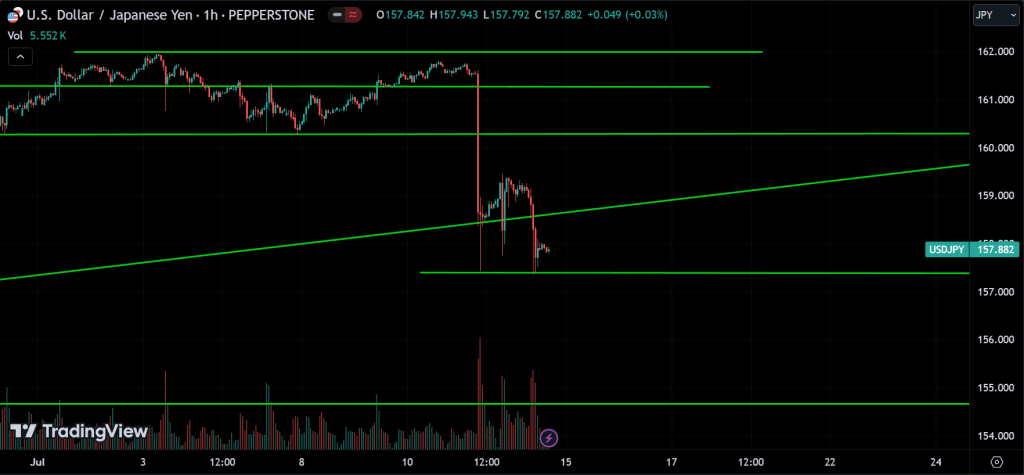
Looking at the 1-hour chart, the price pulled back from a support level at 157, went up, and is now back at that level, consolidating. If the price breaks below this support, we can expect it to drop to the next support level. However, the price could also rise from this support, so watch for both reversal and breakout signals. The trend is more likely to be bearish.
GBPUSD:
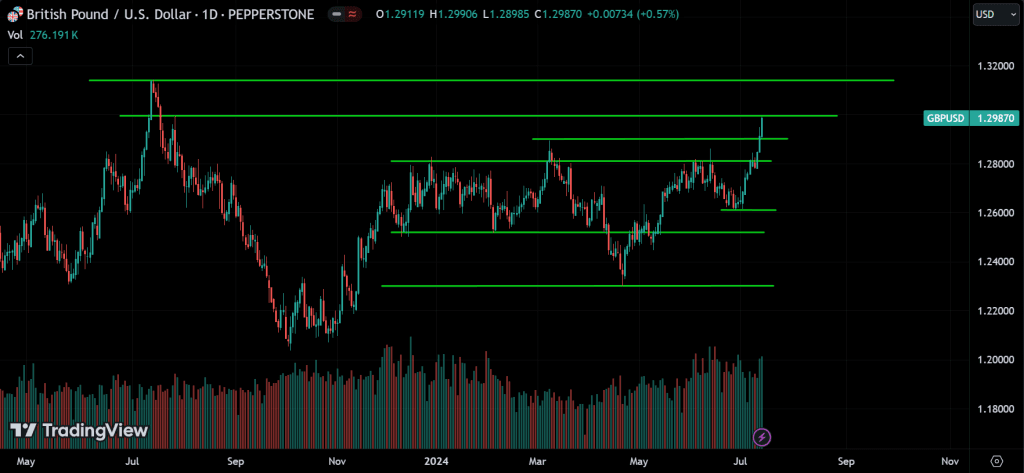
Looking at GBPUSD, it’s trending up, and the price is currently at resistance level 1.30000, with the next resistance around 1.32000.
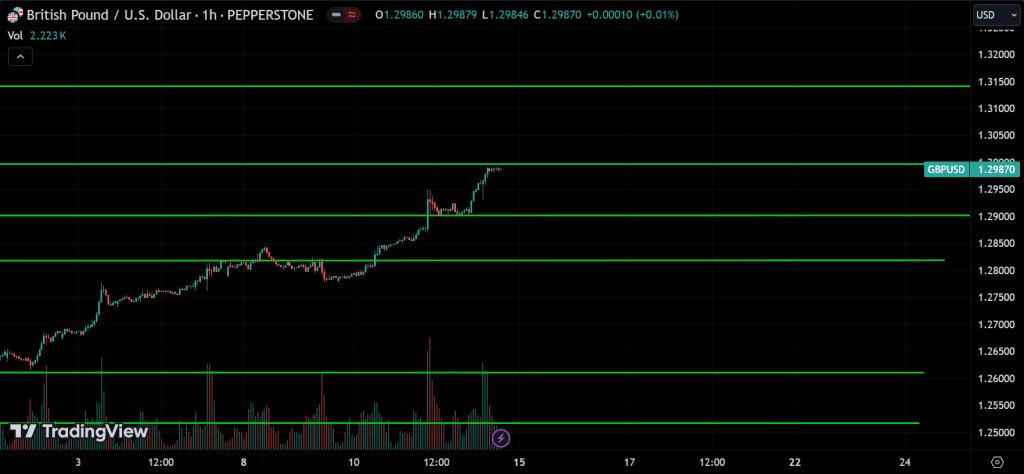
Looking at the 1-hour chart, you can see the price trading just below the 1.30000 resistance. If the price breaks above this level, it could continue up to the next resistance level. However, the price might also pull back from this level, so watch for both reversal and breakout signals.
USDCHF:
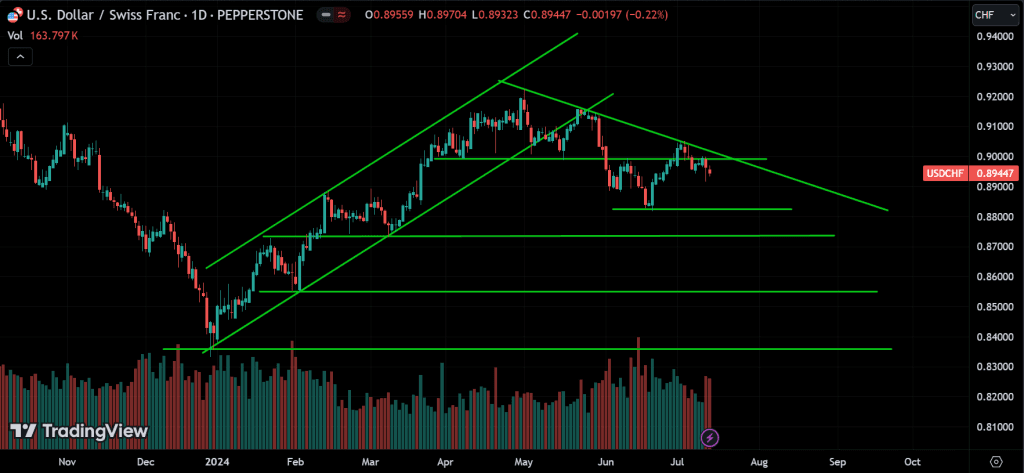
Looking at USDCHF, it’s trending down and is currently pulling back from resistance at 0.91000.
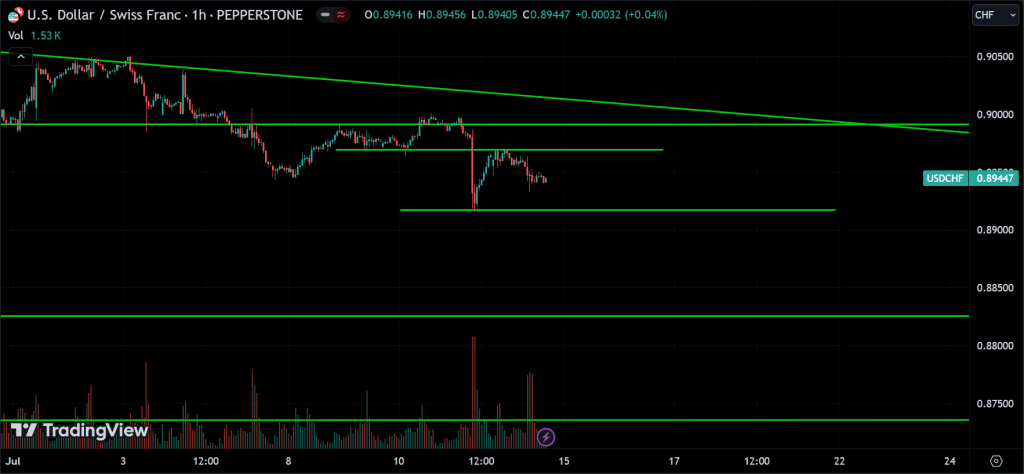
Looking at the 1-hour chart, the price is trading between a support and resistance line. The trend direction will be determined once the price breaks one of these levels. Since the overall trend is down, the price is more likely to break below the support. Wait for the breakout to confirm the trend.
USDCAD:
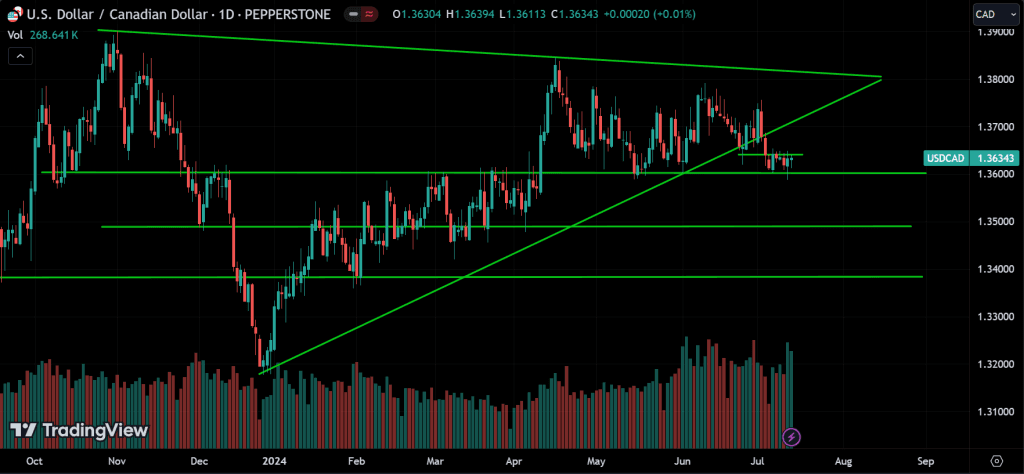
Looking at USDCAD, it broke below the major support. Now, the price is in either a downward or sideways trend and is just above another support level.
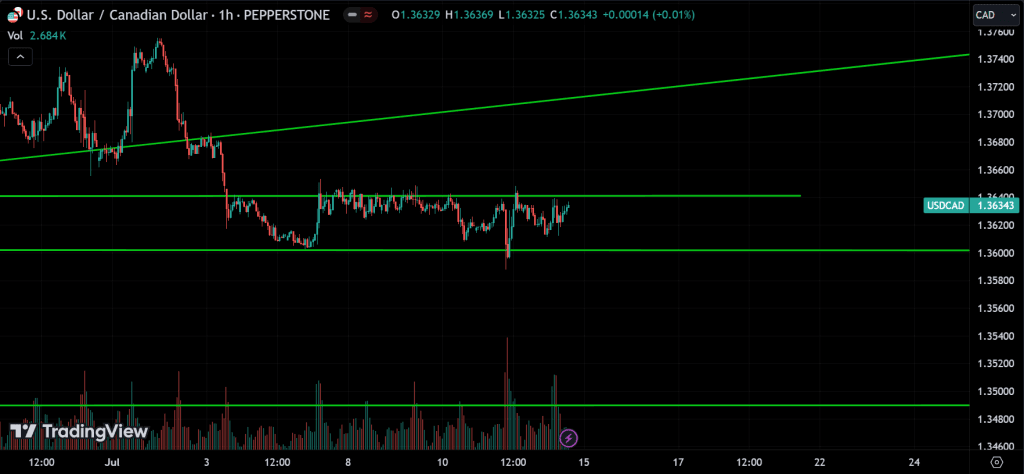
Looking at the 1-hour chart, the price is consolidating between support and resistance levels. Only a breakout will determine the future trend. Since the overall trend is bearish, the price is more likely to break support. Wait for the breakout to confirm the trend.
AUDUSD:
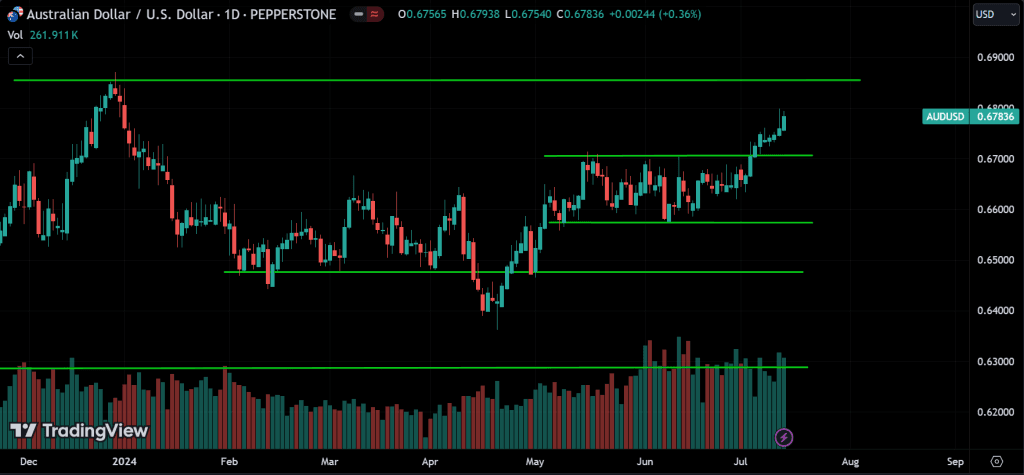
Looking at AUDUSD, it’s trending up, with the next resistance around 0.69000.
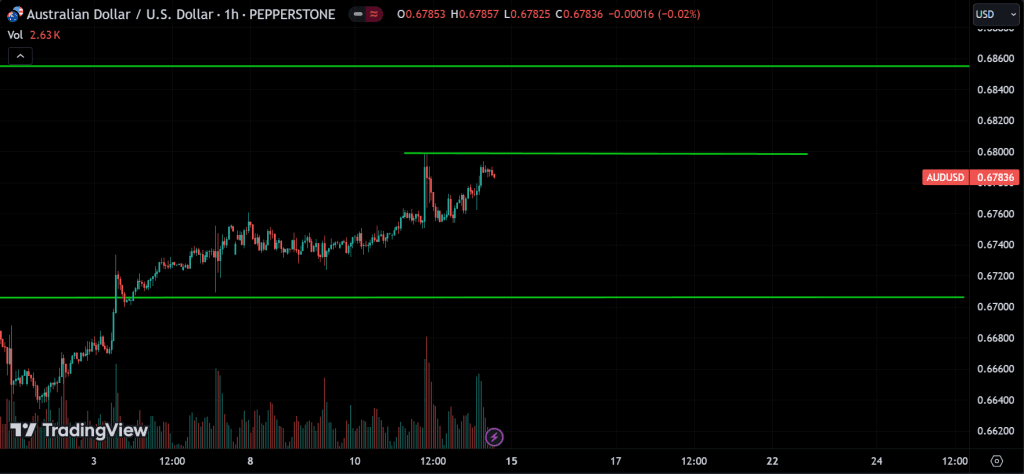
Looking at the 1-hour chart, the price is at a resistance level. It might pull back from this level, or it could break above and continue up to the next resistance. Watch for both reversal and breakout patterns.
NZDUSD:
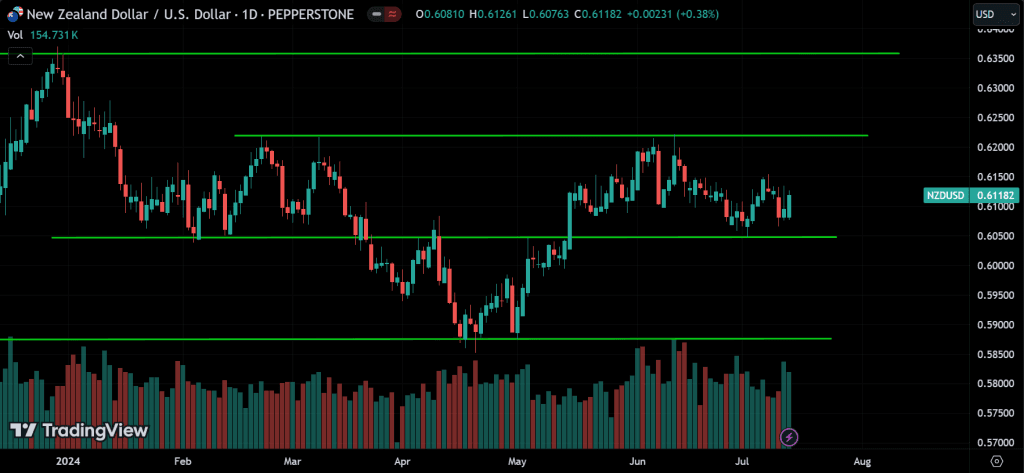
Looking at NZDUSD, the price is pulling back up from the 0.60500 level.
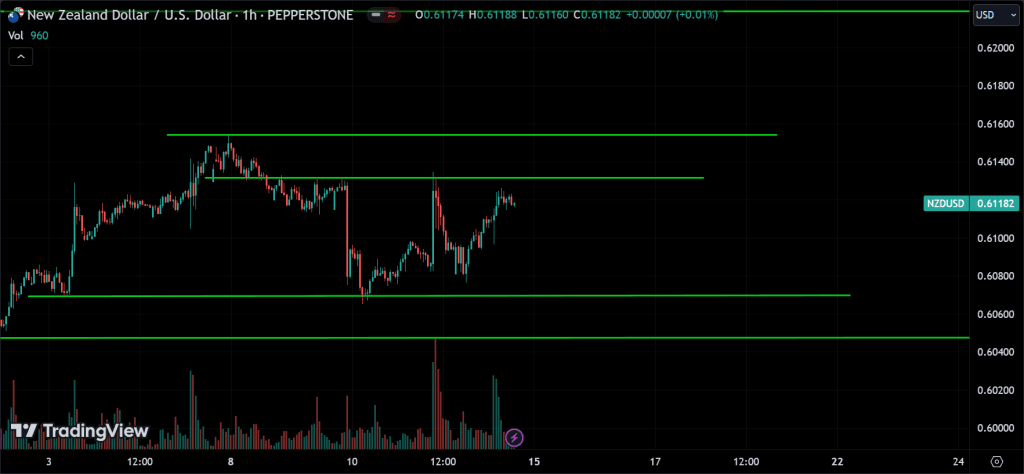
Looking at the 1-hour chart, the price is around a resistance level. We can expect a pullback here, or the price could break above this level and pull back around the next resistance. If that resistance is also broken, the price could continue to go up.
Commodities Market Analysis
GOLD:
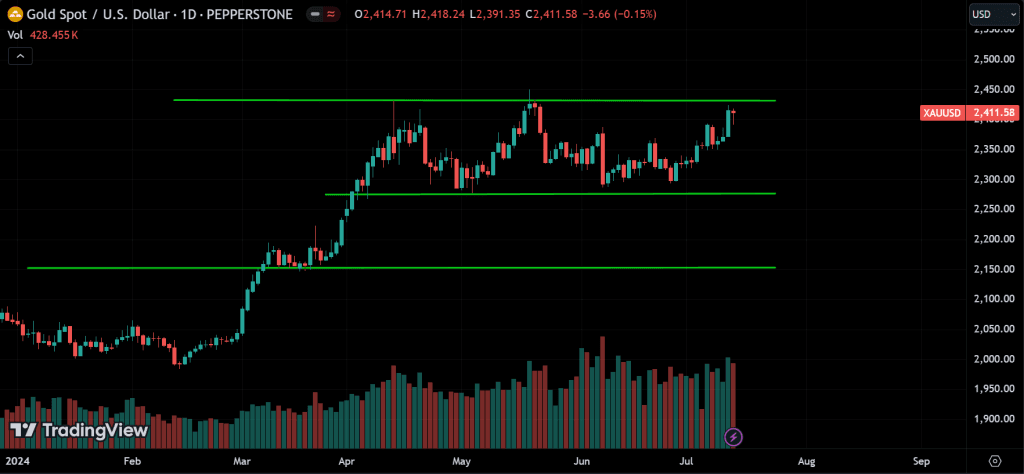
Looking at gold, it’s consolidating and the price is near a major resistance level.
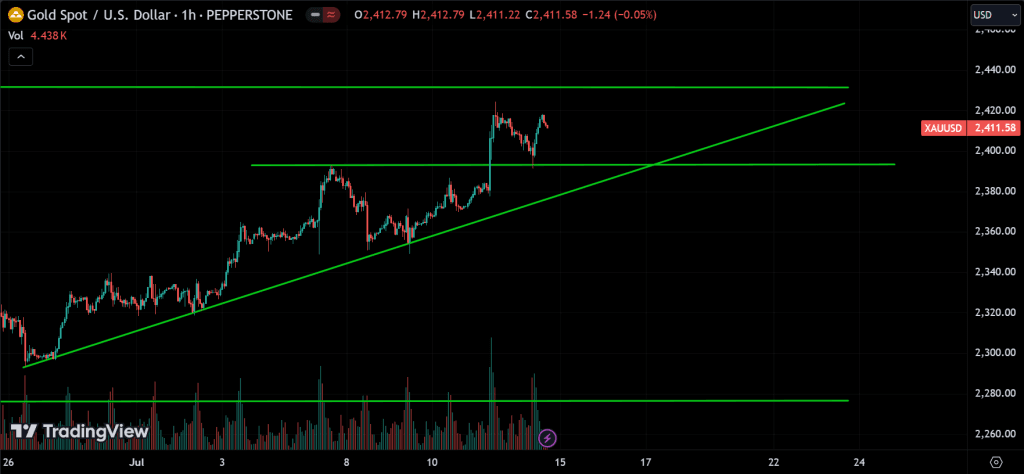
Looking at the 1-hour chart, the price is trending up and is just below the resistance. We can expect a pullback around this resistance with the price dropping, or it could break above and continue going up. Watch for both breakout and reversal patterns.
SILVER:
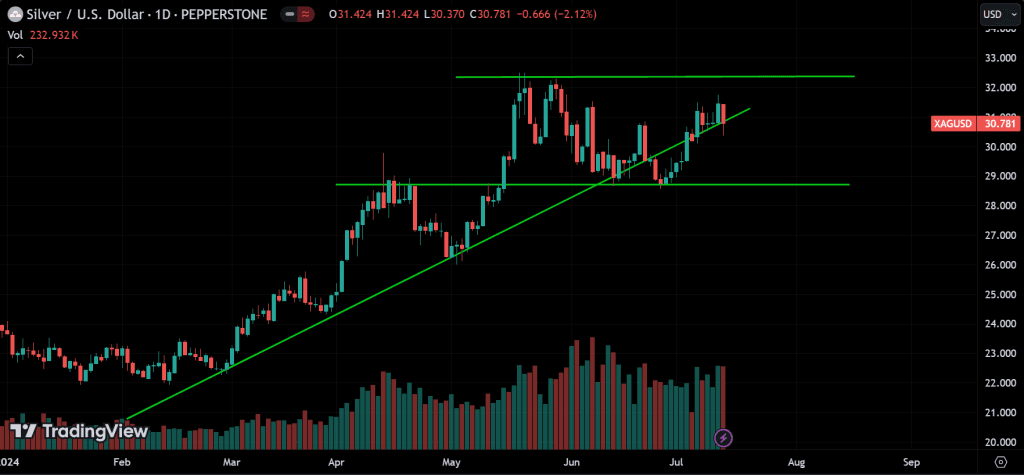
Looking at silver, it’s pulling back up from a support level and is now around a resistance level.
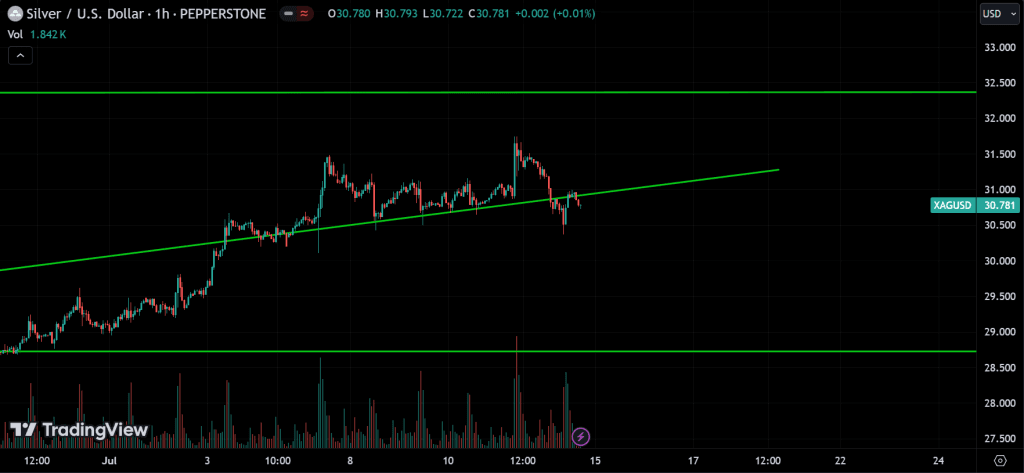
Since the price broke below the trendline, we can expect it to drop to the support level. However, it could also rise from this level. The major support is around 29.000, and the resistance is around 32.500.
CRUDE OIL:
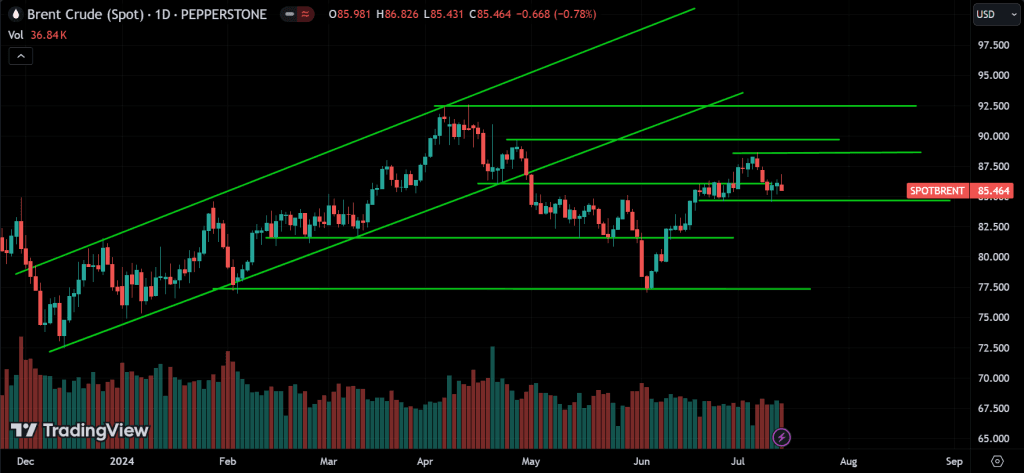
Looking at crude oil, the trend is still uncertain, but in the medium term, it was going up.
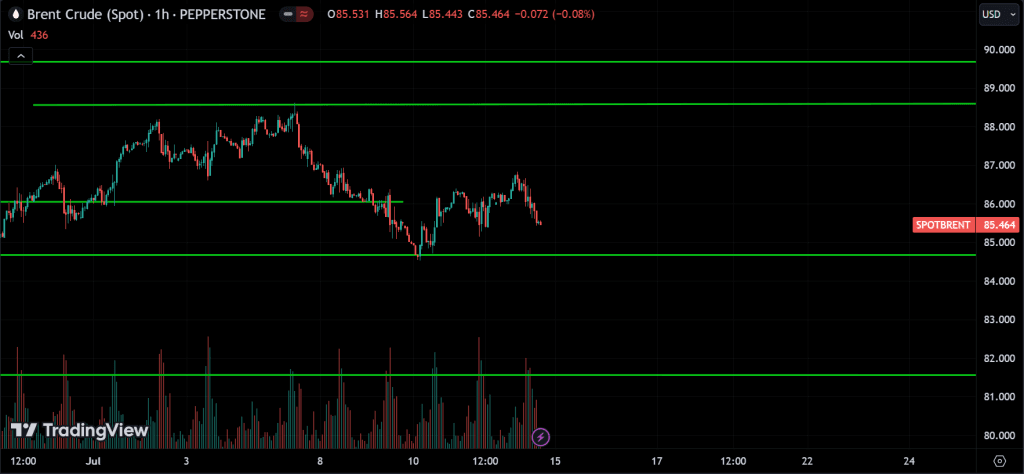
Looking at the 1-hour chart, the price is pulling back up from the support at 85. We can expect it to rise to the next resistance around 88.500, or it could break below this support and drop to the next support level. Watch for both breakout and reversal signals.
Cryptocurrency Market Analysis
BTC:
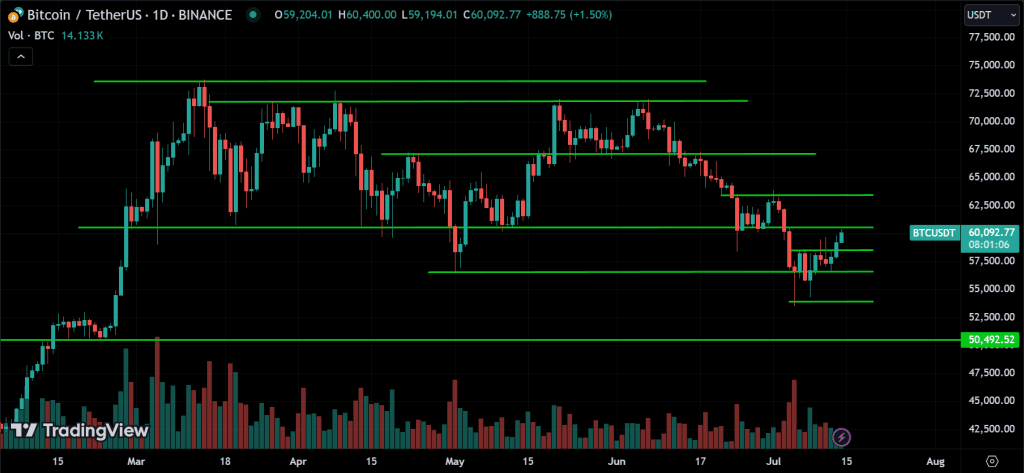
Looking at BTC, it’s trending down, and it recently pulled back from support at 54000.
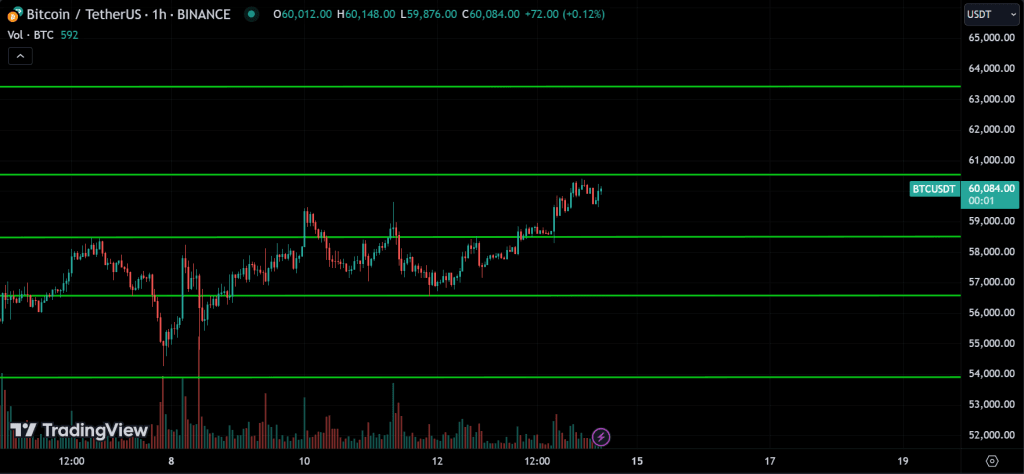
Looking at the 1-hour chart, the price is at a resistance level. If it breaks above this level, we can expect it to continue up to the next resistance level. However, the price could also drop from this level and break below the support, causing it to start falling. Watch for breakouts.
ETH:
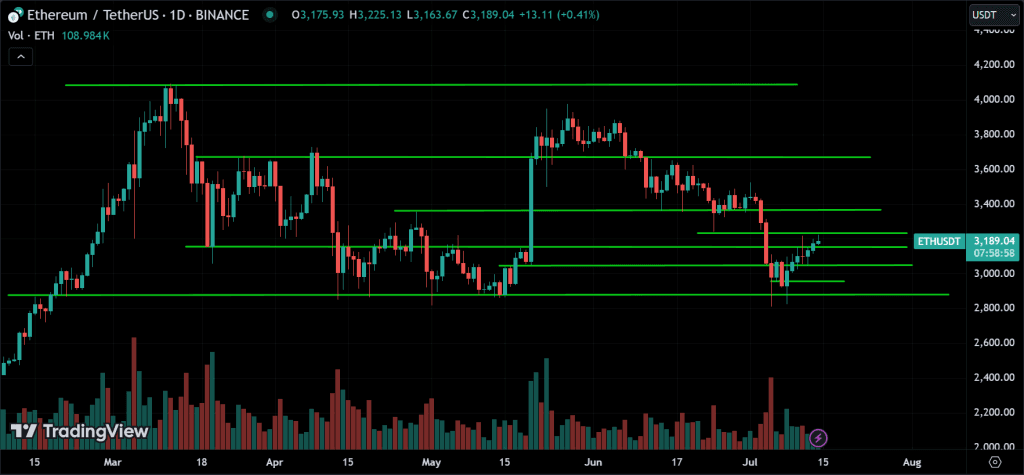
Looking at ETH, it’s trending down and recently pulled back from the major support level around 2800.
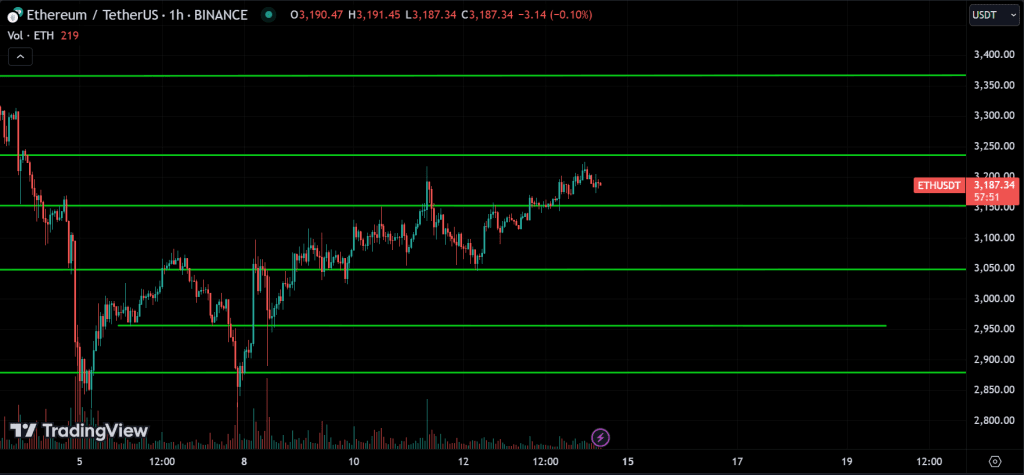
Looking at the 1-hour chart, the price is trending up in the medium term and is currently at a resistance level. It might pull back from this level and start dropping, or it could break above the resistance and continue going up. Watch for breakouts.
BNB:
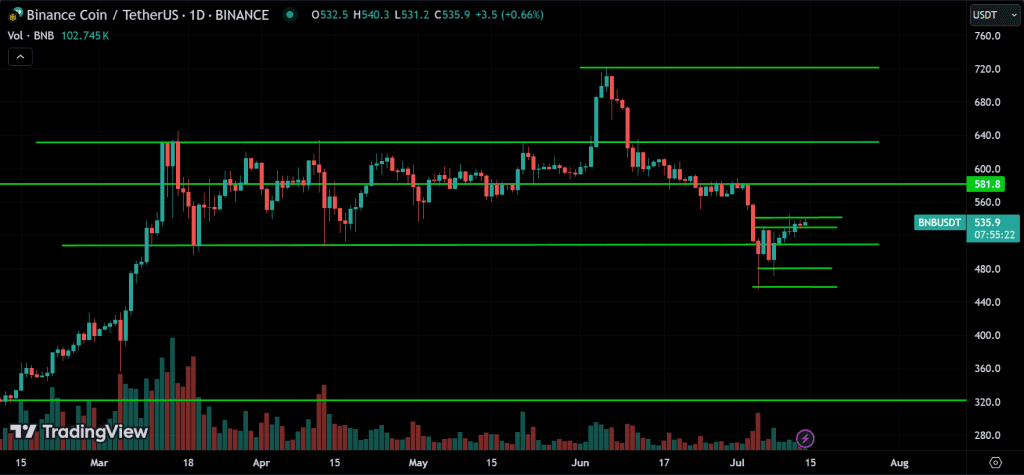
Looking at BNB, it’s trending down and recently pulled back from the 440 support level.
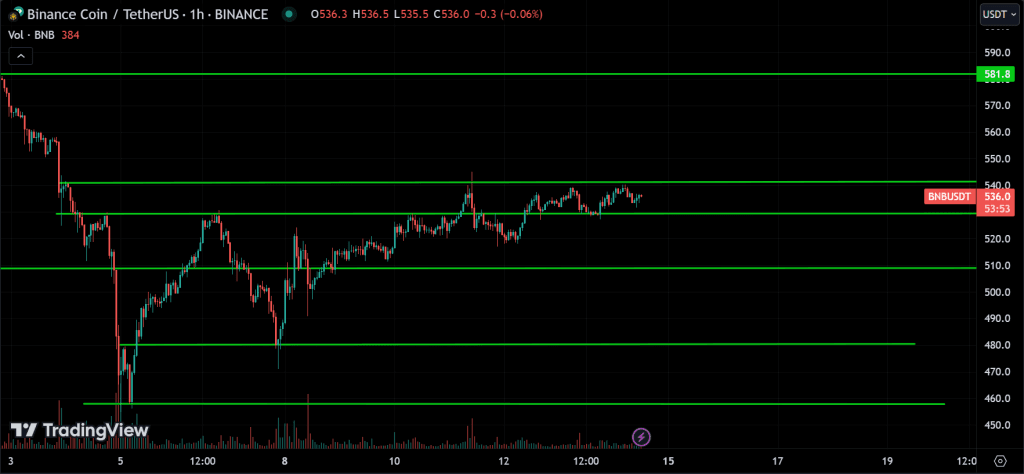
Looking at the 1-hour chart, the price is consolidating around the 540 resistance. A breakout will determine the future trend, so wait for the breakout to confirm it. The price will continue in the direction of the breakout.
Conclusion & Disclaimer
This analysis article isn’t about telling you when to buy or sell. It’s about teaching you how to approach the market effectively. Every day, I follow the same routine before I start trading. Here, I briefly explained the technical aspects of what’s happening and what actions I take in these situations. Your goal is to understand what I do so you can follow the same process on your own.
The market can change its behavior without notice, so it’s best to analyze it every day. The ForexCracked version covers all the important assets in detail for the week in one article. Meanwhile, the xlearn version focuses more on daily analysis for day traders. If you want to follow daily analysis for Forex, US Stocks & Cryptocurrencies, check out this section on xlearnonline.com
Please provide your feedback in the comment section below on how we can further improve our market analysis. Thank you.
Acknowledging the inherent unpredictability of financial markets is crucial. While we strive to offer informed perspectives on upcoming events and trends affecting various instruments, readers should conduct their own analysis and exercise prudent judgment.
Encouragement of Independent Analysis
We strongly encourage readers to supplement the information presented here with their own research and analysis. Market dynamics can swiftly change due to a multitude of factors, and individual circumstances may vary. By conducting independent analysis, readers can tailor their strategies to align with their unique goals and risk tolerance.
No Certainty in Market Predictions
It’s vital to recognize that nobody possesses the ability to predict market movements with absolute certainty consistently. Market analysis serves as a tool to assess probabilities and identify potential opportunities, but it’s essential to remain cognizant of the inherent uncertainty in financial markets.
Aligning with High Probability
Rather than aiming for infallible predictions, our goal is to align with high-probability scenarios based on available information and analysis. This approach acknowledges the dynamic nature of markets while seeking to capitalize on opportunities with favorable risk-reward profiles.
Proceed with Caution
Lastly, while market analysis can offer valuable insights, it’s imperative to approach trading and investment decisions with caution. Markets can be volatile, and unforeseen events may impact asset prices unexpectedly. Exercise prudent risk management and consider seeking advice from qualified financial professionals before making any significant financial decisions.
Remember, the journey of financial analysis and investment is a continuous learning process, and embracing a disciplined approach can contribute to long-term success in navigating the complexities of global markets.
THANK YOU & HAPPY TRADING FROM FOREXCRACKED!!!