


Welcome to our weekly market analysis from forexcracked.com! May is almost over, with just one week left. Let’s dive into this week’s analysis.
This analysis article isn’t about telling you when to buy or sell. It’s about teaching you how to approach the market effectively. Every day, I follow the same routine before I start trading. In this article, I’ll briefly explain the technical aspects of what’s happening and what actions I take in these situations. Your goal is to understand what I do so you can follow the same process on your own.
Upcoming Events for This Week
These events include macroeconomic reports, economic indicators, and, generally, what’s going on in the world. Only the most important ones are considered here. You can check the forexfactory.com for all the events.
20/5/2024
French, German, Swiss and Canadian Banks are closed for the holiday, so there will be less trading activity for EUR, CHF, and CAD currencies.
Members from FOMC are Talking, but other than that there is nothing much to worry about for Monday.
21/5/2024
CPI data is coming out for CAD, BOE Gov Bailey is speaking for GBP, and RBNZ is releasing its monetary policy statement for NZD. These are volatile events for the currencies.
22/5/2024
There is FOMC Meeting Minutes for USD, other than that there are no big events for the day.
23/5/2024
EUR, GBP, and USD releasing its Manufacturing and Service PMI reports, these are not volatile but still something to keep in mind. And USD also releasing the Unemployment Claims Report.
24/5/2024
GBP has Its Retail Sales Report, and USD releasing its revised UoM Consumer Sentiment Report.
Forex Pairs
EURUSD:
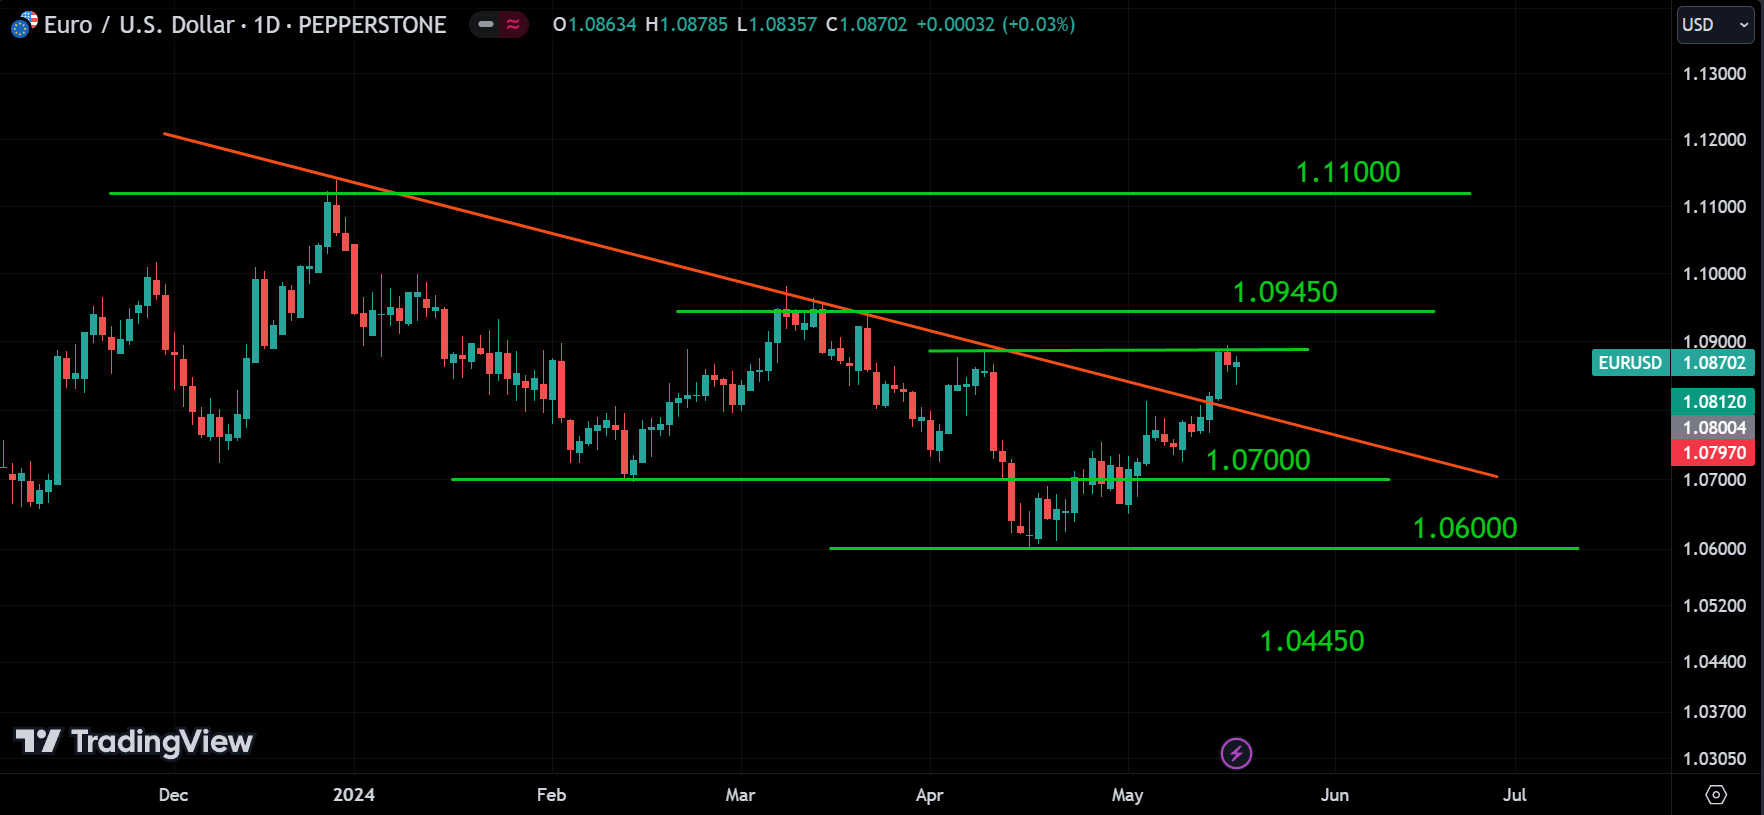
Alright, regarding EURUSD, it looks like the trend is broken, and it’s now in a bullish phase. The price is currently at a resistance level, and it might be correcting before going back up. We can expect it to return to the red line before continuing its rise. The strongest resistance for the price is around the 1.09450 range. If it breaks this level, it could keep going up to 1.11000. But keep in mind, that if the price falls back inside the red line, something might be wrong, and you should wait to confirm the trend.
USDJPY:
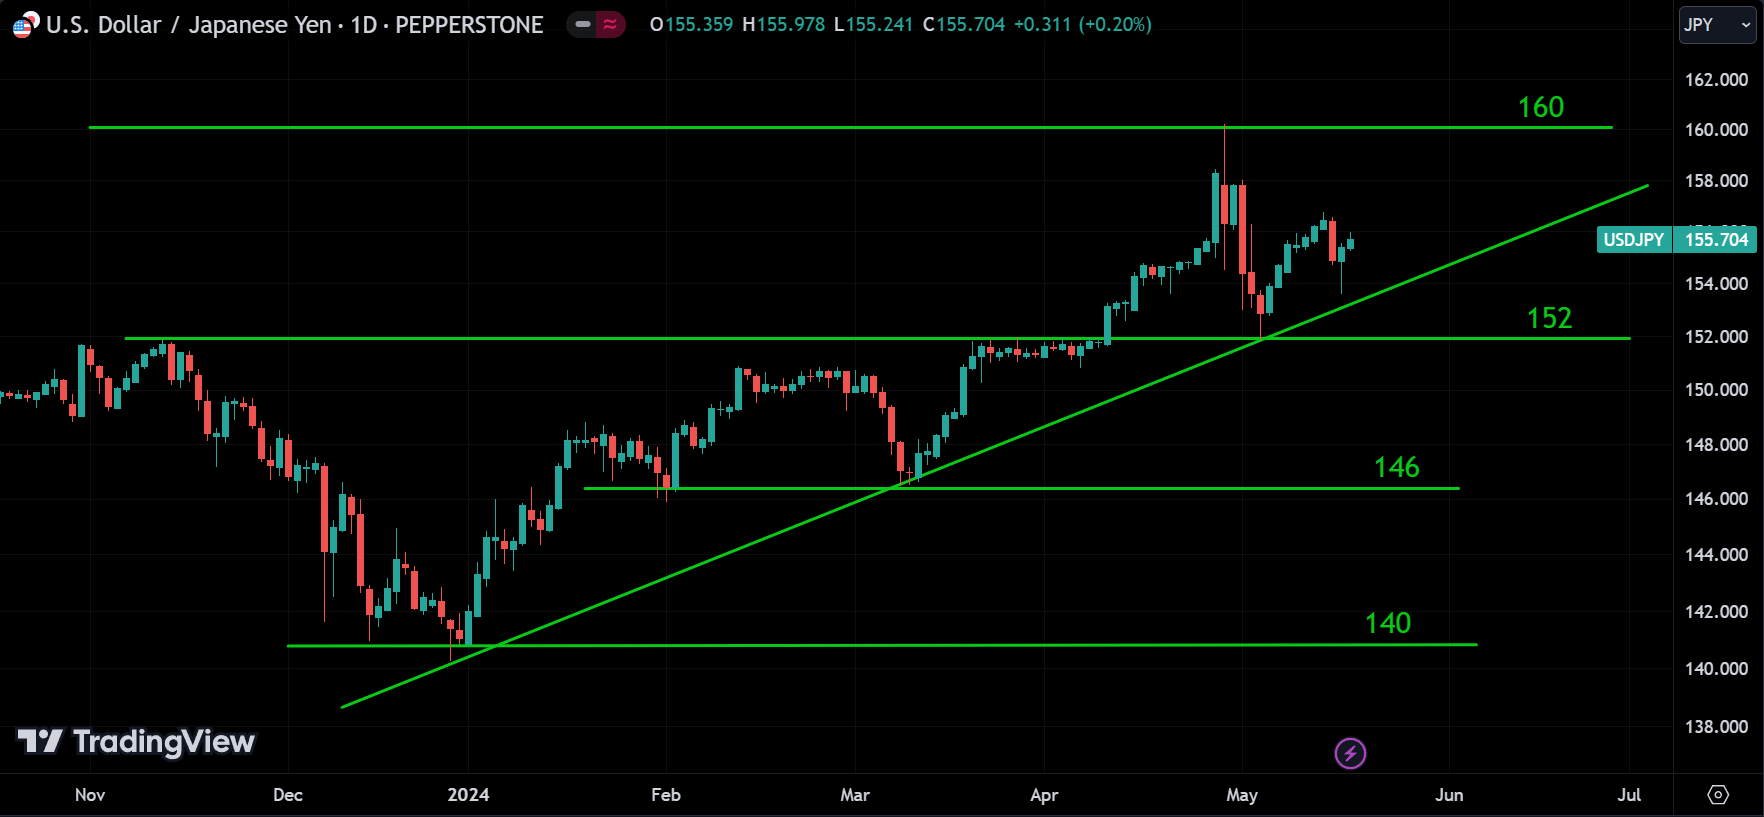
It’s clear as day: the trend is bullish and it’s heading for the 160 level. There may be corrections along the way, but as we said in the previous article, keep an eye on the 152 level. If it breaks, the trend might be changing. Otherwise, the overall trend for USDJPY is bullish.
GBPUSD:
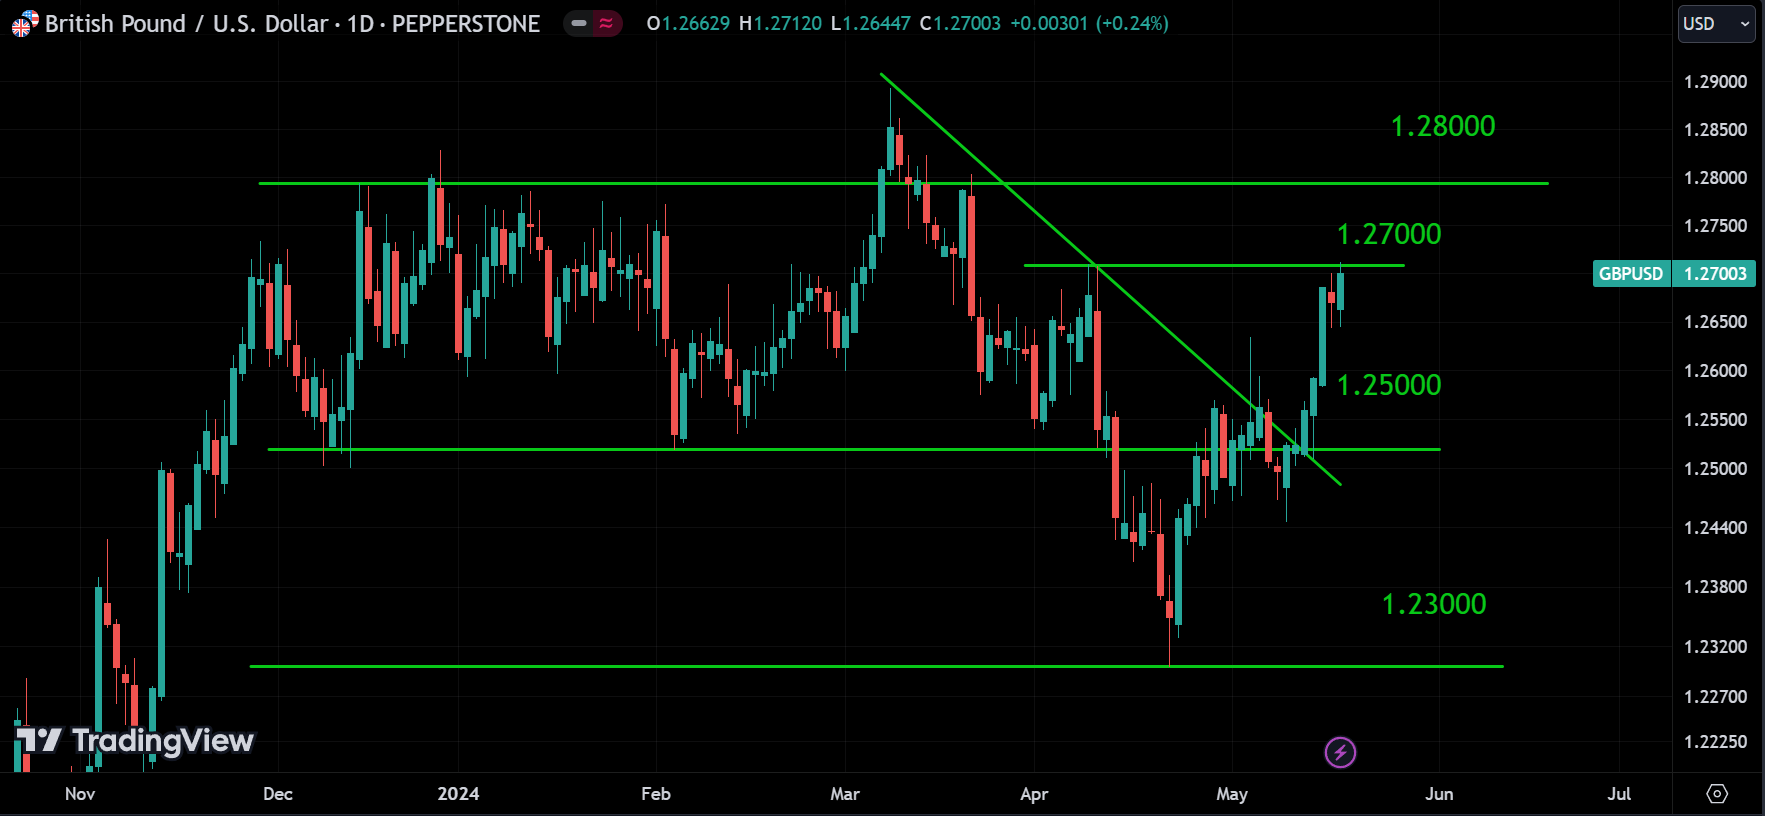
In the last article, I mentioned that GBPUSD was likely to fall, but I also said to wait for confirmation. This is why you should wait—it went the other way from what we expected. Right now, it’s around the 1.27000 level, which is a resistance level. If the price breaks above this level, we might see GBPUSD rise to 1.28000 or higher. However, there might be a correction from this level, but it shouldn’t fall below 1.25000. Keep all this in mind before trading GBPUSD.
USDCHF:
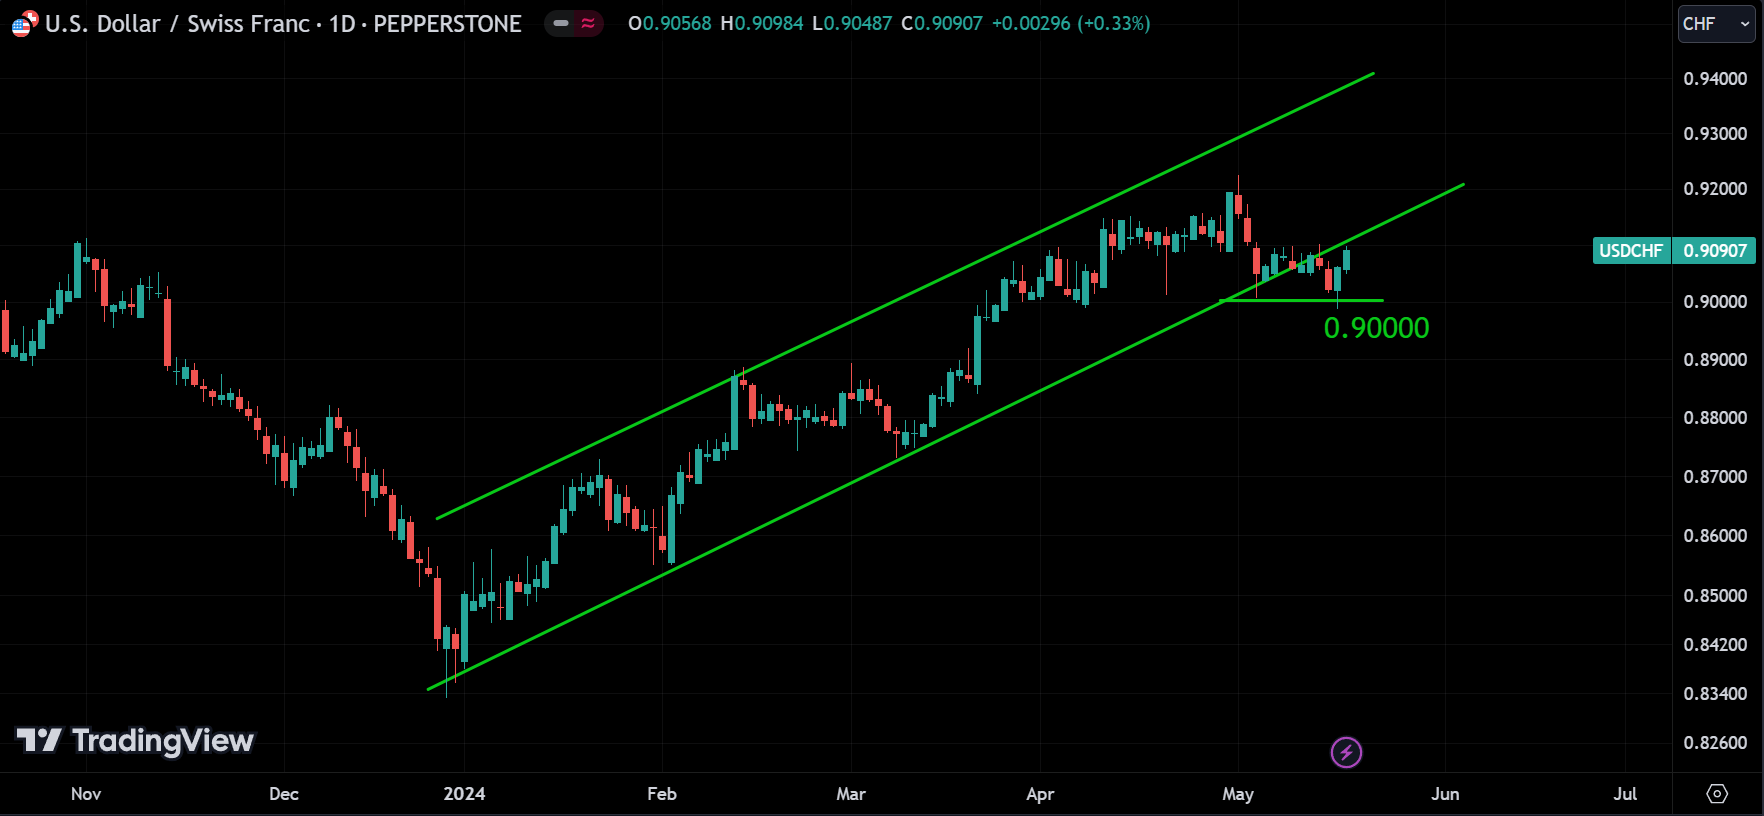
USDCHF seems to be out of the channel, so it might be in a bearish phase. Like I said in the previous article, wait for the 0.90000 level to be fully broken to confirm a bearish trend. However, I’m leaning more towards a bearish outlook for USDCHF. Two things can happen now: if USDCHF gets back in the channel, it’s still in a bullish phase. But if it continues to trade near the lower trend line of the channel and then retraces, we can expect it to fall, confirming the bearish phase. So, wait for the breakout before taking a position.
There is a chance it can go side-way trend, I’ll explain why in the next article after seeing what unfolds.
USDCAD:
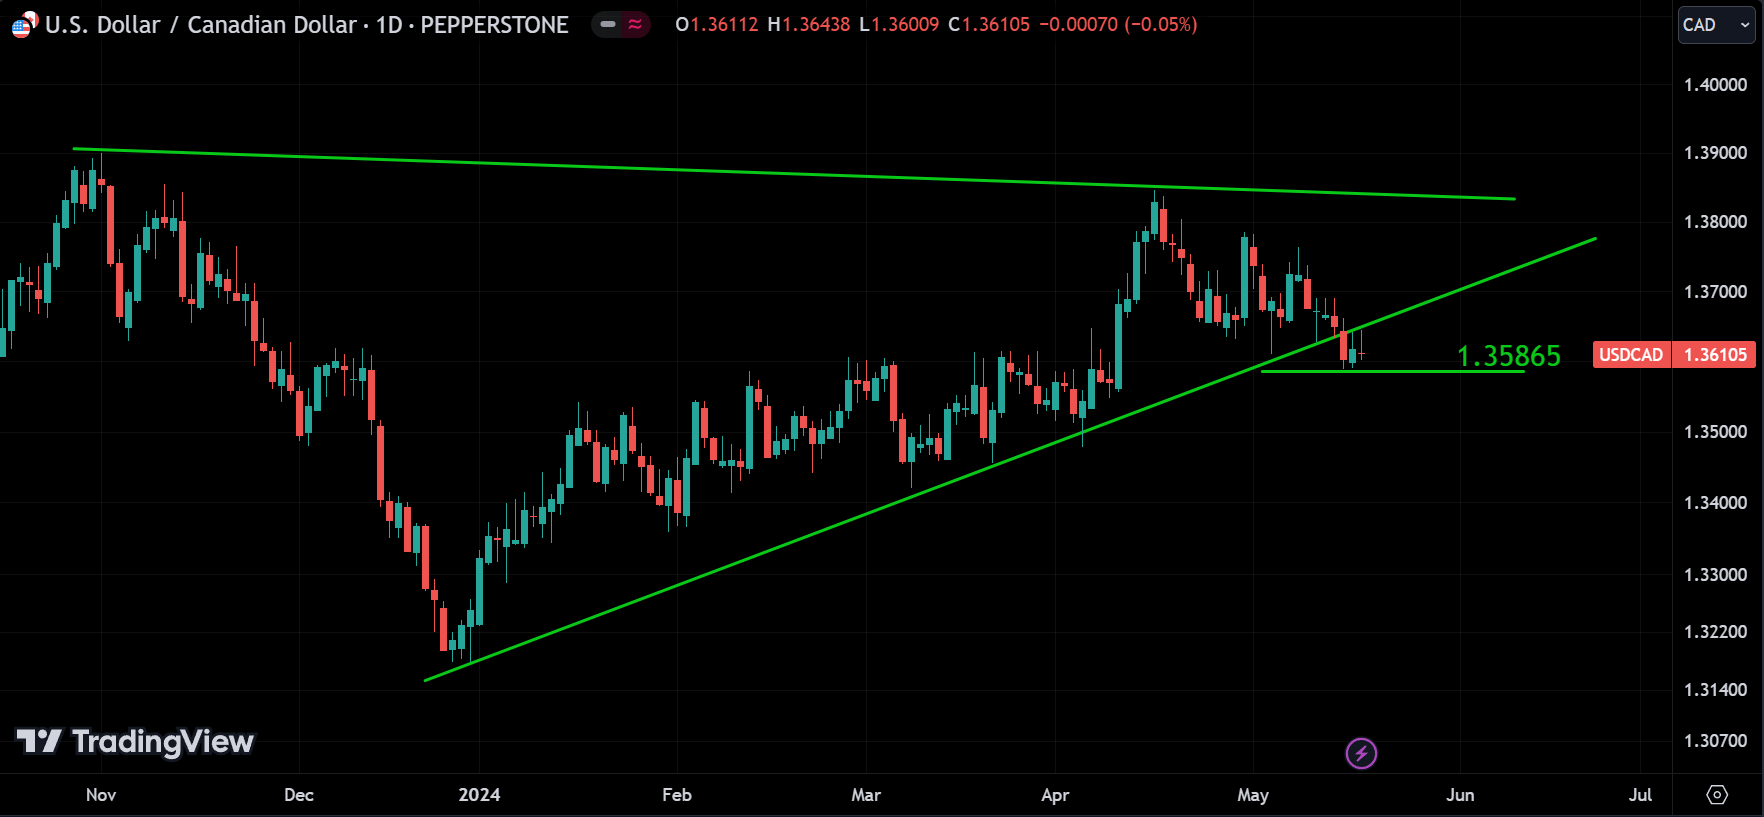
It looks like the lower trend line is broken, so it should be in a bearish phase now. To be sure, wait for the 1.35865 level to be broken. If it breaks, it confirms that USDCAD is in a downtrend. However, it could bounce back up from the 1.35865 level into the triangle. That’s why you should wait for confirmation before taking a position.
AUDUSD:
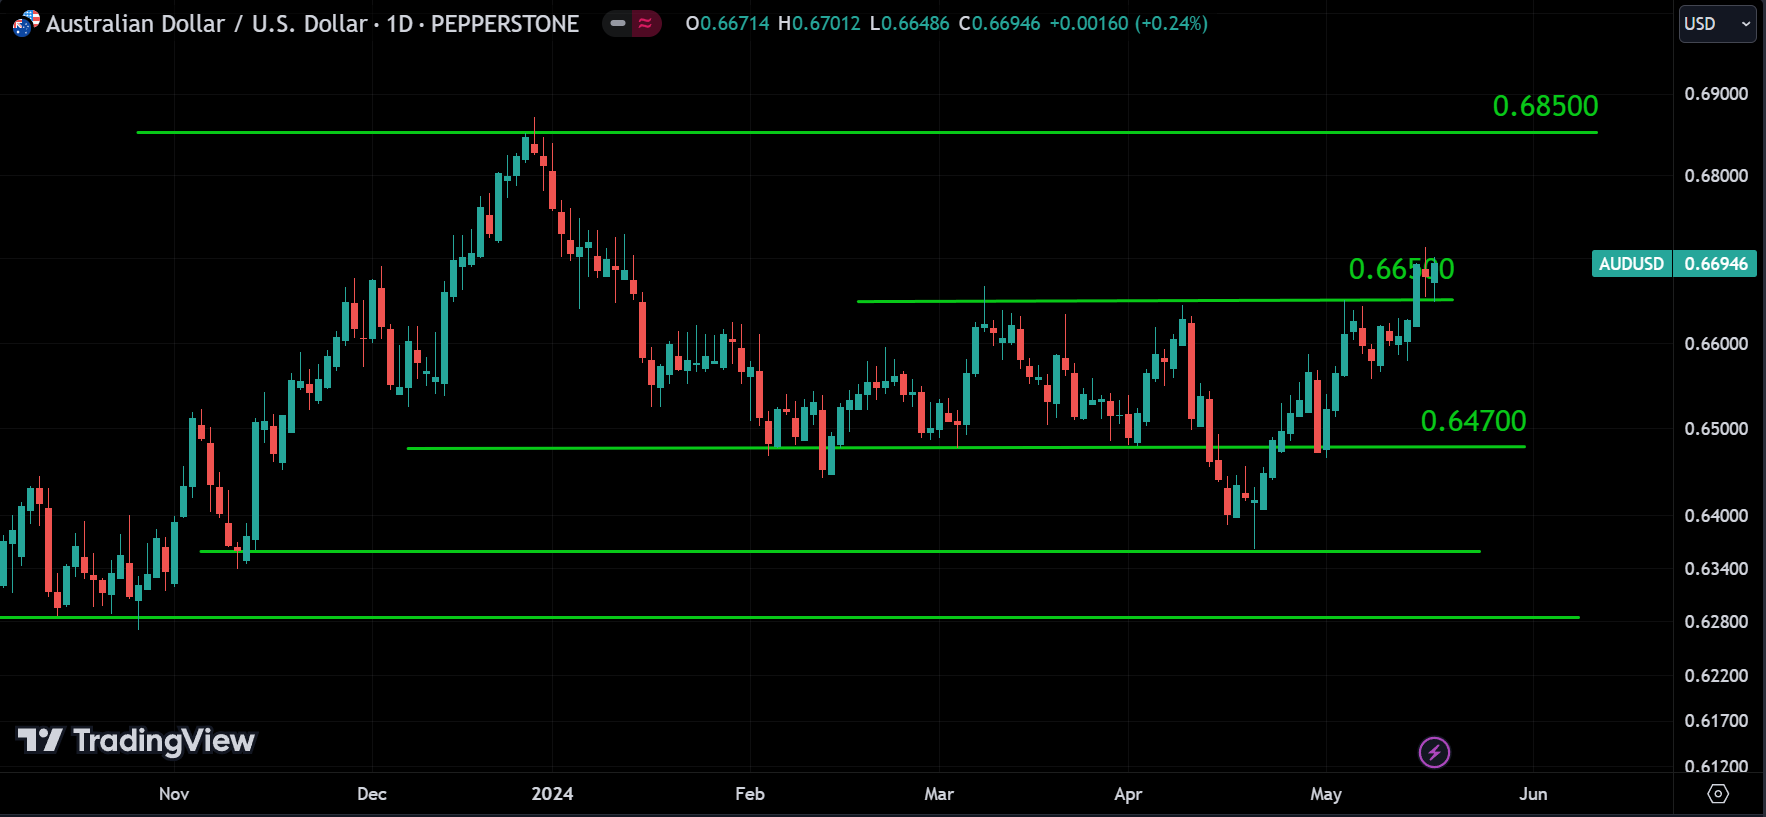
Even the 0.66500 level couldn’t stop AUDUSD, which shows a strong bullish signal. We can expect the price to keep rising to the 0.68500 level. There may be corrections along the way, but the overall trend is bullish. The strongest support level is 0.66500, and the strongest resistance level is 0.68500.
NZDUSD:
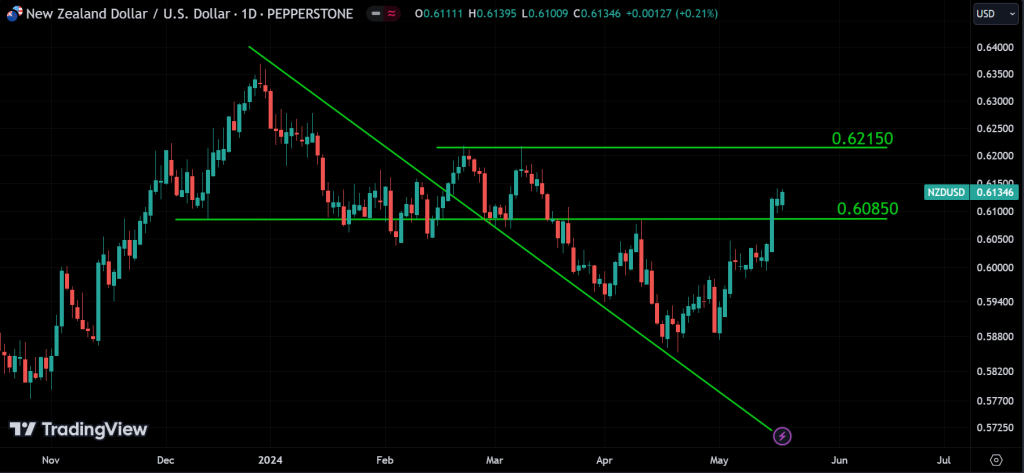
It looks like NZDUSD is going up. The strongest resistance level for the price is around 0.62150, and the price should reach this level without any problems. The support level for the price is 0.60850. Keep an eye on both of these levels. Overall, the trend for NZDUSD is bullish.
Commodities
GOLD:
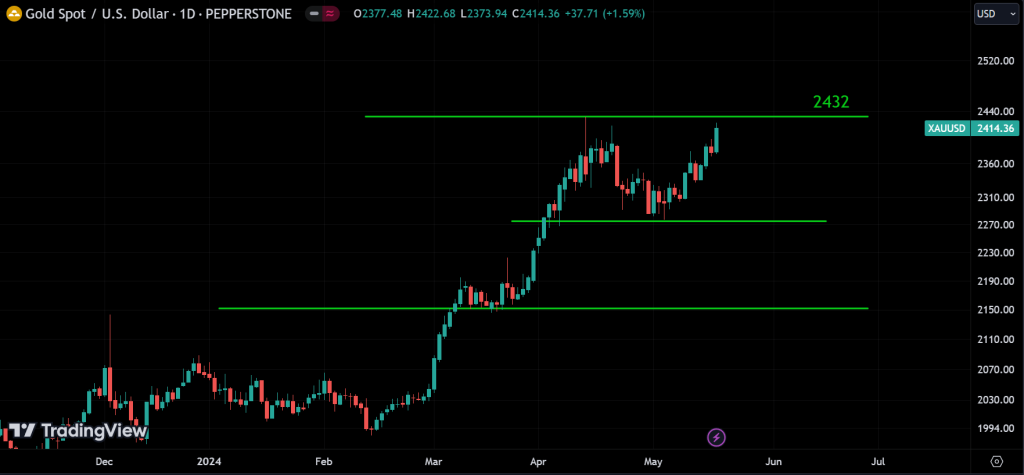
Gold is shining bright. It’s trading around its all-time high levels and should keep moving in that direction. If it easily surpasses the 2432 level in the coming days, it’s a strong bullish signal.
SILVER:
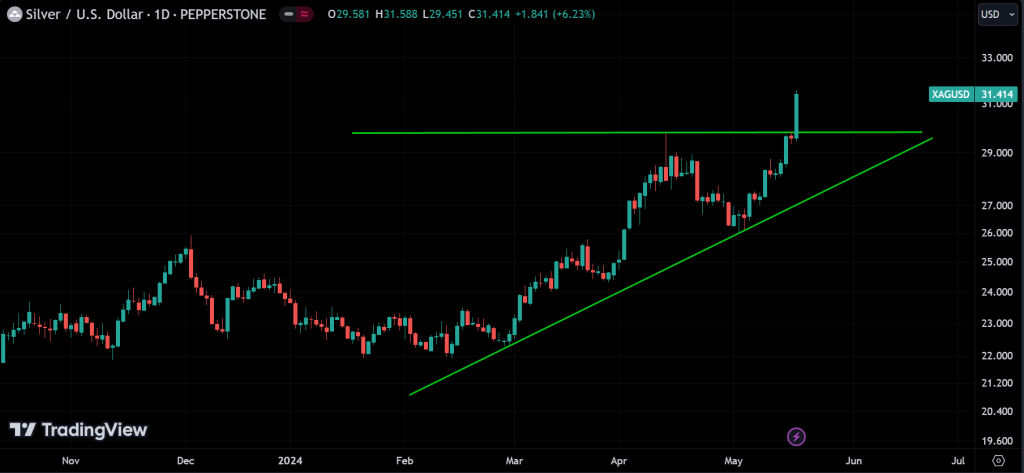
There’s not much for me to add here. It’s at its all-time high level, and like any other asset, if it reaches a new high, it should keep moving in that direction. But there will come a point where its momentum slows down, usually at a round number. So, watch out for numbers like 32, 32.5, 33, and so on—they might signal a turning point. 29.8 seems like a good support level for the price.
CRUDE OIL:
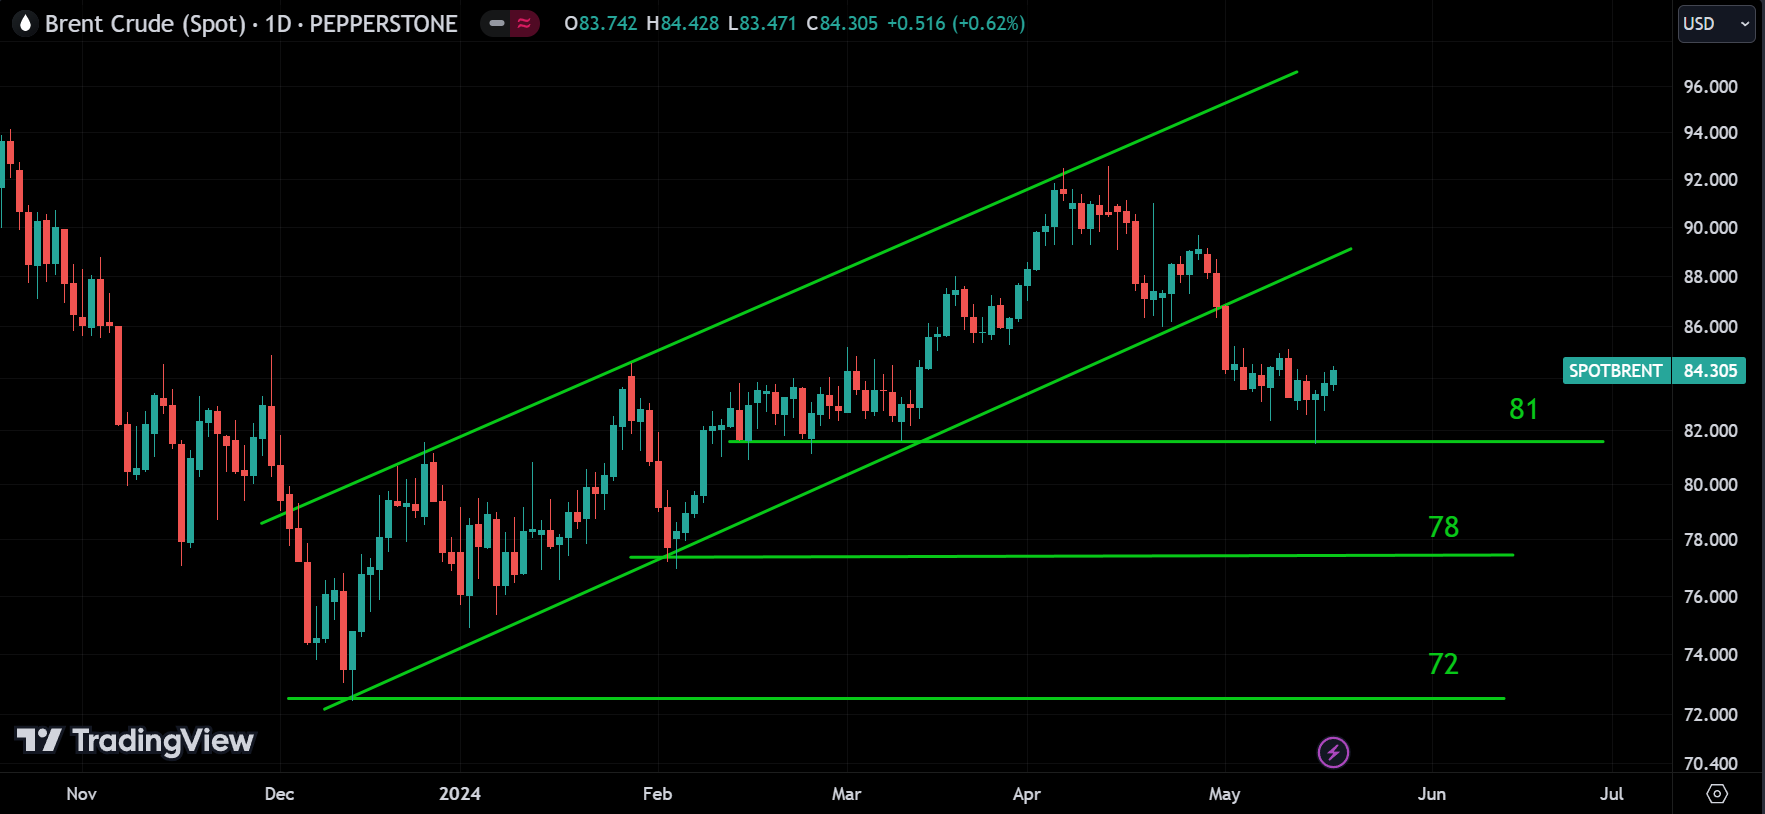
81 looks like a solid support for oil. Despite the bearish trend, it seems to be in a correction phase right now. It might rise and touch the lower trendline of the channel, then fall back down to continue its downward movement. So, keep a close watch on these lines. If the price breaks them, you’ll know what to expect next. If you’re still unsure, feel free to ask in the comment section.
Cryptocurrency
BTC:
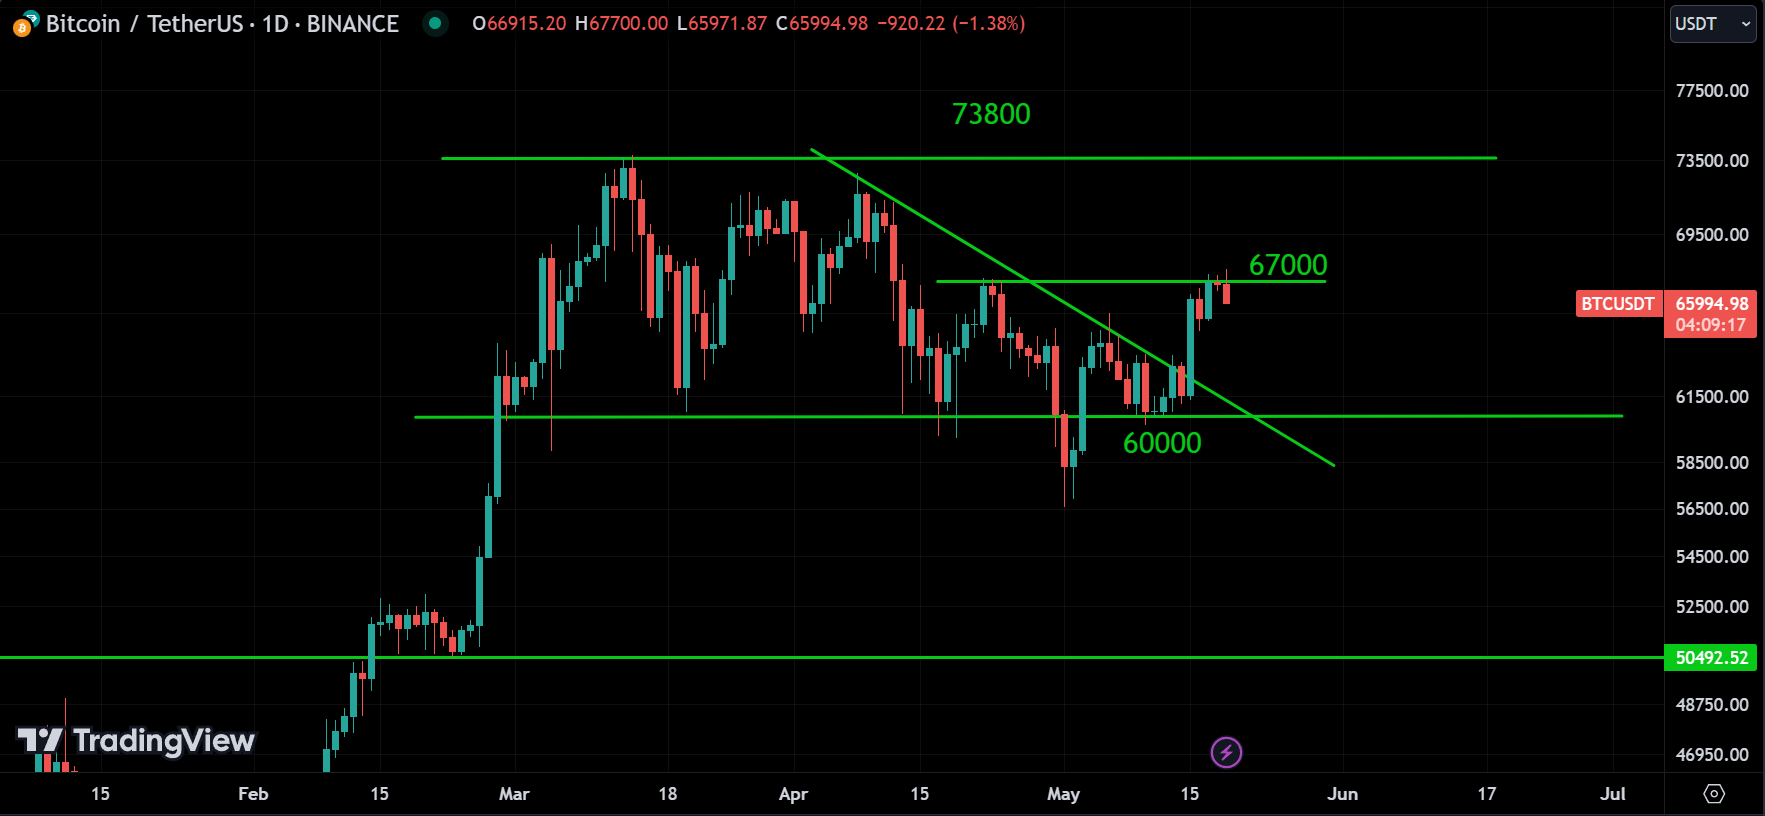
The Future of Money is holding strong above 60k. I thought it was undergoing a correction, but it seems to be moving sideways rather than correcting. Before something makes a sharp move up or down, it often consolidates or moves sideways for a while. In Bitcoin’s case, it should move up since it just reached its all-time high levels. 67000 seems to be a resistance for the price. If it breaks, we might see the price return to its all-time high level, or it could retrace from that level back to the 60k range. Let’s wait and see what happens.
ETH:
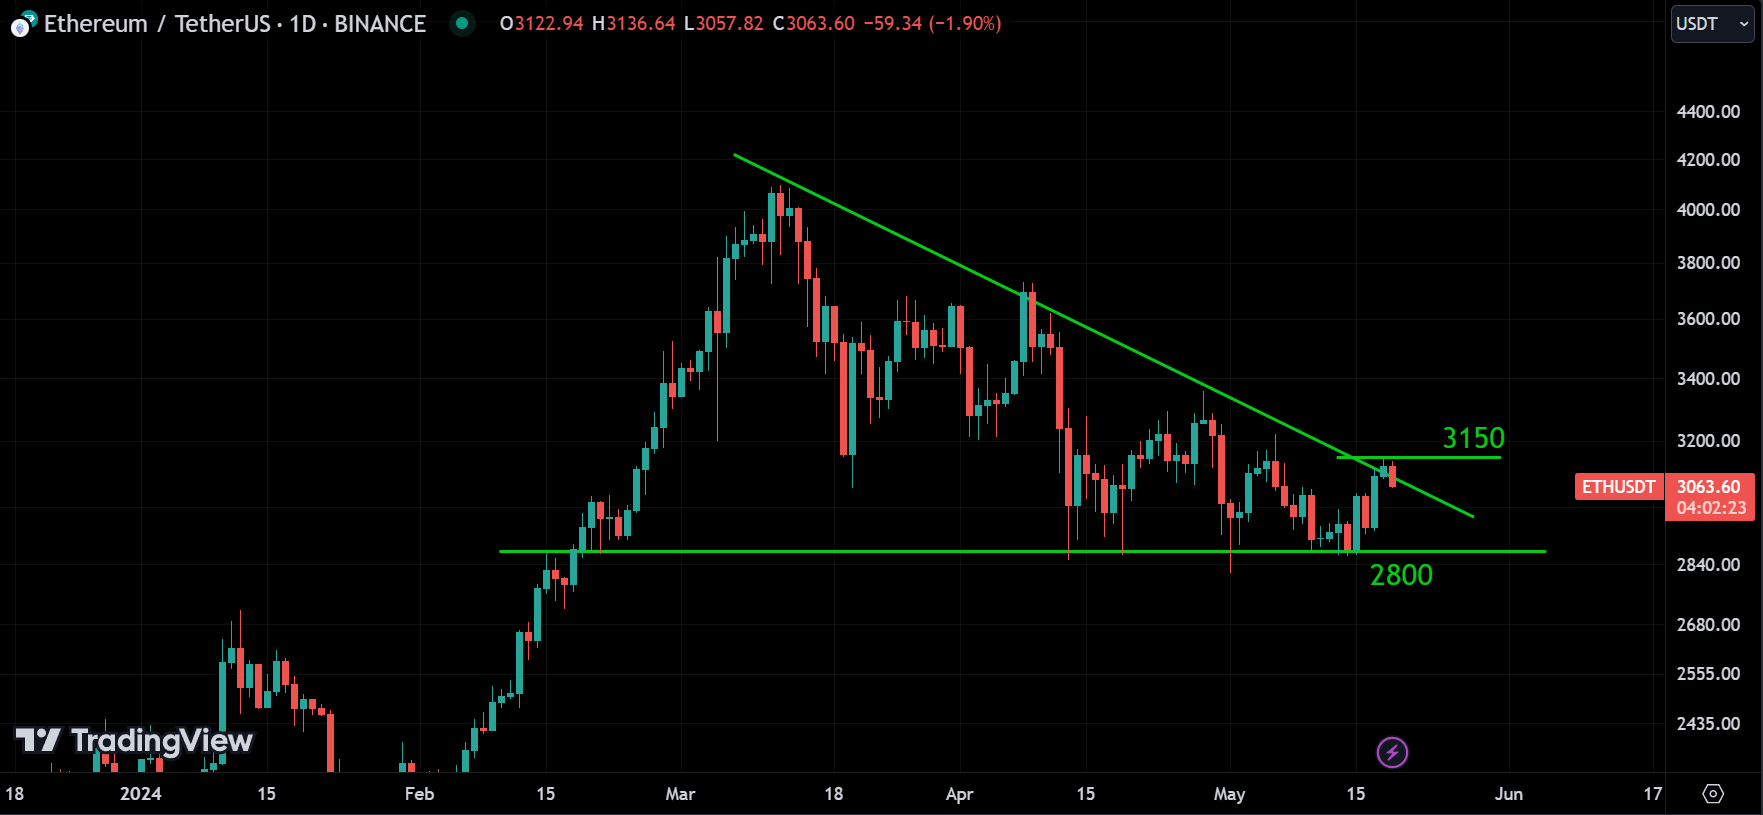
ETH should track BTC. With that in mind, it appears that the downtrend for ETH is done. But I can’t confirm it because it’s trading right on the line. So, to confirm, wait for the price to break the 3150 range. If it does, ETH will enter a bullish phase. On the other hand, if it retraces from that level, we can expect it to go down to 2800. So, wait for confirmation.
BNB:
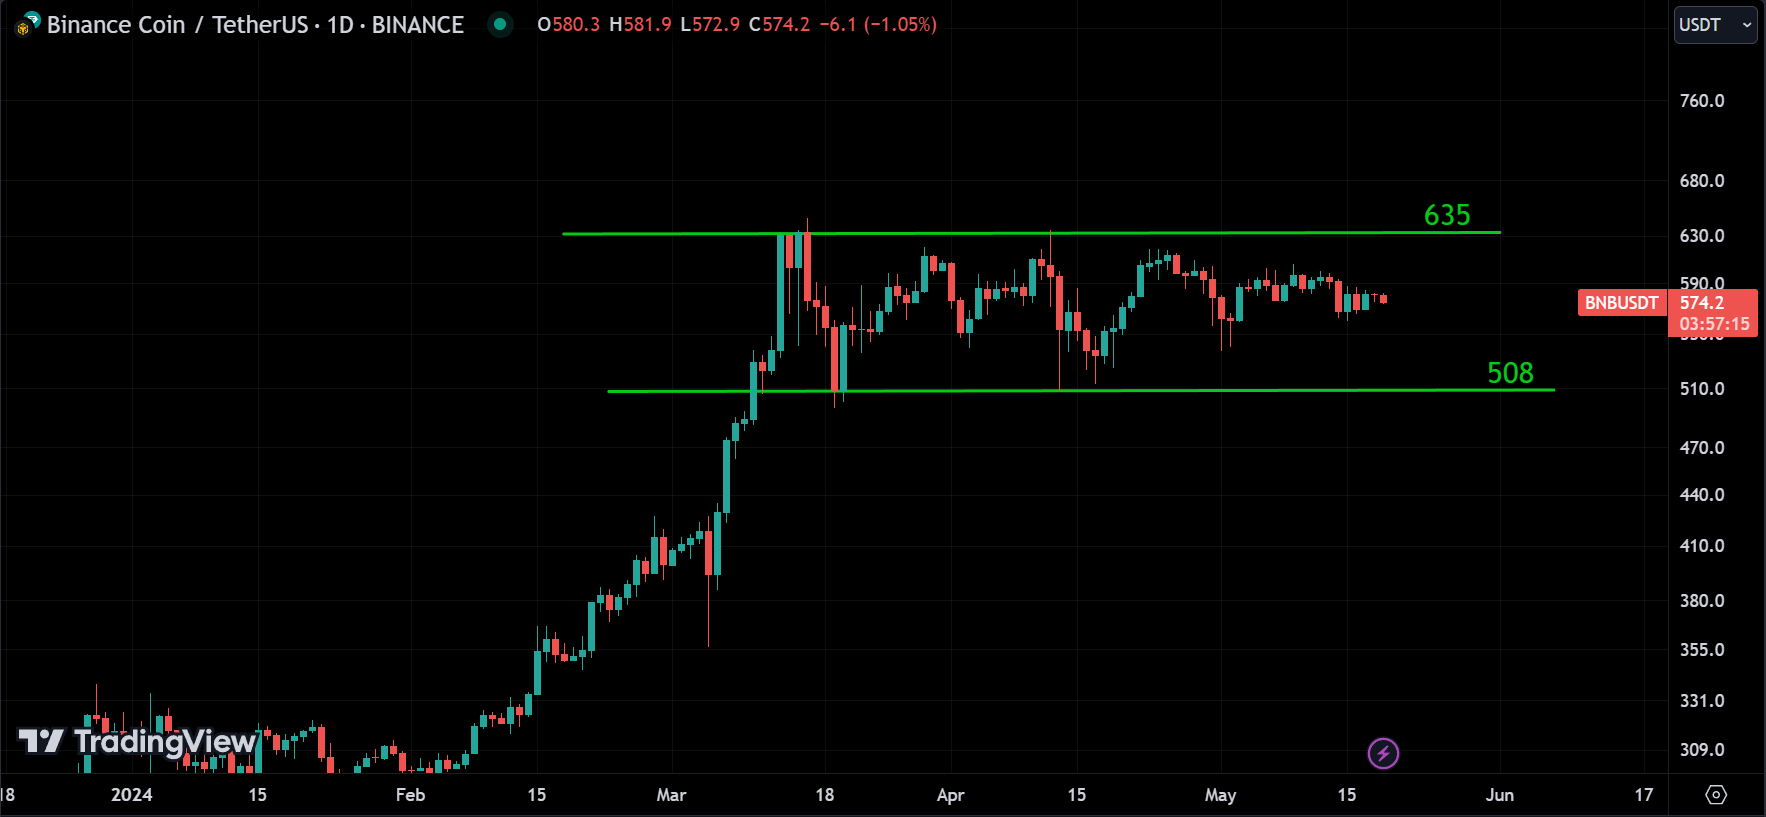
BNB is moving sideways, waiting for a breakout. It’s just waiting for Bitcoin, the big player, to make a move so it can follow suit. The 635 and 508 ranges seem to be the strongest resistance and support levels for the price. It will move sharply in the direction of the breakout. So, wait for the breakout to confirm the trend. Until then, it’s sideways.
Conclusion & Disclaimer
Please share your thoughts on this article: Did you find it helpful? Was it easy to understand, or do you want me to cover different time frames? I believe as we work on more articles together, you’ll begin to read the market more easily. Thank you!
It’s crucial to acknowledge the inherent unpredictability of financial markets. While we strive to offer informed perspectives on upcoming events and trends affecting various instruments, it’s important for readers to conduct their own analysis and exercise prudent judgment.
Encouragement of Independent Analysis
We strongly encourage readers to supplement the information presented here with their own research and analysis. Market dynamics can swiftly change due to a multitude of factors, and individual circumstances may vary. By conducting independent analysis, readers can tailor their strategies to align with their unique goals and risk tolerance.
No Certainty in Market Predictions
It’s vital to recognize that nobody possesses the ability to consistently predict market movements with absolute certainty. Market analysis serves as a tool to assess probabilities and identify potential opportunities, but it’s essential to remain cognizant of the inherent uncertainty in financial markets.
Aligning with High Probability
Rather than aiming for infallible predictions, our goal is to align with high-probability scenarios based on available information and analysis. This approach acknowledges the dynamic nature of markets while seeking to capitalize on opportunities with favorable risk-reward profiles.
Proceed with Caution
Lastly, while market analysis can offer valuable insights, it’s imperative to approach trading and investment decisions with caution. Markets can be volatile, and unforeseen events may impact asset prices unexpectedly. Exercise prudent risk management and consider seeking advice from qualified financial professionals before making any significant financial decisions.
Remember, the journey of financial analysis and investment is a continuous learning process, and embracing a disciplined approach can contribute to long-term success in navigating the complexities of global markets.
Please provide your feedback in the comment section below on how we can further improve our market analysis. Thank you.
Thank you 🙂
Thanks admin love the analysis
Let me know if you want me to cover different time frames.