

The simple ascending triangle chart pattern forex trading strategy is the opposite of the simple descending triangle chart pattern forex strategy.
An ascending triangle forex chart pattern is considered a bullish pattern, and it can form during an uptrend as a continuation pattern or form in a downtrend. After that pattern has been created, the trend can change to an uptrend.
How does The Simple Ascending Triangle Chart Pattern Form?
The following image chart from www.topstockresearch.com really gives good clarity on how the ascending triangle forex chart patterns form:
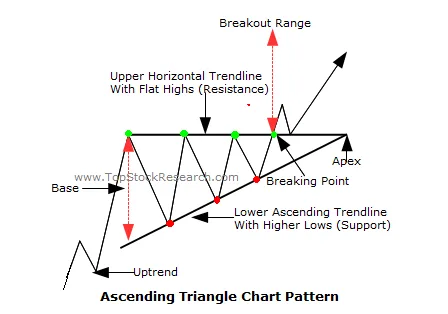
As you can see on the chart above:
- Price is temporarily stopped/restricted from moving higher by chart resistance level.
- But on the other hand, chart price continues to make higher lows until a breakout happens and the price shoots up.
How To Trade The Ascending Triangle Pattern-The Trading Rules
- Once you’ve found that an ascending triangle pattern is forming, you need to wait for the chart breakout to happen to the upside. The chart candlestick that breakouts the resistance and closes above the resistance level are called the breakout candlestick.
- Place a buy stop pending order two pips above the high of the chart breakout candlestick.
- Put your stop loss 5-10 pips below the low of the breakout candlestick, or if you are thinking of the tighter stop loss, the place is on the mid-level of the breakout candlestick.
- You can calculate your take profit(TP) based on risk: reward of 1:3 or look for a previous chart swing high and use that peak as your take profit target level.
Advantages of The Forex Ascending Triangle Chart Pattern Strategy
- This chart pattern trends create some good price moves to the upside, so you can make a lot of pips if you can get into a buy trade using the rules above.
- This pattern can be from one minute up to the monthly timeframe in any timeframe.
Disadvantages Of The Ascending Triangle Chart Pattern Forex Trading Strategy
- If the breakout candlestick is too long, this can result in your stop loss distance being quite significant.
- sometimes, false breakouts will happen, making you think that price is going to go up but only to reverse and knock out your stop loss