Moving average strategy is one of the most commonly used technical analysis tools. Moving averages calculate the average price over a specific number of periods in a specific period of time to smooth out the price action and help traders get a proper visual representation of an asset’s overall directional movement. In currency trading, moving averages are primarily used to generate trading signals. Long-term moving averages like the 50 and 200 Simple Moving Averages (SMAs) are also used to measure potential support and resistance.
When using moving averages to generate directional movement signals to buy or sell a currency pair, the basic concept is that traders believe that past price action will continue into the future and that it may be profitable to follow the trend. When moving averages are applied to predict significant support and resistance levels, it is based on the idea of a self-fulfilling prophecy.
In this moving average strategy guide, we will discuss how you can use and apply moving averages in different ways, adapting them to different strategies. Furthermore, we will also address some of the issues associated with using trend lines Vs a moving average and how to mitigate such issues to make the strategy more effective.
As a technical trader, we’ve all heard of maintaining a simple and effective trading system, and it’s no wonder that most successful traders often see clean charts (read naked!)
I am not a vigorous opponent of indicators, but I feel like I cringe when I see multi-colored colors on the chart that overshadow the right price action. You should keep the indicators to a minimum and use them only where they make sense; In our area for professional participants, we will teach you only the best and most important of them.
We need to outline a simple trading strategy based literally on a moving average and some basic understanding of how price works.
- Read More A Simple Forex EMA Strategy
Set up a moving average strategy
Start with a clean chart with nothing but candles/bars and draw a 50 exponential moving average (EMA). Believe it or not, we are ready to go!
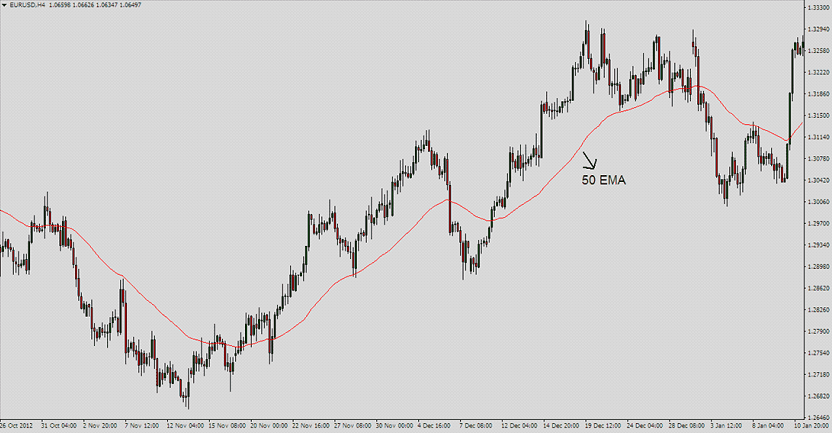
For us, things get interesting when the price returns to the 50-EMA after being away from it for a while.
If you have followed the moving averages closely in the past, you will probably realize that I am primarily alluding to the trend of price action. When the price moves sideways, the moving averages tend to move closer and be confused with the ongoing move, which often hits the price.
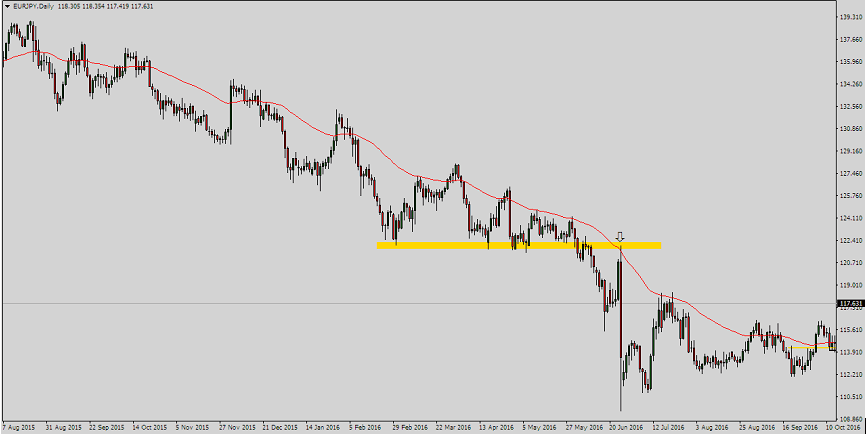
For systems based on moving averages, this can kill the account. As a simple filter for this problem, you should only be interested in that the price touches the 50-EMA after (relatively) spending some time away from it, for example, when it breaks out of a decent trend. The Chart above illustrates this.
Take a look at some points on the same diagram that may interest us:
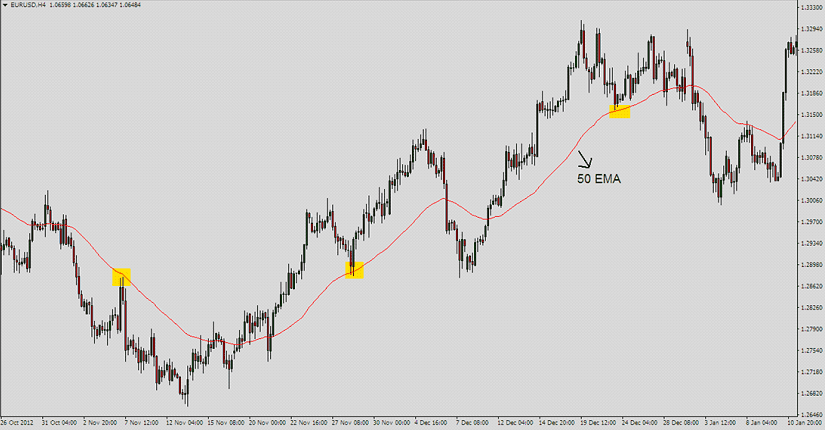
Notice how each of the three hits of the 50 EMA noted above results in a bounce and that they occur as a continuation of a previous strong move. Very often, the price bounces off the 50-EMA the more time you spend out of it.
- Read More What is EMA in Forex Trading
When Not to Trade
We’ve already talked about an important filter that can help you quickly exclude the weaker setups from the stronger ones – only trade trending markets where the price doesn’t reach 50 EMAs quickly. Let’s also talk about another critical filter.
Horizontal Support and Resistance levels
Get excited every time I see the price move back to the 50-EMA after a strong move, but my fingers don’t move over the order button until I find the point where the price touches the 50-EMA, which is in confluence with the horizontal anterior support. And the level of resistance. Found this to be a fantastic filter. Sure, miss some trains, but the ones do on, enjoy the ride like hell, well, most of all!
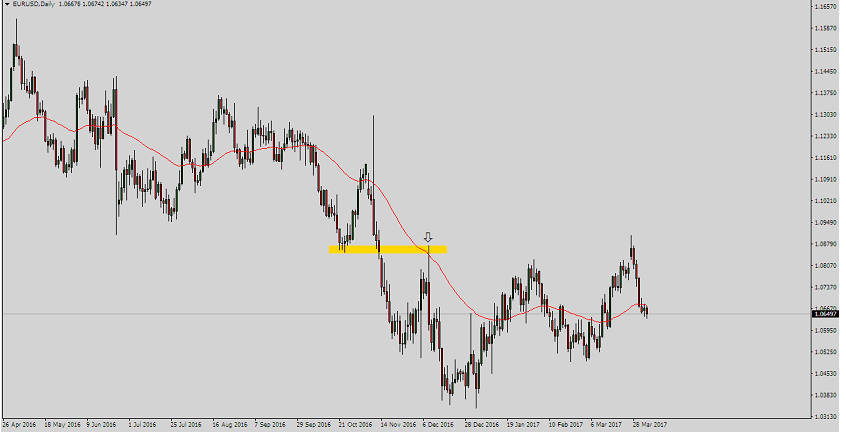
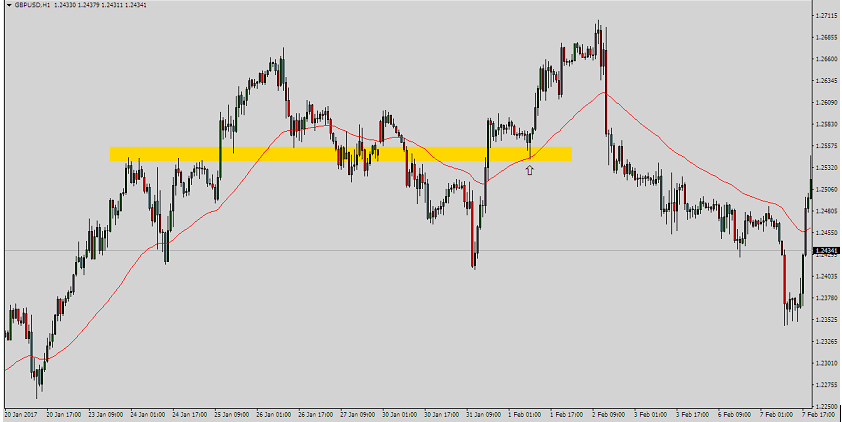
For each of the three charts above, note that we have achieved the desired touchdown at the 50-day moving average, but that touchdown also coincides with a clear previous area of support or resistance.
If you can learn to combine the two and are tired of the 50-EMA catching up too much with recent price action, you have a powerful and effective trading system that is simple and powerful.
Read More : When is the best time to trade Forex?
Entry trigger
Now that we know the dynamics of the system itself let’s look at two ways that I think this method can be changed from conservative to aggressive.
Aggressive approach
This approach allows you to execute the order when the 50 EMA is touched. The stop loss should be arbitrarily placed several pips above or below your entry point, depending on the circumstances. Note that such a trigger would work great in the third (last) example posted in the previous section. The price reaches the 50-EMA and bounces strongly.
Here’s another one
This will mark good moments; you know where to put your glasses and act as the hero of your story. Often the price hits and bounces off the 50-EMA to the touch, without necessarily signaling price action to conservative traders (hint: alternative approach). The downside, of course, is that using blind trading and holding arbitrary stops carries significant risk.
In reality, you never know for sure how many pips you need for a reliable stop loss. Keep it wide enough, and you will screw up your home entry target (50 EMA where you expect a bounce), ruining your risk-reward ratio. Hold it too tight, and you risk getting pulled out without necessarily being wrong (and it hurts like hell!)
It will depend on the market you are trading in, your experience with the method and blind trading, and of course, the robustness of the setup itself.
The main advantage you gain with a significant risk/reward ratio may offset some of the additional losses you may suffer by taking this aggressive path.
Take this Set Up, for example
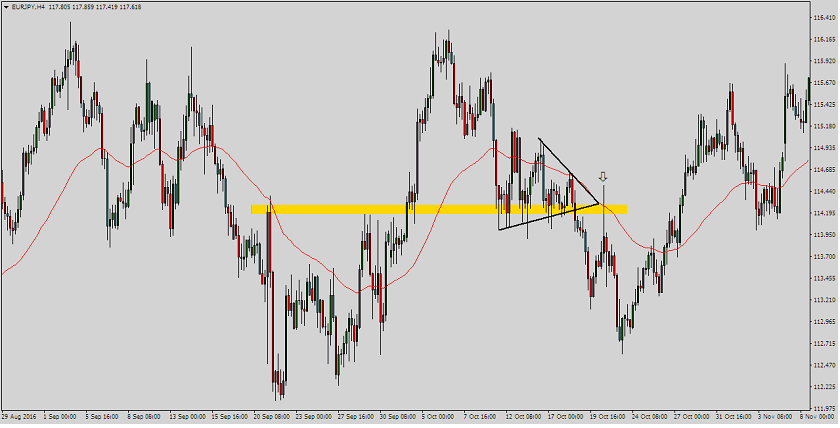
We have a pullback to the 50 days moving average and a nice merge with the wedge pattern and horizontal support and resistance levels. And hey, the price does what you’d expect, only it spikes a bit above the 50 EMA, which I would feel comfortable with. The stop here must be very wide to accommodate this false upward movement.
Conservative approach
There is an alternative approach for those who like a calm and relaxed life where you can wait for a specific price action signal on a 50-EMA bounce on a candlestick pattern, such as a pin bar or a pattern.
Enveloping bar
Suppose you have noticed that this previously published setting is a tutorial for conservative operators. It shows a good pin bar from the 50-day moving average and horizontal support and resistance levels.
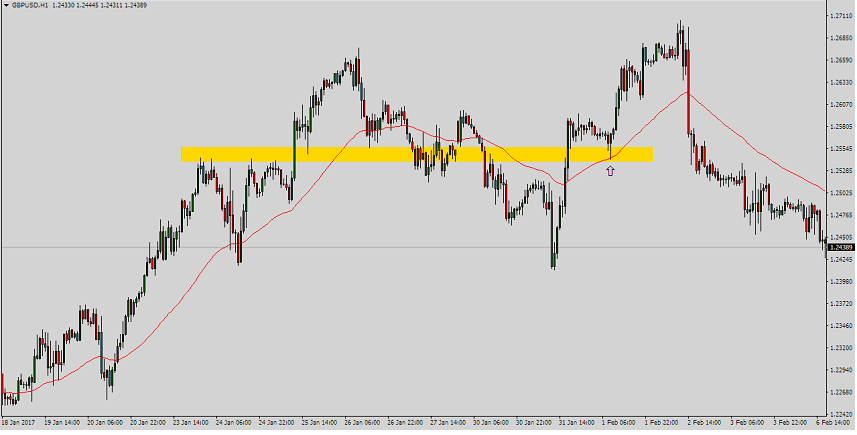
You can now open trade as you normally would if you were trading pin bars. That is, opening an entry at the breakout of the pin bar with a stop loss (objectively!) Placed at the breakout of the other end of the bar.
Waiting for price action confirmation adds a level of strength to the setup, but probably won’t bring you as much risk – the payoff, as in the aggressive approach, is evident from the delayed entry.
I prefer to wait for price action to confirm because I have been an avid fan of candlestick patterns during my trading career. Although I also make cash trades from time to time when I see a mountain of the very obvious confluence of support and resistance areas lining up at the point of contact.
Well, this sums up this super simple trading strategy. You will learn step by step about our precise trading method with additional tips and notes on price action and technical analysis in our professional area.


[…] bands waits for the fast-moving orange averages to cross the purple slowly upward. But the moving averages must first have gone into the oversold zone (the level below […]
[…] with Technical Indicators: Combining order block analysis with other technical indicators (like moving averages, RSI, and Fibonacci retracements) can provide a more robust trading strategy. For instance, if a […]
[…] buy and sell signals in the financial markets. It achieves this by employing a combination of moving averages, momentum indicators, and volatility measures, each of which provides a unique perspective on […]