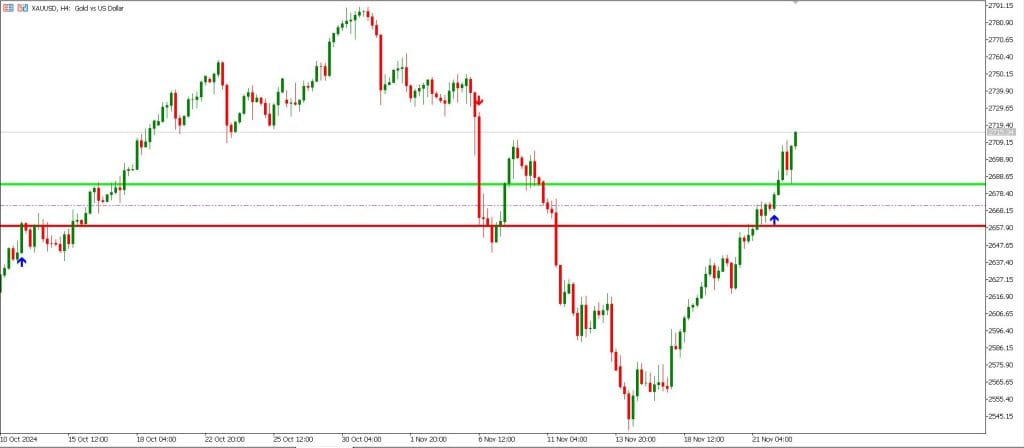
If you’ve been trading forex for any length of time, you know how critical it is to have a strategy that combines clear trend signals with a way to set realistic profit and risk levels. That’s exactly what the Trend Arrows Sign and Daily Range Projections Strategy brings to the table. It’s a simple yet effective way to trade with confidence, even in volatile markets.
Here’s how it works: the Trend Arrows Sign helps you identify market direction, while the Daily Range Projections give you a sense of how far price is likely to move in a day. Together, they help you find trades with solid potential while keeping your expectations grounded.
What’s the Trend Arrows Sign Indicator?
This indicator is all about clarity. On your MT5 chart, you’ll see arrows that point out the direction of the trend. It simplifies decision-making by showing whether the market is bullish (uptrend) or bearish (downtrend).
Here’s how you use it:
- Bullish arrows: Indicate upward momentum—look for buy opportunities.
- Bearish arrows: Signal downward momentum—look for sell opportunities.
What I like about this tool is how straightforward it is. No guesswork, just clear visual cues.

What’s the Daily Range Projections Indicator?
The Daily Range Projections Indicator takes a more predictive approach. It estimates the high and low price levels for the day based on historical data and current market conditions. These levels act like invisible boundaries, helping you figure out realistic take profit targets and where to set your stop-loss.
Key points:
- If the daily range is wide, you can aim for big profits.
- If it’s narrow, you’ll want to set tighter targets to avoid overreaching.
This is especially helpful because it keeps your trades aligned with the day’s volatility.
Why Combine These Two Indicators?
Using the Trend Arrows to spot opportunities and the Daily Range Projections to set your parameters is a powerful combo. The arrows show you where the market is heading, and the range projections make sure you’re not expecting too much—or too little—from the trade. It’s all about balance.
How to Use the Strategy
Let’s break it down into buy and sell setups so you can see how to apply this strategy on your MT5 platform.
Buy Setup (Going Long)
- Spot the Trend: Look for a bullish trend arrow on your chart. Ideally, you want to see consecutive arrows pointing upward or one that appears after a pullback.
- Confirm with Range Projections: Check the Daily Range Projections to ensure there’s enough volatility for price to move significantly. If the projected range is narrow, it might not be worth the trade.
- Enter the Trade: Enter a buy trade when the price closes above a key resistance level or moving average. The bullish arrow and price confirmation together signal it’s time to act.
- Set Your Stop-Loss: Place your stop-loss just below the recent swing low or a key support level to limit your risk.
- Take-Profit Target: Aim for the upper boundary of the daily range projection or the next resistance level. If momentum is strong, you can adjust your target accordingly.
Sell Setup (Going Short)
- Spot the Trend: Look for a bearish trend arrow. Similar to the buy setup, consecutive bearish arrows or one appearing after a pullback are strong signals.
- Confirm with Range Projections: Ensure the Daily Range Projections indicate enough room for price to move lower. If the range is too tight, the trade might not be worth taking.
- Enter the Trade: Enter a sell trade when the price closes below a key support level or moving average. The bearish arrow confirms the downtrend.
- Set Your Stop-Loss: Place your stop-loss just above the recent swing high or a key resistance level.
- Take-Profit Target: Target the lower boundary of the range projection or the next support level. Adjust your take-profit if the trend gains strength.
Download a Collection of Indicators, Courses, and EA for FREE
Why This Strategy Works
- Simple Trend Identification: The Trend Arrows Sign keeps you focused on the market’s direction without overcomplicating things.
- Realistic Expectations: The Daily Range Projections ensure your targets and risk levels are aligned with the day’s potential price movement.
- Better Risk Management: Knowing the day’s range helps you avoid setting unrealistic stop-losses or take-profit levels, which can make or break your trades.
Tips for Success
- Trade Active Sessions: This strategy works best during the London and New York sessions when the market is most active.
- Avoid Overtrading: Not every arrow will lead to a winning trade. Be selective and wait for confirmation from both indicators.
- Watch the News: Major economic events can blow past daily range projections, so always check the calendar before placing a trade.
- Use a Demo Account First: If this is your first time using these indicators, test the strategy on a demo account to get comfortable.
Free Download Trend Arrows Sign and Daily Range Projections
Read More Volatility Quality Zero Line Forex Indicator For MT4 Free Download
Wrapping It Up
The Trend Arrows Sign and Daily Range Projections Strategy is a balanced approach that keeps things simple while giving you the tools to trade with confidence. The trend arrows point you in the right direction, while the daily range projections ensure your expectations match what the market can realistically deliver.
Try it out on MT5, and tweak it to fit your trading style. Remember, no strategy guarantees success every time, but with discipline and proper risk management, this one can give you a solid edge.
Happy trading!


