Forex trading is both an art and a science. For beginners, navigating the complexities of the forex market can be daunting. To succeed, you need strategies that are not only effective but also simple enough to understand and execute. This guide dives deep into five Simple Forex Strategies for Beginners, offering detailed insights into how they work, why they are effective, and how you can implement them.
Table of Contents
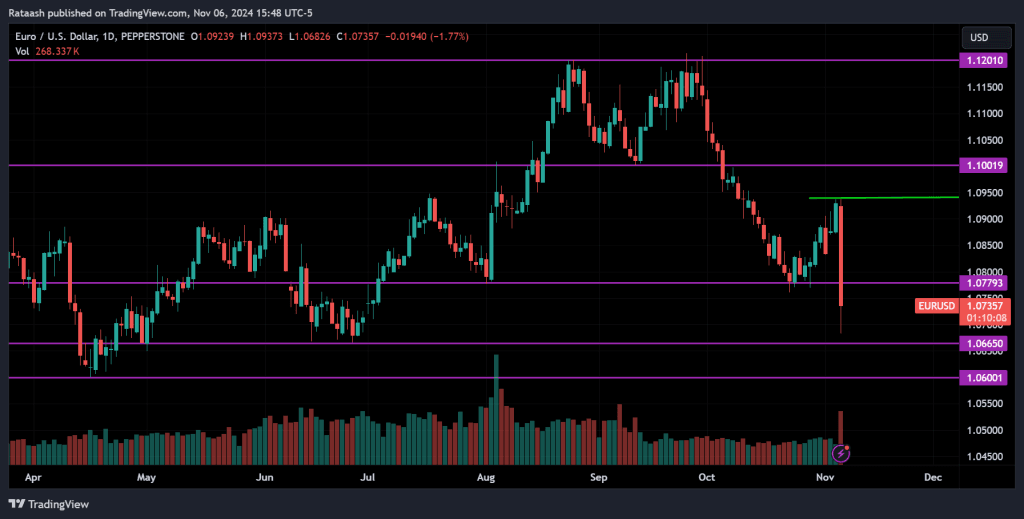
To understand these strategies better, you need to know how the market works, how prices move, and how analysts study the forex market. Your goal isn’t to predict exactly where the market will go, but to understand what other traders are likely to do, as their actions drive prices. Learning how price action works will give you a clearer understanding.
To explore each strategy in detail, follow the links provided with each one.
1. Trend Following Strategy
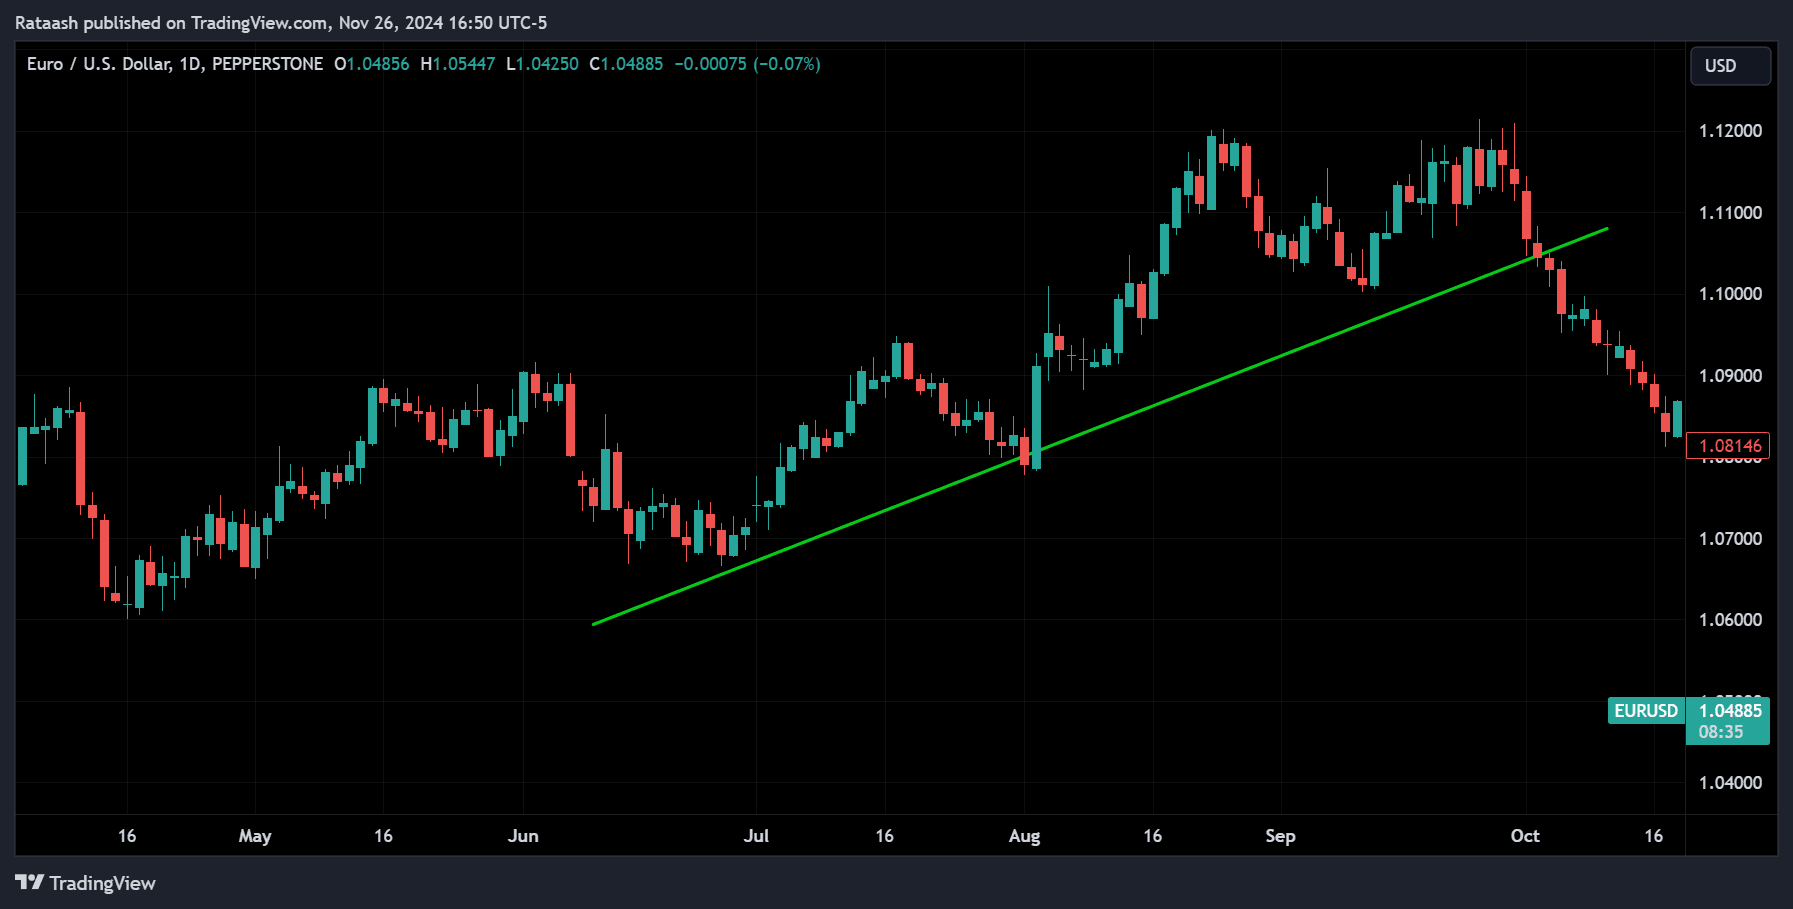
The trend-following strategy is the cornerstone of trading. It involves identifying and trading in the direction of a market’s prevailing trend. Trends represent collective market sentiment and often persist for extended periods, making them reliable indicators for trading.
Understanding Market Trends
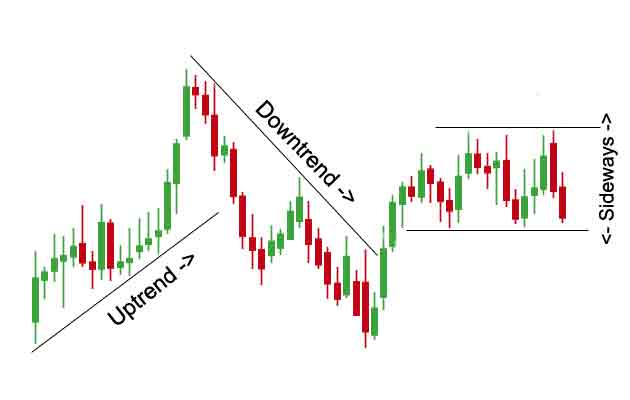
Market trends occur in three directions:
- Uptrend: Prices move higher with higher highs and higher lows.
- Downtrend: Prices move lower with lower highs and lower lows.
- Sideways trend (Range): Prices fluctuate within a horizontal range without clear direction.
How Trend Following Works
Trend following is about riding the wave of momentum:
- Identify the Trend: Use higher timeframes to spot the overall trend. For instance, on a daily chart, an uptrend is characterized by a series of higher highs and lows.
- Use Indicators for Confirmation: Common indicators include:
- Moving Averages (MA): A 50-day moving average crossing above a 200-day moving average confirms an uptrend.
- ADX (Average Directional Index): An ADX value above 25 indicates a strong trend.
- Plan Your Entry: In an uptrend, wait for the price to pull back to a support level (e.g., a moving average or trendline). Enter when the price shows signs of resuming the trend.
Example Trade
Let’s say EUR/USD is in an uptrend. On the 4-hour chart, the price pulls back to the 50-day MA. A bullish candlestick signals the continuation of the trend. You place a buy order, setting a stop-loss below the recent swing low. As the price resumes its uptrend, you take profit at the next resistance level.
2. Breakout Trading Strategy
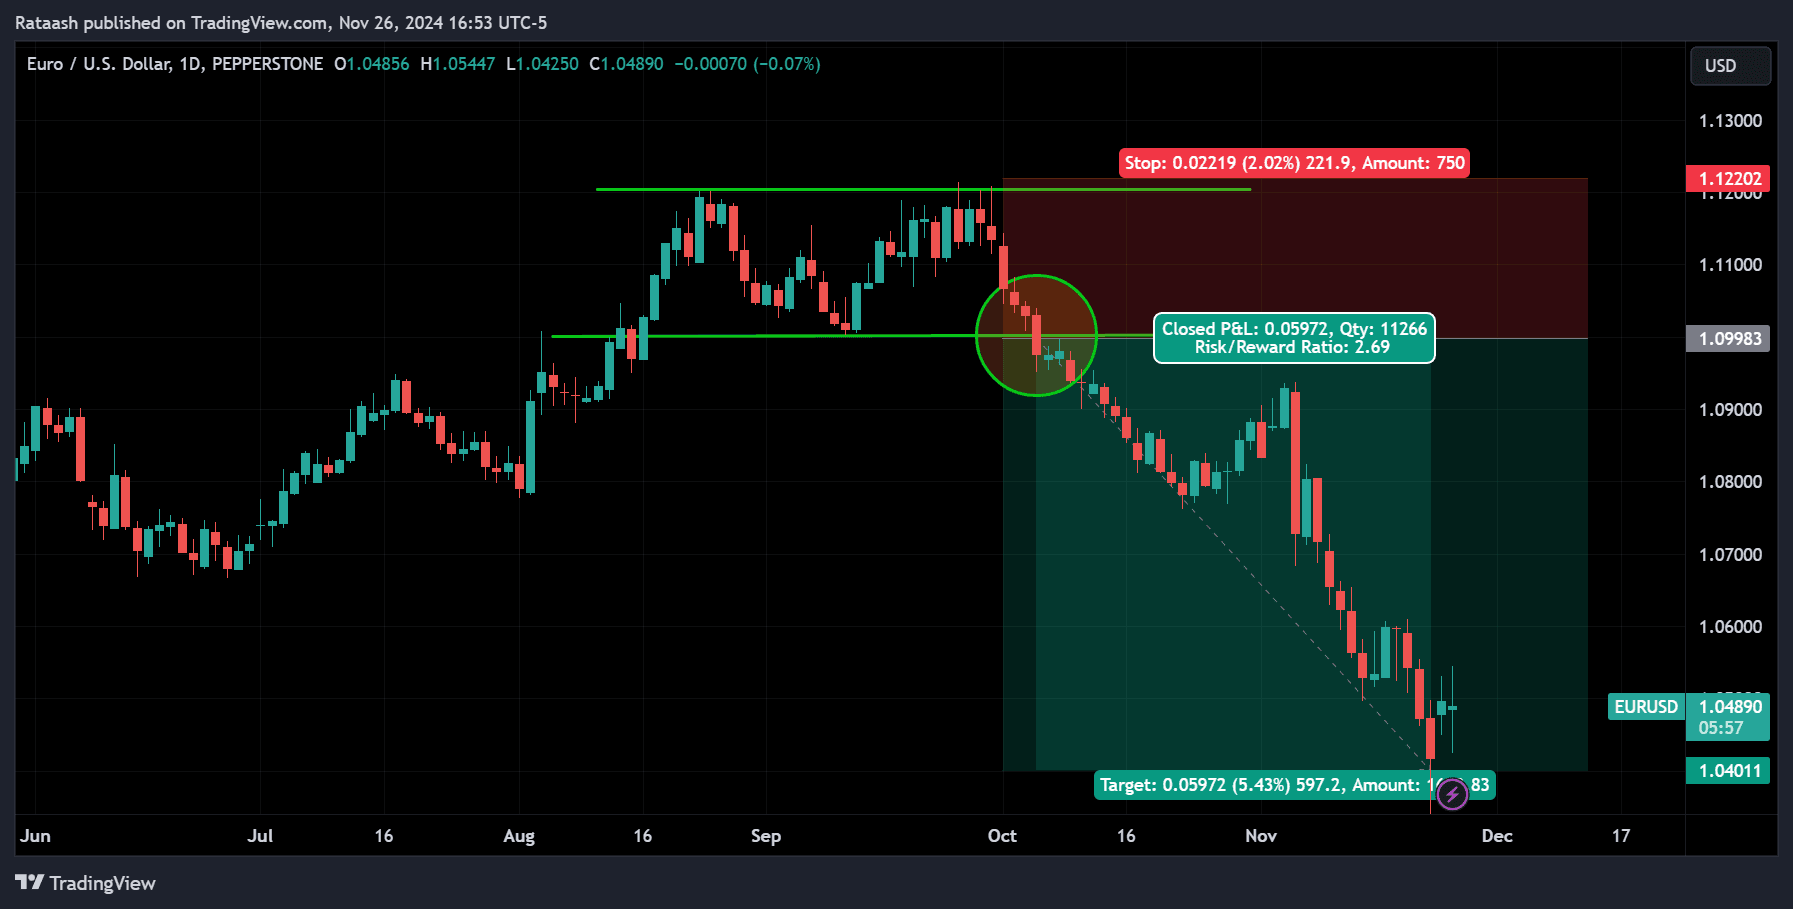
Breakouts occur when the price moves out of a defined range, often leading to significant price momentum. This strategy capitalizes on these moves, making it ideal for volatile markets.
Why Breakouts Happen
Breakouts are driven by increased market interest, often triggered by economic data releases or major geopolitical events. When prices breach support or resistance, they attract traders who further fuel the momentum.
Steps to Implement a Breakout Strategy
- Identify Consolidation Zones: Look for areas where prices are moving sideways, forming a tight range.
- Draw Support and Resistance Levels: Mark the high (resistance) and low (support) of the range.
- Wait for a Breakout: A valid breakout requires a strong candlestick closing above resistance (for bullish moves) or below support (for bearish moves).
- Confirm the Breakout: Use volume indicators. A spike in trading volume validates the breakout.
- Plan Your Entry and Exit:
- Enter on the breakout candle’s close.
- Set your stop-loss just below the breakout level for bullish trades or above for bearish trades.
- Measure the height of the consolidation range and use it to project your profit target.
Example Trade
GBP/USD consolidates between 1.3000 (resistance) and 1.2900 (support). After a strong economic report, the price breaks above 1.3000 with high volume. You enter a buy trade, setting your stop-loss at 1.2970 and your profit target at 1.3100.
3. Moving Average Crossover Strategy
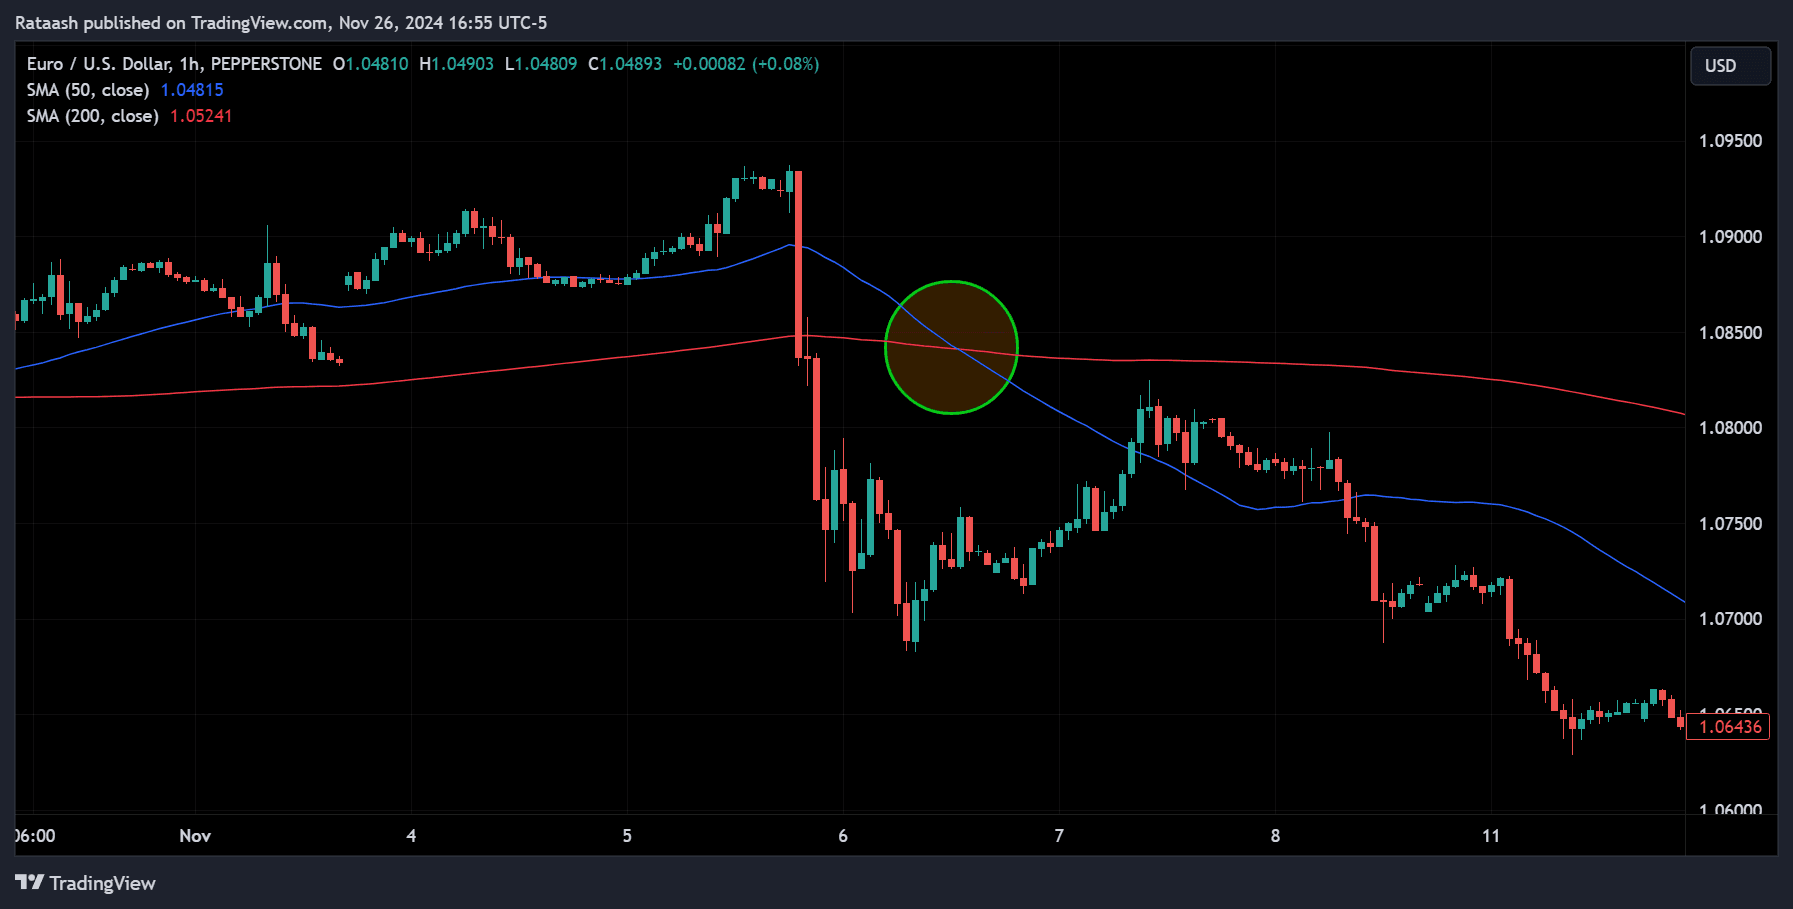
Moving averages smooth out price data, making it easier to identify trends. A crossover strategy uses two moving averages of different lengths to generate buy and sell signals.
Why Moving Averages Work
Moving averages reflect the average price over a specific period. By comparing a short-term average with a long-term one, traders can spot changes in momentum.
Executing the Crossover Strategy
- Choose Two Moving Averages:
- A fast-moving average (e.g., 10-period EMA) reacts quickly to price changes.
- A slow-moving average (e.g., 50-period EMA) smooths out noise.
- Look for Crossovers:
- Bullish Crossover: The short-term MA crosses above the long-term MA, signaling an uptrend.
- Bearish Crossover: The short-term MA crosses below the long-term MA, signaling a downtrend.
- Combine with Trend Filters: Use RSI or MACD to ensure trades align with the broader trend.
- Set Risk Management Rules: Place stop-losses at recent swing lows/highs. Use trailing stops to lock in profits.
Example Trade
On USD/JPY, the 10-day EMA crosses above the 50-day EMA, confirming an uptrend. You enter a buy trade and set your stop-loss below the recent swing low. As the price rises, you adjust your stop-loss to protect profits.
4. Support and Resistance Strategy
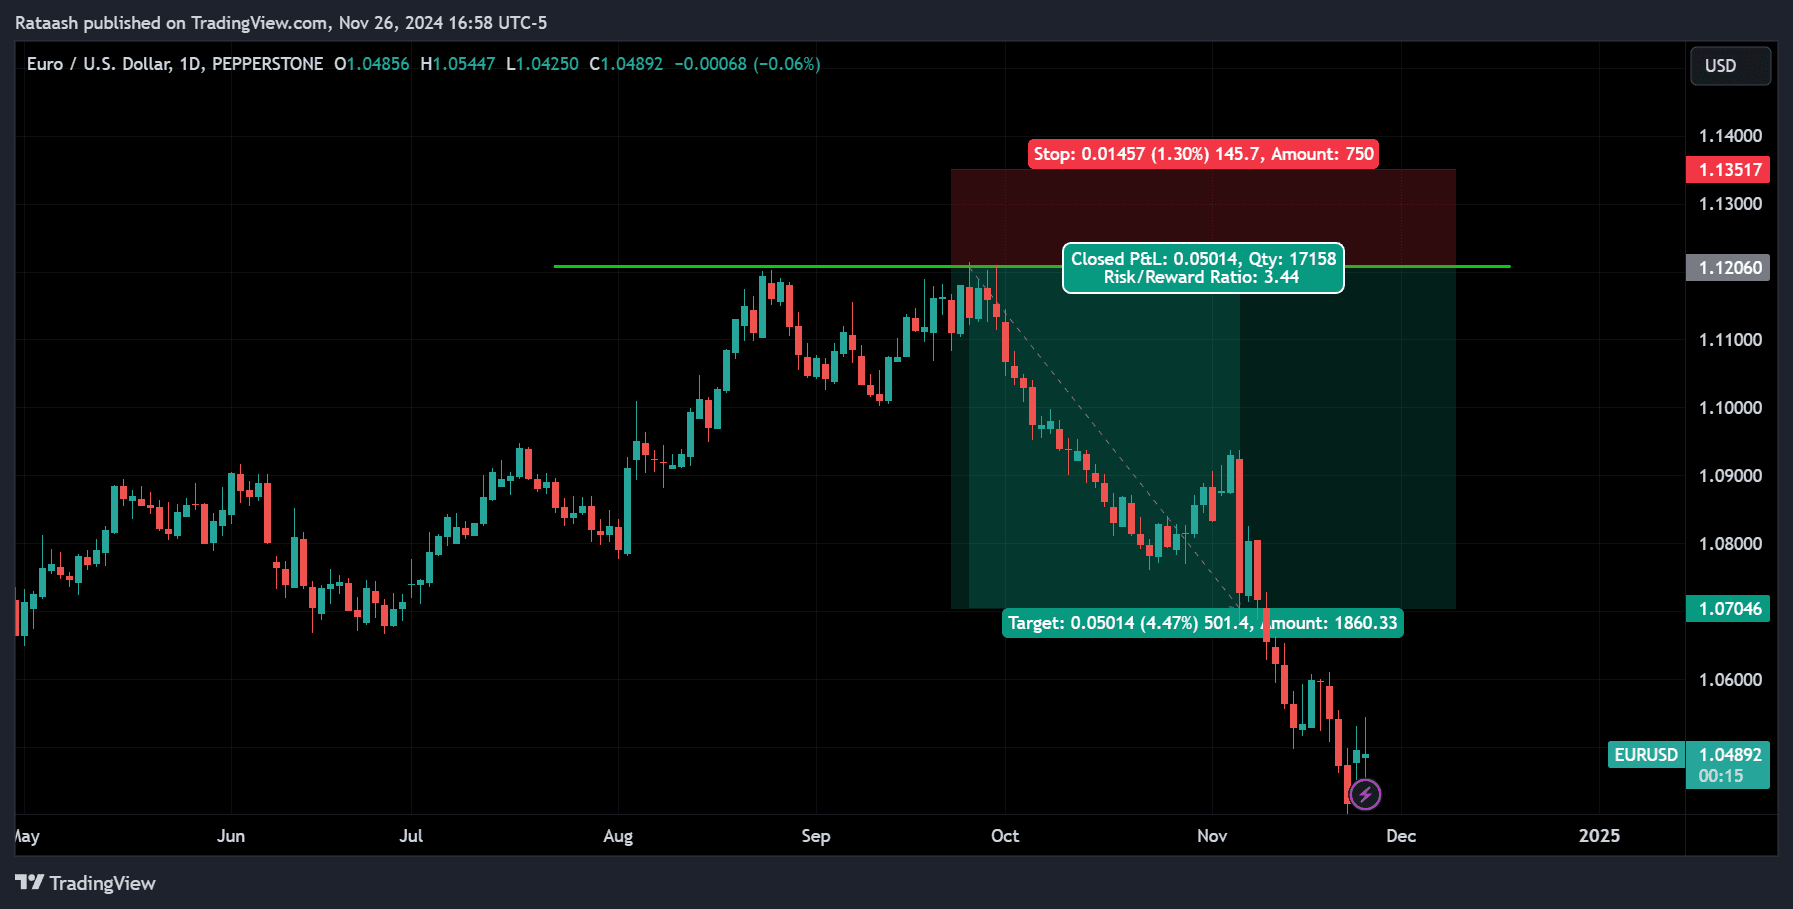
Support and resistance levels are critical in forex trading as they represent areas where prices often reverse or consolidate. This strategy involves trading around these levels to capitalize on price reversals or breakouts.
Understanding Support and Resistance
- Support: A price level where buying pressure prevents further declines.
- Resistance: A price level where selling pressure prevents further rises.
How to Trade Support and Resistance
- Mark Key Levels: Use historical data to identify recurring support and resistance levels on higher timeframes.
- Wait for Price Action Confirmation:
- Bullish signals at support: Hammer candlesticks, bullish engulfing patterns.
- Bearish signals at resistance: Shooting star, bearish engulfing patterns.
- Set Stop-Loss and Take-Profit:
- Place stop-loss orders slightly beyond the level.
- Use the next support or resistance level as your profit target.
Example Trade
AUD/USD approaches a support level at 0.6500. A bullish hammer forms, signaling a reversal. You enter a buy trade with a stop-loss below 0.6480 and a profit target at the next resistance of 0.6600.
5. RSI Divergence Strategy
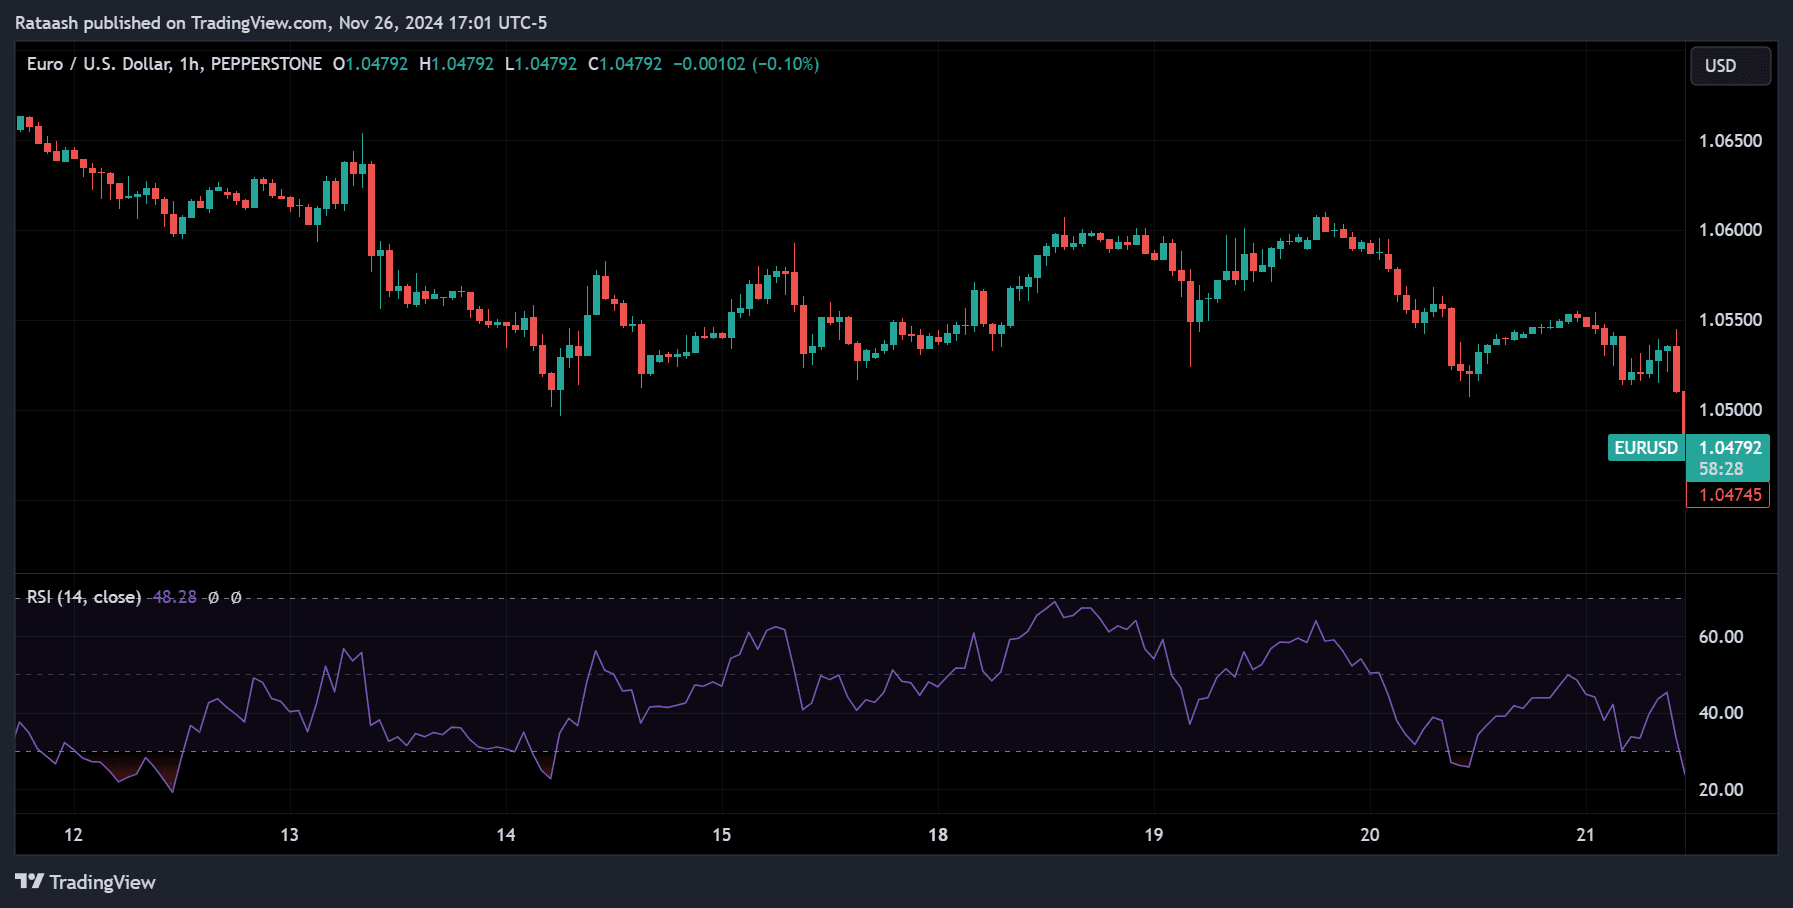
The RSI (Relative Strength Index) divergence strategy helps traders identify potential reversals by comparing price action with the RSI indicator.
What is RSI Divergence?
- Bullish Divergence: Price makes lower lows, but RSI makes higher lows, signaling weakening selling pressure.
- Bearish Divergence: Price makes higher highs, but RSI makes lower highs, signaling weakening buying pressure.
Steps to Trade RSI Divergence
- Identify Divergence:
- Spot discrepancies between price action and RSI movements.
- Use higher timeframes for more reliable signals.
- Combine with Key Levels: Look for divergence near support or resistance zones to enhance accuracy.
- Enter the Trade:
- Buy when bullish divergence forms at support.
- Sell when bearish divergence forms at resistance.
- Set Risk Management Rules:
- Place stop-loss orders below/above the divergence point.
- Use the next support/resistance level for profit targets.
Example Trade
USD/CHF shows a bullish divergence near a support level of 0.9000. You enter a buy trade with a stop-loss at 0.8980 and a profit target at 0.9100.
Additional Tips for Success
- Understand Risk Management: Always risk no more than 1-2% of your trading capital per trade.
- Stick to One Strategy at a Time: Master one strategy before experimenting with others.
- Track Your Performance: Maintain a trading journal to analyze your trades and improve.
- Stay Informed: Keep an eye on economic events that could impact your trades.
- 5 Best Indicators for Your Trading [FREE Downloads]
By diving deeper into each strategy and understanding its meaning, you can confidently implement these techniques in your trading journey. Remember, success in forex requires patience, discipline, and a commitment to continuous learning. Start with a demo account to practice these strategies before transitioning to live trading.

