

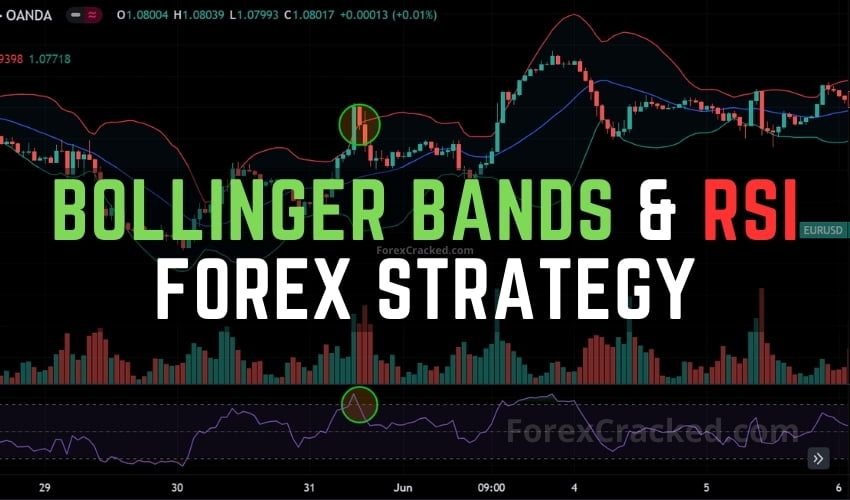
Bollinger Bands and the Relative Strength Index (RSI) are two widely respected technical indicators that, when combined, offer traders a robust method for analyzing market conditions and identifying trading opportunities.
In this article, we will delve into the Bollinger Bands and RSI trading strategy, providing a comprehensive guide to help traders make informed decisions and enhance their trading performance.
Understanding Bollinger Bands
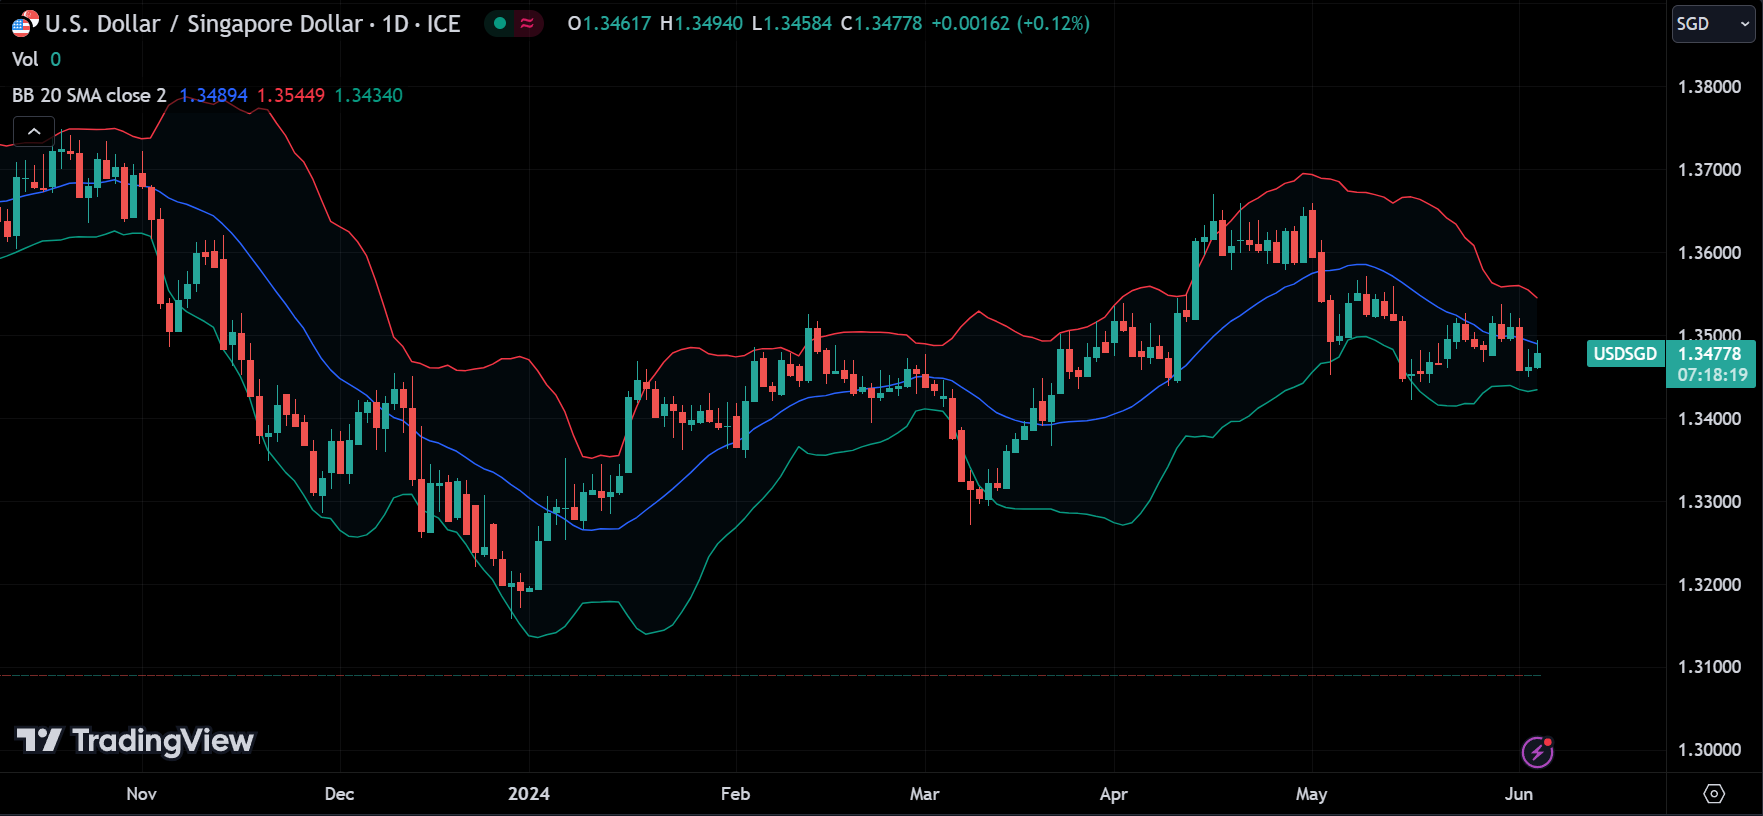
Bollinger Bands, developed by John Bollinger in the 1980s, are a type of statistical chart characterizing the prices and volatility over time of a financial instrument. They consist of three lines:
- Middle Band: A simple moving average (SMA), typically set to 20 periods.
- Upper Band: Plotted two standard deviations above the middle band.
- Lower Band: Plotted two standard deviations below the middle band.
The distance between the upper and lower bands expands and contracts based on market volatility. During periods of high volatility, the bands widen, and during periods of low volatility, they contract.
Understanding RSI
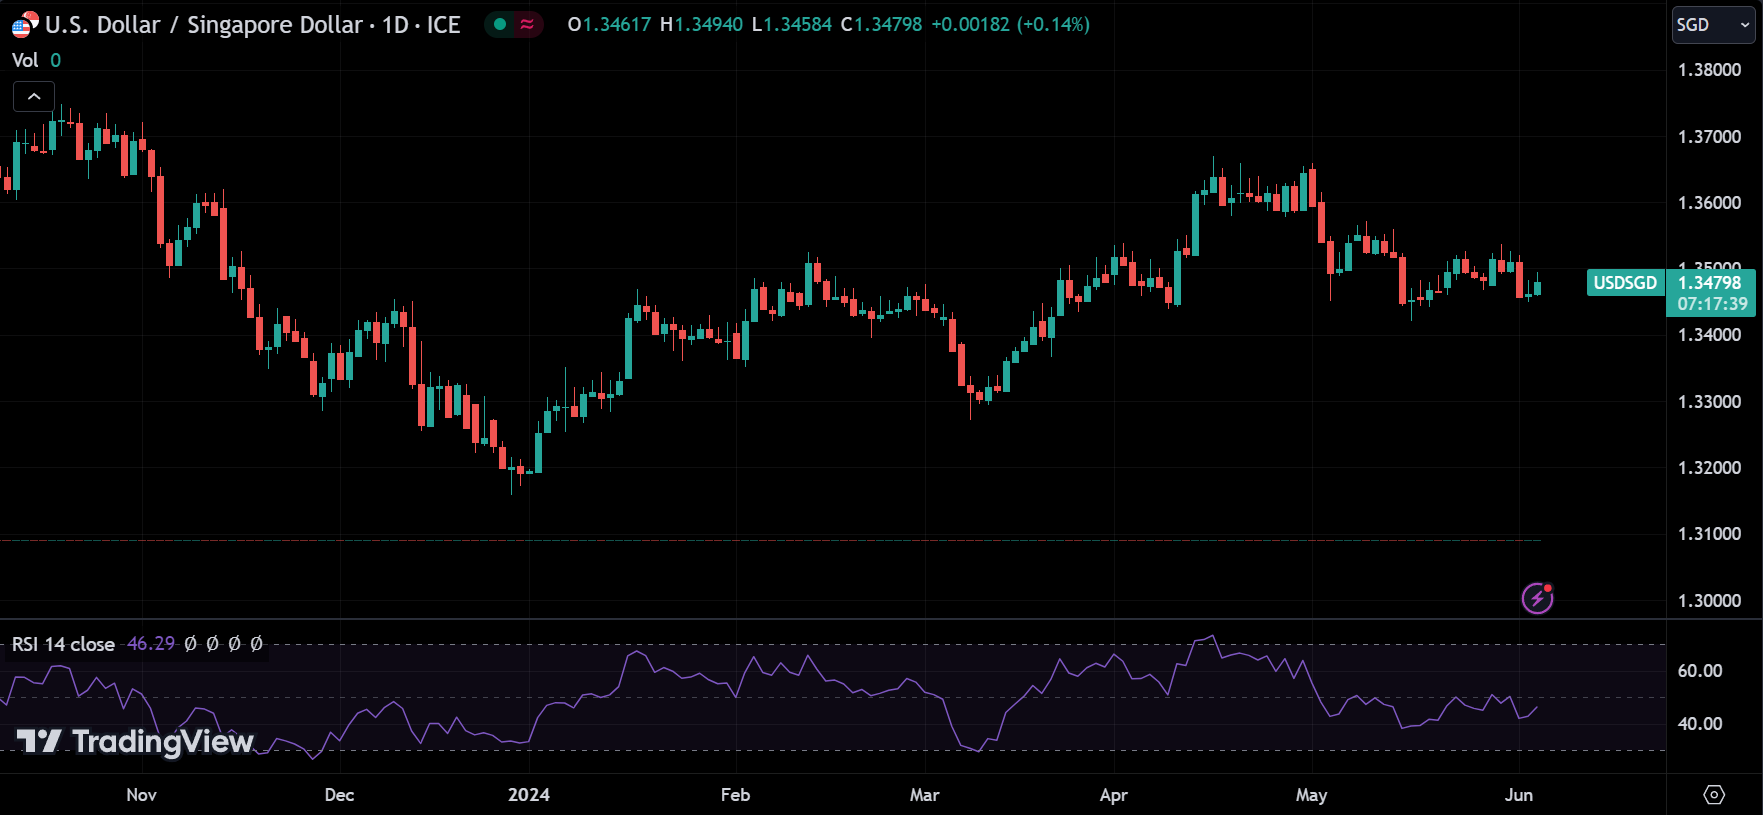
The Relative Strength Index (RSI), developed by J. Welles Wilder, is a momentum oscillator that measures the speed and change of price movements. The RSI oscillates between 0 and 100 and is typically used to identify overbought or oversold conditions in a market.
The RSI is calculated using the following formula:
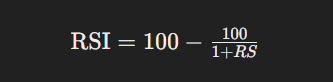
Where RS (Relative Strength) is the average of ‘n’ days’ up closes divided by the average of ‘n’ days’ down closes. A common setting for RSI is 14 periods.
Key RSI Levels
- 70 and above: The asset is considered overbought, indicating a potential sell opportunity.
- 30 and below: The asset is considered oversold, indicating a potential buy opportunity.
Bollinger Bands and RSI Trading Strategy
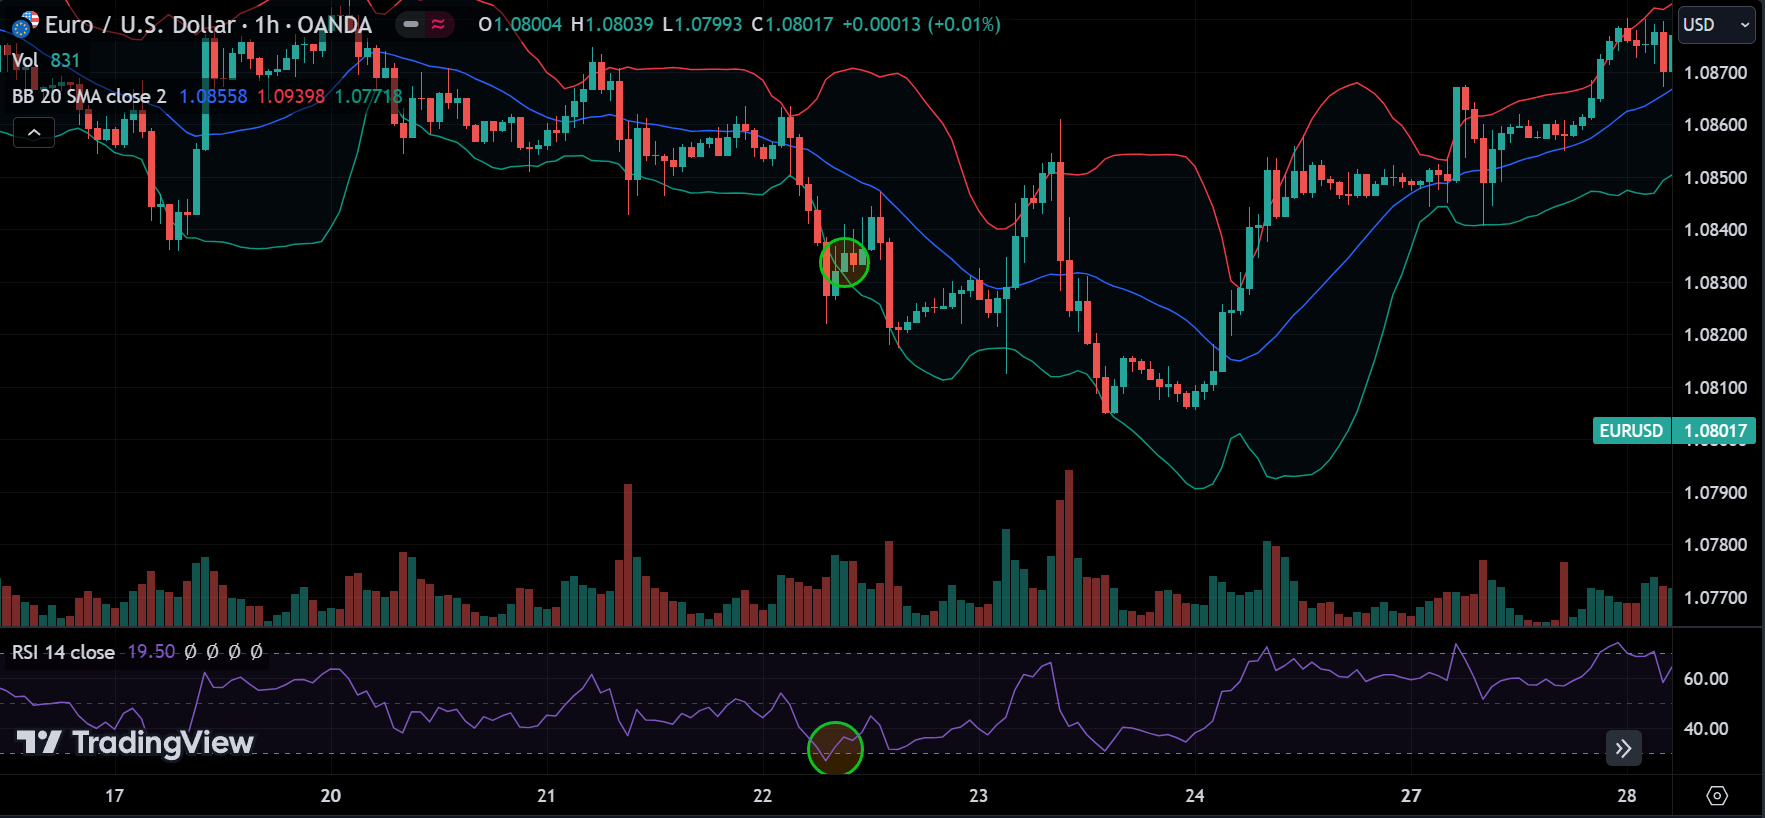
This RSI trading strategy uses two simple tools: Bollinger Bands and the Relative Strength Index (RSI). The goal is to take advantage of price changes when the market is active. Normally, an RSI level of 70 means the price is high (overbought), and an RSI level of 30 means the price is low (oversold). We buy when the RSI moves up from the oversold level and the price is at or below the lower Bollinger Band, and we sell when the price reaches the middle Bollinger Band.
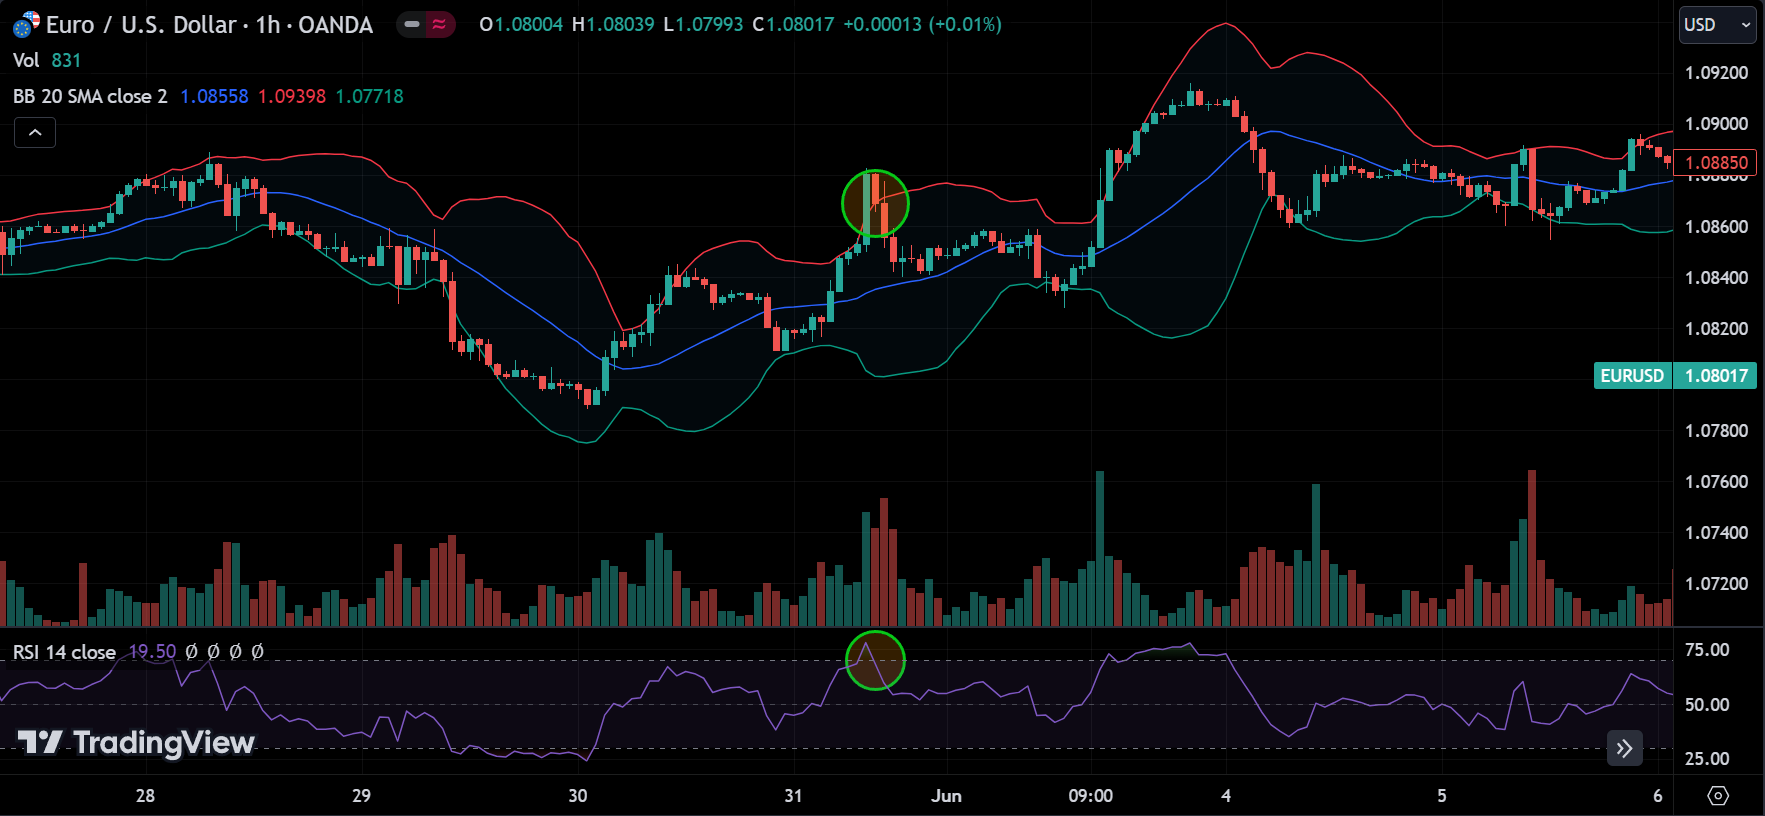
On the other hand, we sell when the RSI moves down from the overbought level, and the price is at or above the upper Bollinger Band, taking profit when the price reaches the middle band. We only take positions when the RSI is between 70 and 30 because prices can stay high or low for a long time, and we don’t want to get caught in a trend. This is an improved version of the Simple RSI Trading Strategy we discussed before.
You can use this Bollinger Bands and RSI trading strategy in any time frame, but it works best in 15-minute, 30-minute, and 1-hour charts. Not all currency pairs will work well with this strategy. EURUSD worked pretty well during my testing, but you can try different pairs to see which ones work best for you.
For the stop loss, it depends on the time frame you’re using. If you’re using a 15-minute chart, a stop loss of around 20 pips is good. For a 1-hour chart, 60 pips is considered safe. However, you should test this because it can change over time. Also, try to place the stop loss above resistance levels and below support levels, where the price is less likely to hit the stop loss due to volatility. Make sure to leave enough space for this.
Trading Plan for Strategy
| STRATEGY | BOLL & RSI |
| TRADING STYLE | DAY-TRADING |
| STRATEGY TYPE | MEAN-REVERSION |
| HOLDING PERIOD | FEW MINS TO CURRENT SESSION END |
| ASSET SELECTION | MAJOR FX PAIRS |
| TIME FRAME | 15M / 30M / 1H |
| ENTRY SIGNAL | RSI Between 70 to 30 and Price Touching Upper or Lower Bollinger Bands |
| ENTRY STYLE | SINGLE MARKET ENTRY |
| TAKE PROFIT SIGNAL | Price Reaching Middle Bollinger Band |
| TAKE PROFIT STYLE | SINGLE LIMIT ORDER |
| POSITION SIZING | SINGLE ENTRY 2% RISK |
| STOP LOSS | 2% RISK, NEAR SUPPORT/RESISTANCE, OVER 15 PIPS |
| BAIL OUT INDICATORS | STONG FUNDAMENTAL NEWS |
If you are unfamiliar with a trading plan and don’t know how to implement it correctly, consider reading those articles.
When I tested this strategy, these parameters worked for me, but the market has changed and will keep changing. You aim to try different settings or methods for these parameters and backtest your Bollinger Bands and RSI trading strategy to see what works for you. Keep testing until you find a trading plan that gives you positive results.
For example, you can use 3 standard deviations for high-probability trades. You can adjust the oversold and overbought levels to your preference. You can take profit just before the middle band or wait until it reaches the upper or lower bands. Try different variations to find what works best and gives you positive expectancy.
Once you find the best setup for your Bollinger Bands and RSI trading strategy and plan, write it down like shown above and follow it every time you trade. This is very important for your trading mindset.
Advantages of this Trading Strategy
- Ease of Use: The RSI Trading strategy is simple, making it accessible for new and experienced traders.
- Versatility: RSI & Bollinger Bands can be applied to various time frames and currency pairs, allowing traders to adapt the strategy to their preferences.
- Standard Deviation: You can adjust the Bollinger Bands’ standard deviation based on your risk tolerance to get more accurate signals.
- Effectiveness in Trending and Range-Bound Markets: While particularly useful in range-bound markets, sometimes this can also be applied to trending markets.
Limitations and Considerations
- False Signals: RSI can generate false signals, especially during strong trending markets where the price continues to rise or fall despite overbought or oversold conditions.
- Lagging Indicator: As a momentum oscillator, RSI can lag behind price movements, potentially causing delays in entry or exit points.
- Volatile Markets: This RSI trading strategy doesn’t work well during sudden market movements, so avoid trading on days with volatile news.
- Standard Deviation: If you use a higher standard deviation for Bollinger Bands, you might miss out on some good trading opportunities.
Disclaimer
The information provided in this article is for educational purposes only and should not be considered financial advice. Trading forex involves significant risk and may not be suitable for all investors. Past performance is not indicative of future results. Always conduct your own research and consider your financial situation before making any trading decisions. Seek advice from a licensed financial advisor if needed.
Conclusion
The Bollinger Bands and RSI trading strategy is a powerful tool for traders seeking to capitalize on market volatility and momentum. By combining these two indicators, traders can identify potential entry and exit points with higher accuracy. However, like all trading strategies, it’s essential to incorporate proper risk management techniques and to backtest the strategy under various market conditions before deploying it in a live trading environment. By doing so, traders can enhance their chances of success in Forex trading.
Hi admin no download link