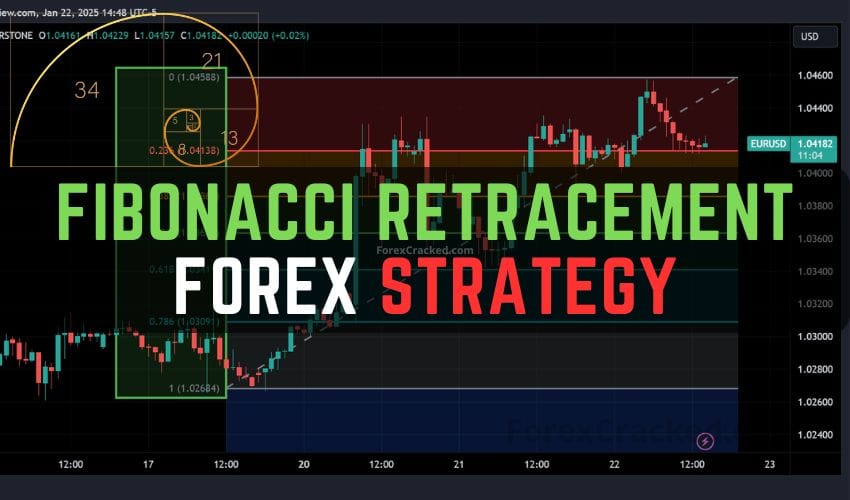
The Fibonacci Retracement Forex Strategy is a powerful tool for traders aiming to enhance precision in their decision-making process. By leveraging the mathematical principles of the Fibonacci sequence, this strategy helps identify potential price levels where trends may pause, reverse, or resume. Whether you’re a beginner or an experienced trader, understanding and applying Fibonacci retracements can improve your ability to pinpoint optimal entry and exit points in the dynamic Forex market. This comprehensive guide will equip you with in-depth knowledge, step-by-step techniques, and actionable strategies to use Fibonacci retracements effectively for consistent trading success.
Table of Contents
Introduction to Fibonacci Retracement in Forex Trading
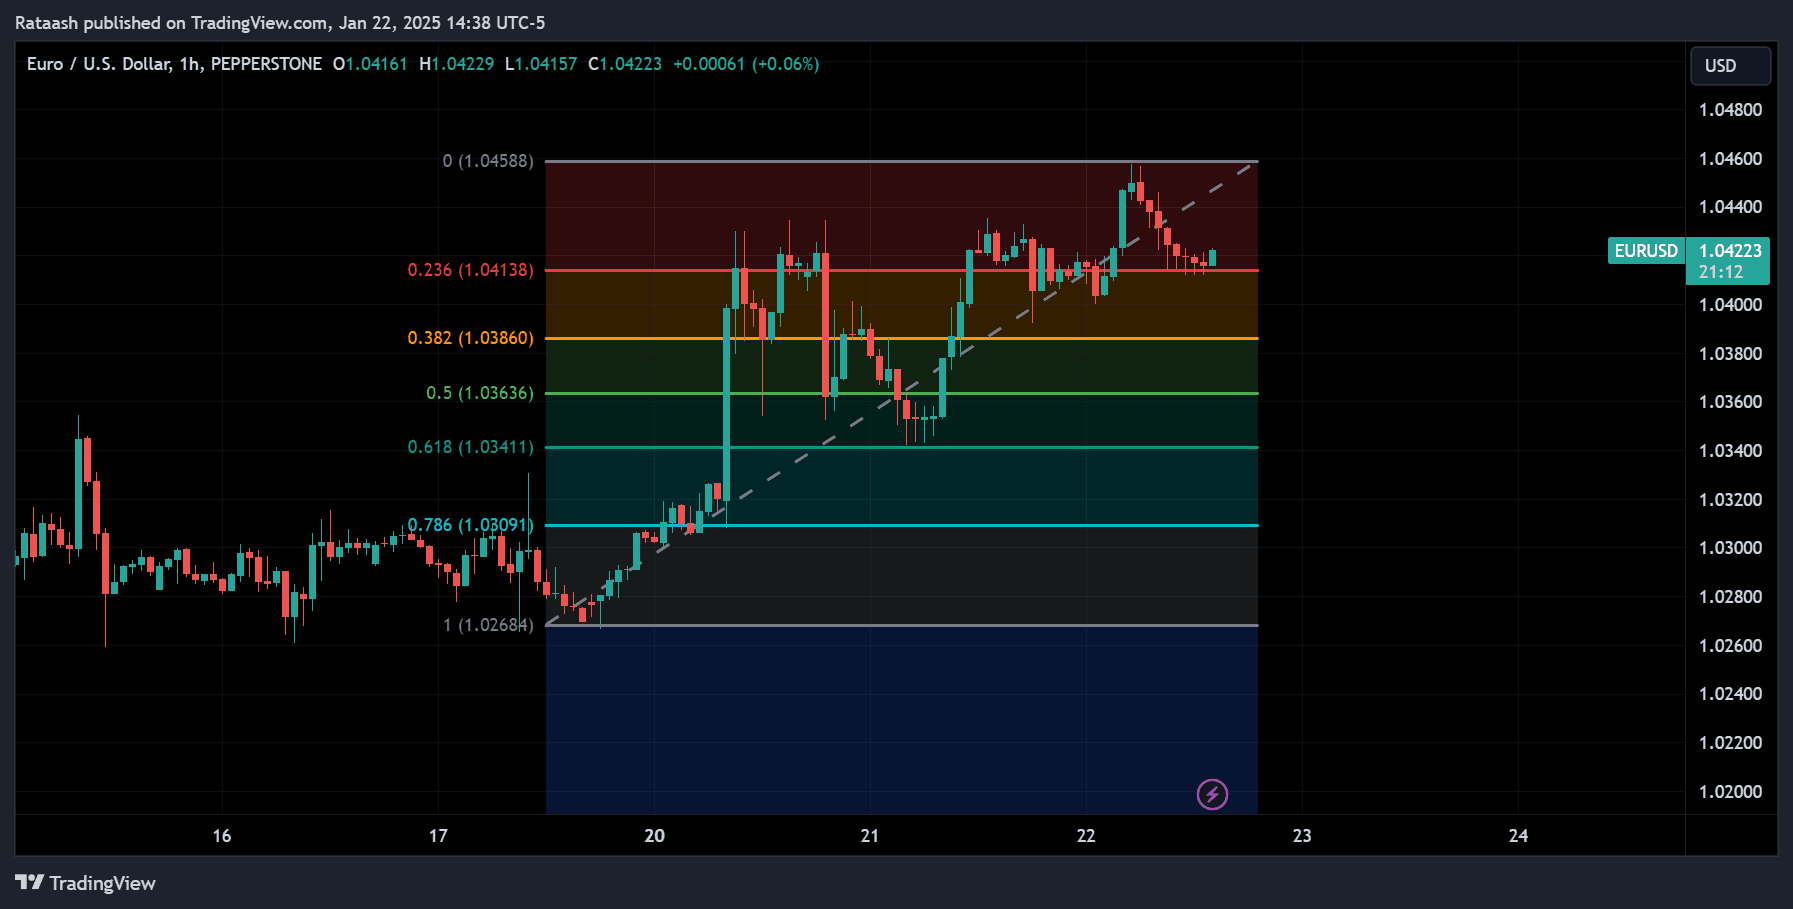
Fibonacci retracement is one of the most popular tools among Forex traders, and for good reason. It offers a systematic way to predict potential support and resistance levels by leveraging the mysterious yet powerful properties of the Fibonacci sequence and the Golden Ratio. Unlike many other technical indicators, Fibonacci retracement does not clutter your screen or lag behind price action. Instead, it provides a clean set of potential price levels where a trend could pause, reverse, or continue.
In Forex trading, identifying precise entry and exit levels is crucial. That’s where Fibonacci retracement levels can truly shine. They not only provide key zones to watch for reversals but also offer traders well-defined spots for stop-loss placements and profit targets. When used correctly, Fibonacci retracements can serve as a roadmap for price action, allowing you to pinpoint your trades more confidently.
However, there’s more to Fibonacci retracements than simply drawing lines on a chart. You need to understand how they work, why they work, and under what conditions they may fail. By the end of this comprehensive guide, you will know how to select the best Fibonacci retracement levels, how to combine them with other technical tools, and how to form a robust trading strategy that fits your style and risk tolerance.
Understanding the Fibonacci Sequence and the Golden Ratio
Before delving deeper into applying Fibonacci retracement levels to Forex charts, let’s explore the origins of this technical tool. Leonardo of Pisa, better known as Fibonacci, was a 13th-century Italian mathematician who introduced a unique sequence of numbers to the Western world. The Fibonacci sequence begins with 0 and 1, and each subsequent number is the sum of the previous two numbers:
0, 1, 1, 2, 3, 5, 8, 13, 21, 34, 55, 89, …
From this sequence, we derive the Golden Ratio (approximately 1.618). The Golden Ratio and its inverse (0.618) often appear in nature, architecture, art, and, interestingly, financial markets. Traders and analysts have long noticed that price movements often respect certain proportions related to Fibonacci numbers, such as 0.382 (38.2%), 0.500 (50%), and 0.618 (61.8%).
Why the Fibonacci Sequence Is Important for Traders
- Natural Proportions: The ratio 1.618 (and its derivatives like 0.382, 0.618, etc.) shows up repeatedly in natural phenomena and in patterns of human behavior. Because market movements are partly driven by human psychology, these levels often become self-fulfilling prophecies for price retracements.
- Identification of Support/Resistance: Traders use these Fibonacci levels to anticipate where support or resistance might form. This becomes particularly valuable in trending markets where retracements occur before the price resumes its primary trend.
- Versatile Application: Fibonacci retracement levels can be used across different time frames (daily, 4H, hourly, etc.) and different currency pairs. The method is widely accepted, which increases its reliability.
Understanding this background helps you realize that Fibonacci retracements aren’t just random lines on your chart. They’re part of a centuries-old mathematical discovery that continues to guide modern technical analysis.
Why Fibonacci Retracement Levels Matter in Forex
Forex markets are known for their high liquidity and volatility, making them a perfect arena for applying Fibonacci retracements. Because currency pairs often experience significant price swings, identifying the levels where price corrections might end can offer a significant advantage.
- Precision in Entry and Exit – Fibonacci retracement lines act like a map. When the price begins to pull back from a significant move, Fibonacci levels can point you to where the price might bounce or reverse. This precision is invaluable for timing entries and exits.
- Visual Aid – The Fibonacci retracement tool is easy to use. It lays out horizontal lines on your chart, offering clear potential support and resistance zones. These lines help reduce guesswork, allowing you to visually gauge which levels are likely to hold.
- Confluence With Other Indicators – Fibonacci retracements are even more powerful when used in confluence with other technical analysis tools—like trend lines, moving averages, and candlestick patterns. Confluence means multiple indicators or signals pointing to the same level, increasing the probability that the price will react there.
- Versatility Across Time Frames – Whether you are a scalper, day trader, or swing trader, Fibonacci retracements can be adapted to your preferred time frame. They can help identify short-term pullbacks as well as long-term turning points.
Ultimately, Fibonacci retracement levels matter because they provide structure in a sometimes chaotic market. By applying this tool properly, traders can better anticipate potential turning points, manage risk, and improve their overall success rate.
Key Fibonacci Retracement Levels Explained
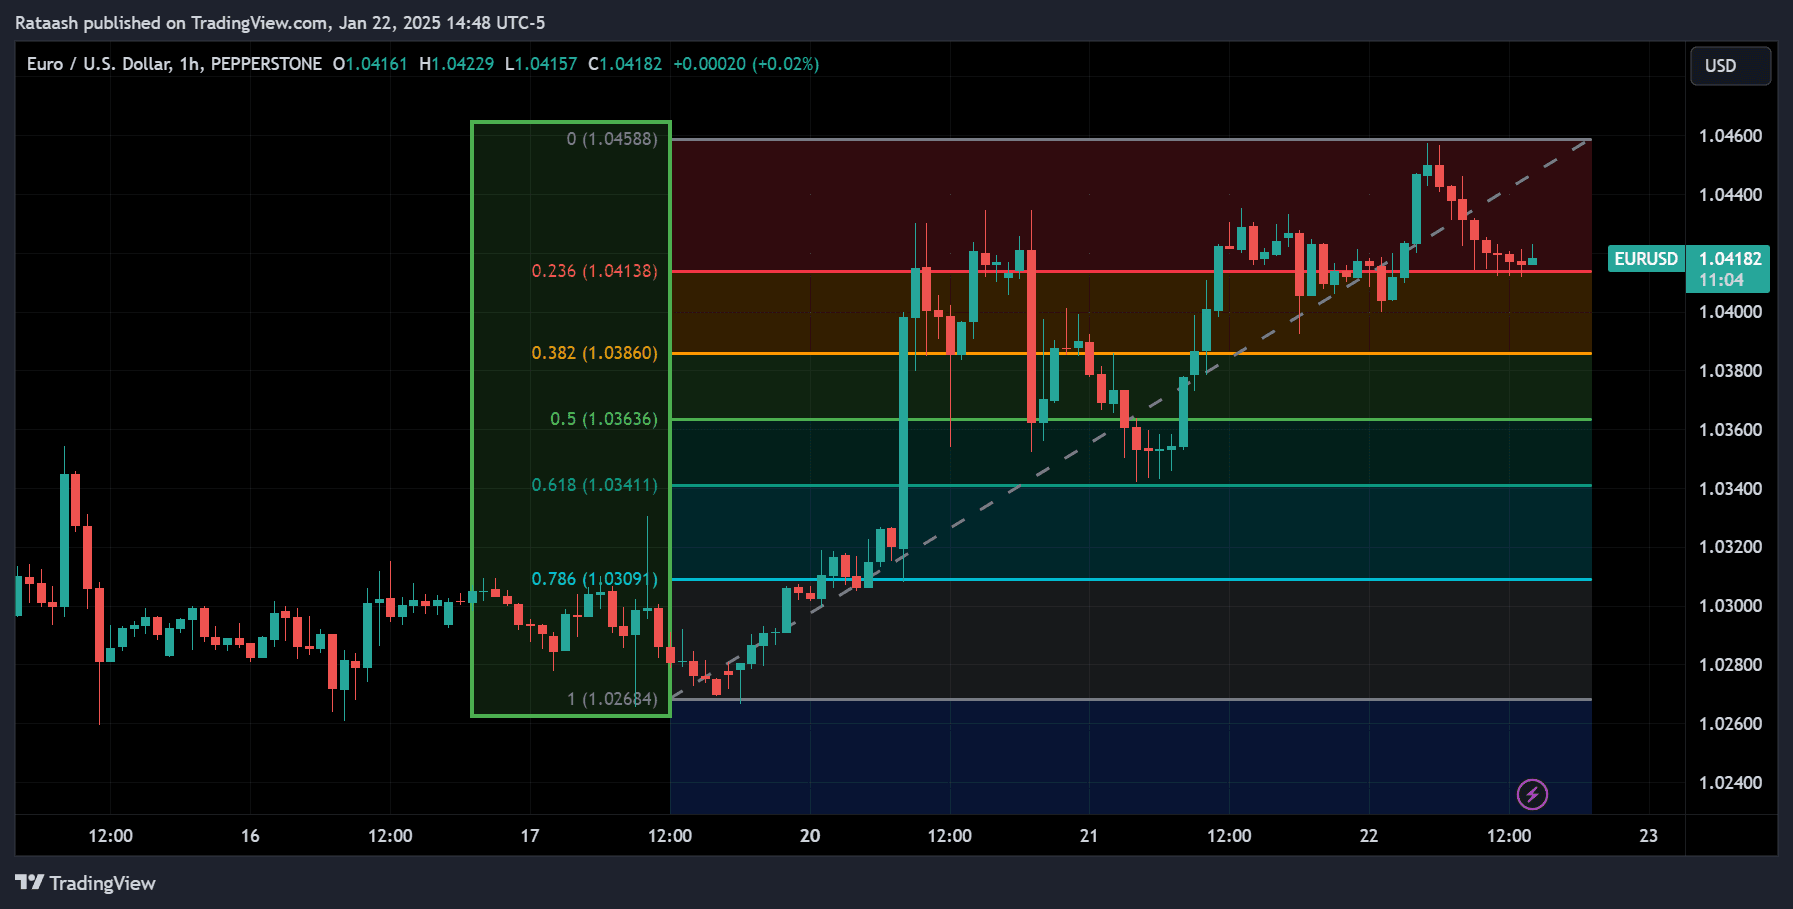
There are several commonly used Fibonacci retracement levels in Forex trading, each representing a fraction of the prior move. While some traders focus on only a few key levels, others prefer to plot multiple levels to catch potentially smaller or deeper retracements. Below are the primary Fibonacci retracement levels you will see on most trading platforms:
23.6% Retracement Level
- Definition: This level represents about one-quarter of the prior move.
- Significance: It often marks shallow pullbacks in a strong trend. When the market is trending strongly, the price may not retrace deeply before resuming in the trend’s direction.
- Usage: Some traders use the 23.6% level as a gauge for strong momentum. If the price only retraces to 23.6% before bouncing, it’s a sign of a robust trend.
38.2% Retracement Level
- Definition: This level is roughly a third of the prior move.
- Significance: The 38.2% level is viewed as a common spot for moderate pullbacks, especially in uptrends.
- Usage: When price corrects to this level and shows bullish (or bearish in a downtrend) reversal signals, many traders interpret it as a sign the original trend will likely continue.
50% Retracement Level
- Definition: While 50% is not a classical Fibonacci ratio, it is widely used by traders as a psychological midpoint.
- Significance: It suggests that the market has undone half of its previous move, which often signifies a key zone for potential reversals.
- Usage: This level is popular for placing limit orders or for partial profit-taking, particularly if the trader anticipates a bounce from this halfway mark.
61.8% Retracement Level
- Definition: This is the inverse of the Golden Ratio (which is approximately 1.618).
- Significance: The 61.8% level is one of the most observed retracement levels in all forms of technical analysis.
- Usage: Traders look for strong reactions here because a bounce or break below (or above in a downtrend) the 61.8% line can signal the difference between trend continuation and a deeper reversal.
78.6% (and 76.4%) Retracement Levels
- Definition: Another deeper Fibonacci retracement level that is close to the square root of 61.8%.
- Significance: If the price has retraced this far, some traders see it as a sign that the trend might be weakening. However, strong price moves can still find support or resistance around this level before resuming the original trend.
- Usage: This level is more nuanced. Often, advanced traders look for confluence at 78.6% with other indicators or patterns because the market is either nearing a full retracement or is setting up a double-bottom/double-top scenario.
88.6% Retracement Level
- Definition: A deeper retracement that is derived from the further manipulation of the Fibonacci ratios.
- Significance: This level is close to a complete reversal of the original move. If a trend is still going to hold, the price must bounce here or risk invalidating the prior trend move.
- Usage: Traders who prefer deep discount entries (in the case of an uptrend) or premium entries (in the case of a downtrend) might look at this level, but it requires careful analysis and usually a strong confirming signal.
How to Draw Fibonacci Retracement Levels on a Forex Chart
The accuracy of Fibonacci retracement analysis largely depends on how you draw the tool. The basics are the same across most charting platforms—MT4, TradingView, NinjaTrader, etc. Here’s the process:
1. Identifying a Swing High and Swing Low
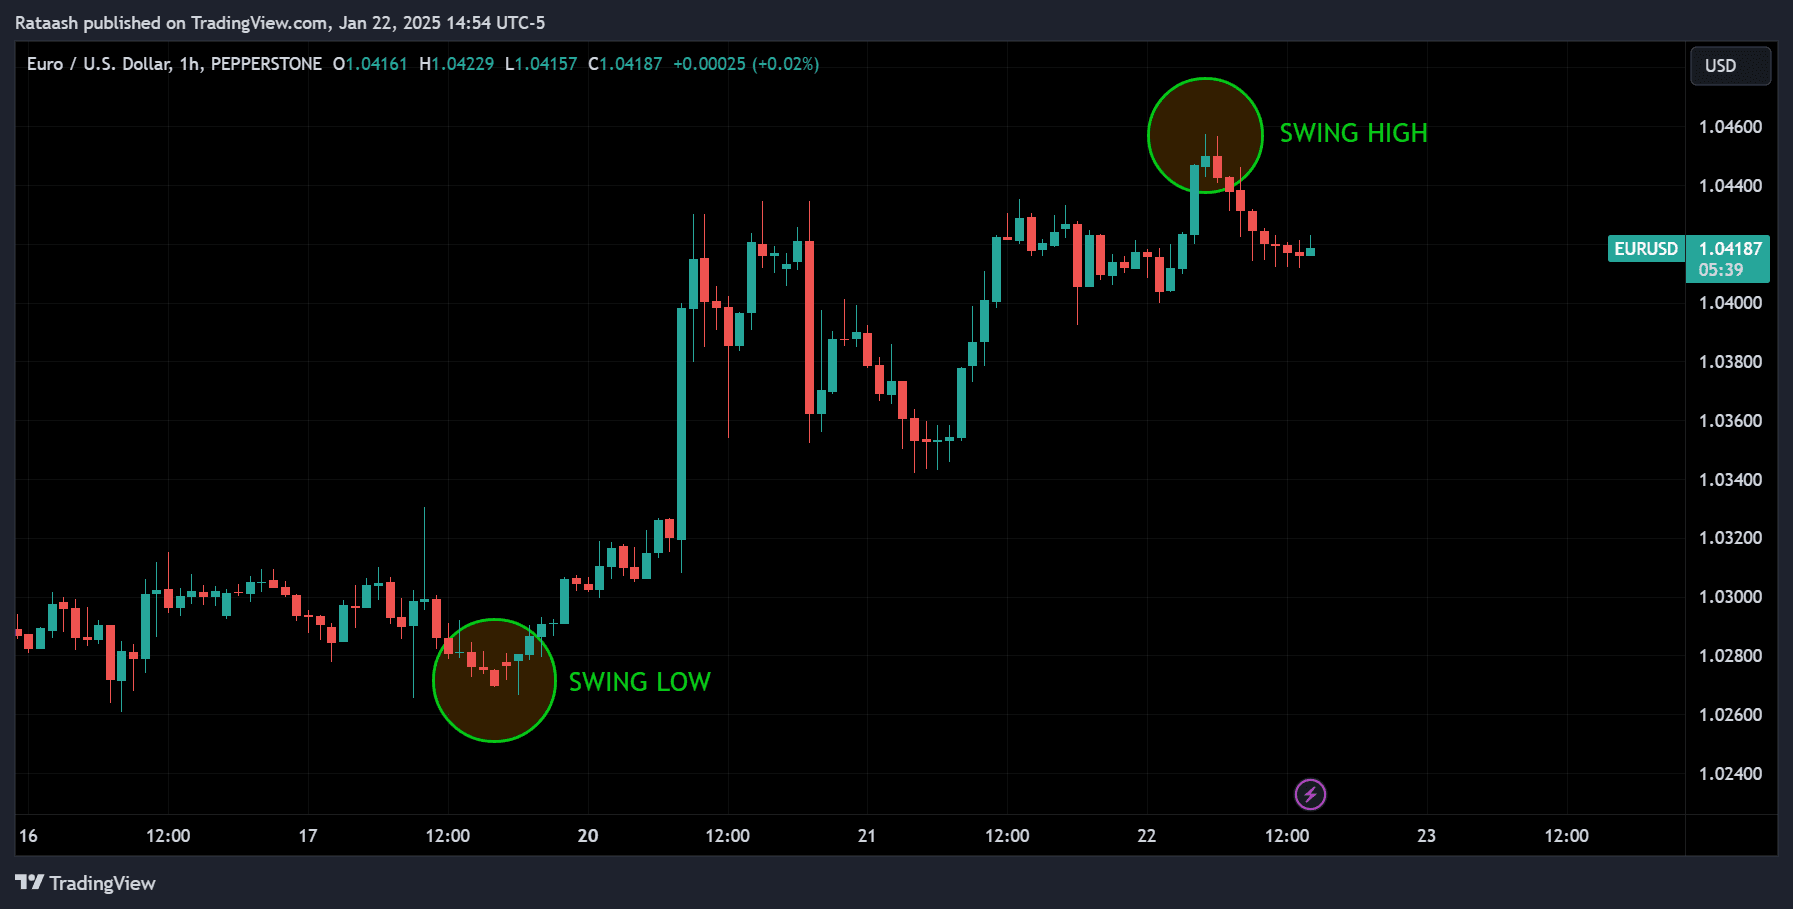
- Swing High: This is a peak on the chart where the price has stopped rising and started falling. Visually, it’s the highest point in a particular price wave.
- Swing Low: This is the trough where the price has stopped falling and started climbing. It’s the lowest point in a particular price wave.
For an uptrend, you’ll typically draw Fibonacci retracement from the most recent significant Swing Low to the Swing High.
For a downtrend, you draw it from the Swing High to the Swing Low.
2. Drawing the Retracement Tool Correctly
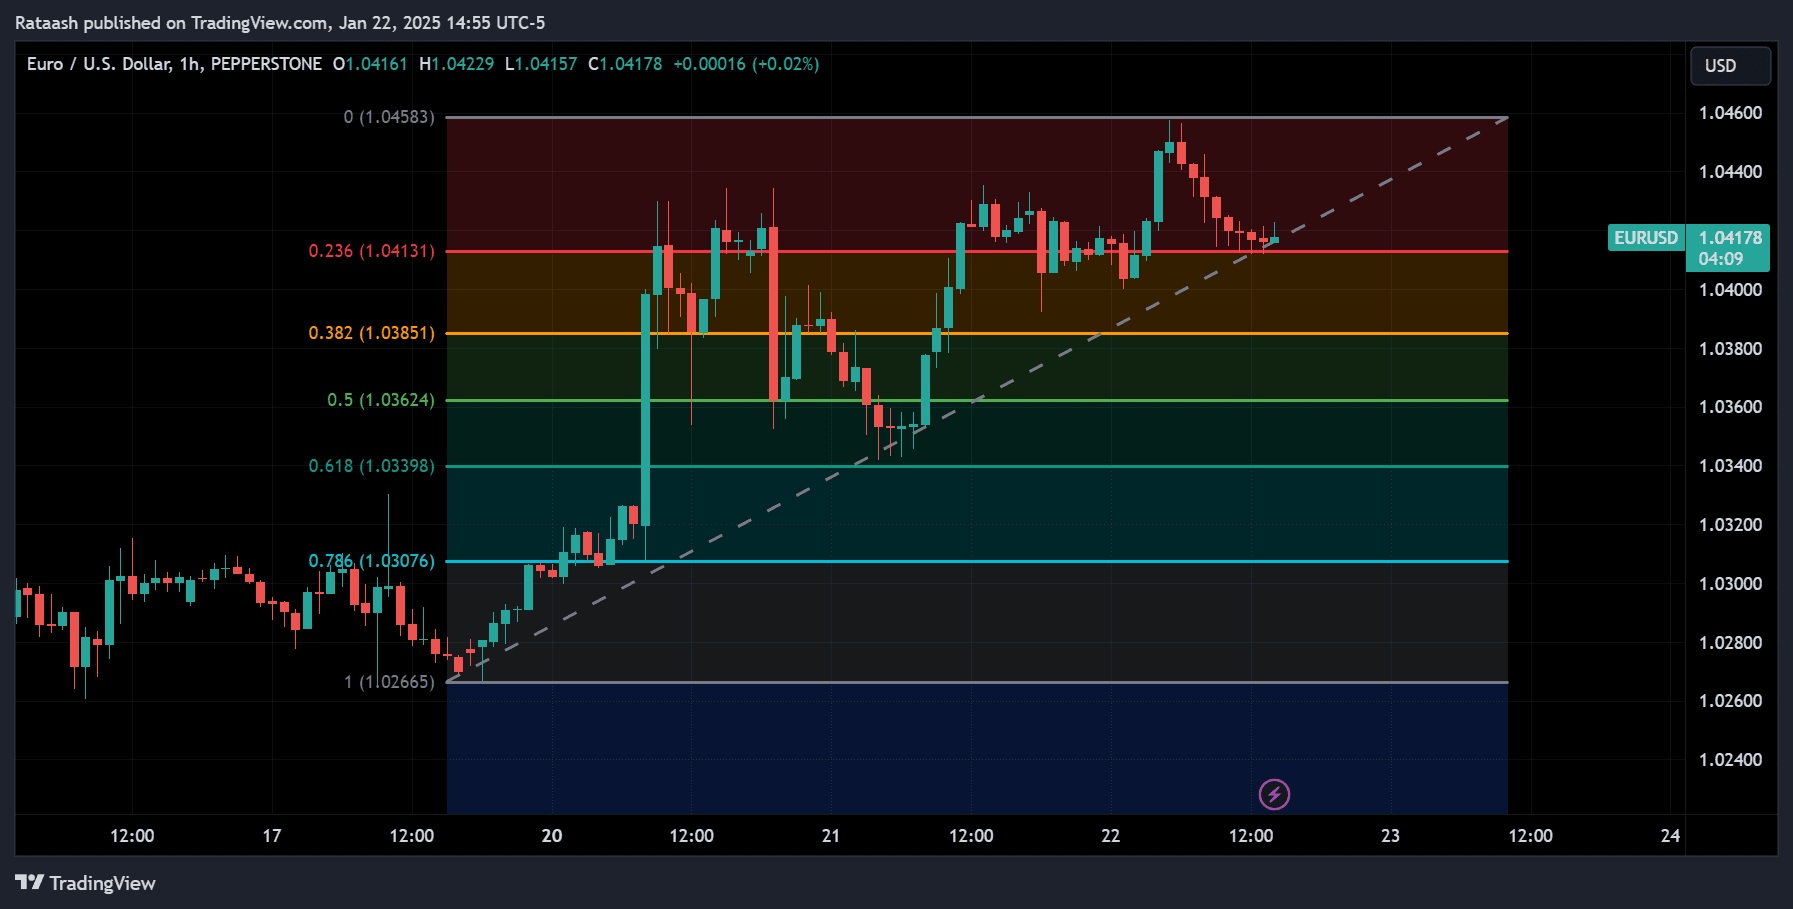
- Select the Fibonacci Retracement Tool on your charting platform.
- Click on the swing low or high where you want to start.
- Drag the tool to the opposite swing, ensuring you capture the most significant recent price wave.
- Release the mouse (or lift your finger) to finalize the placement. Your charting software will automatically draw the corresponding Fibonacci retracement levels (23.6%, 38.2%, 50%, 61.8%, 78.6%, etc.) between the two points.
3. Practical Tips for Accuracy
- Use Significant Swings Only: Avoid small, inconsequential bumps in price. Focus on prominent swing points that stand out on the chart.
- Consistency: If you’re trading on the 4-hour time frame, use swing points that are clearly visible on that time frame. Don’t mix short-term swing points with long-term ones if you intend to hold positions for days.
- Multiple Time Frame Analysis: Consider applying Fibonacci on the higher time frame (like daily or weekly) to identify major levels, then zoom into a lower time frame (4-hour or 1-hour) for finer entries.
- Confluence Zones: Watch for areas where multiple Fibonacci levels or other technical features overlap. A cluster of levels often proves stronger.
Drawing Fibonacci retracements is straightforward, but the challenge lies in choosing the correct swing points and interpreting the levels. Practice drawing retracements on historical charts to get a feel for how price reacts at each Fibonacci level.
Combining Fibonacci Retracements With Other Tools
Fibonacci retracements rarely work well in isolation. They become significantly more reliable when used alongside other forms of technical analysis. This process is known as confluence, where multiple indicators or chart patterns suggest the same potential outcome.
1. Trend Lines and Support/Resistance
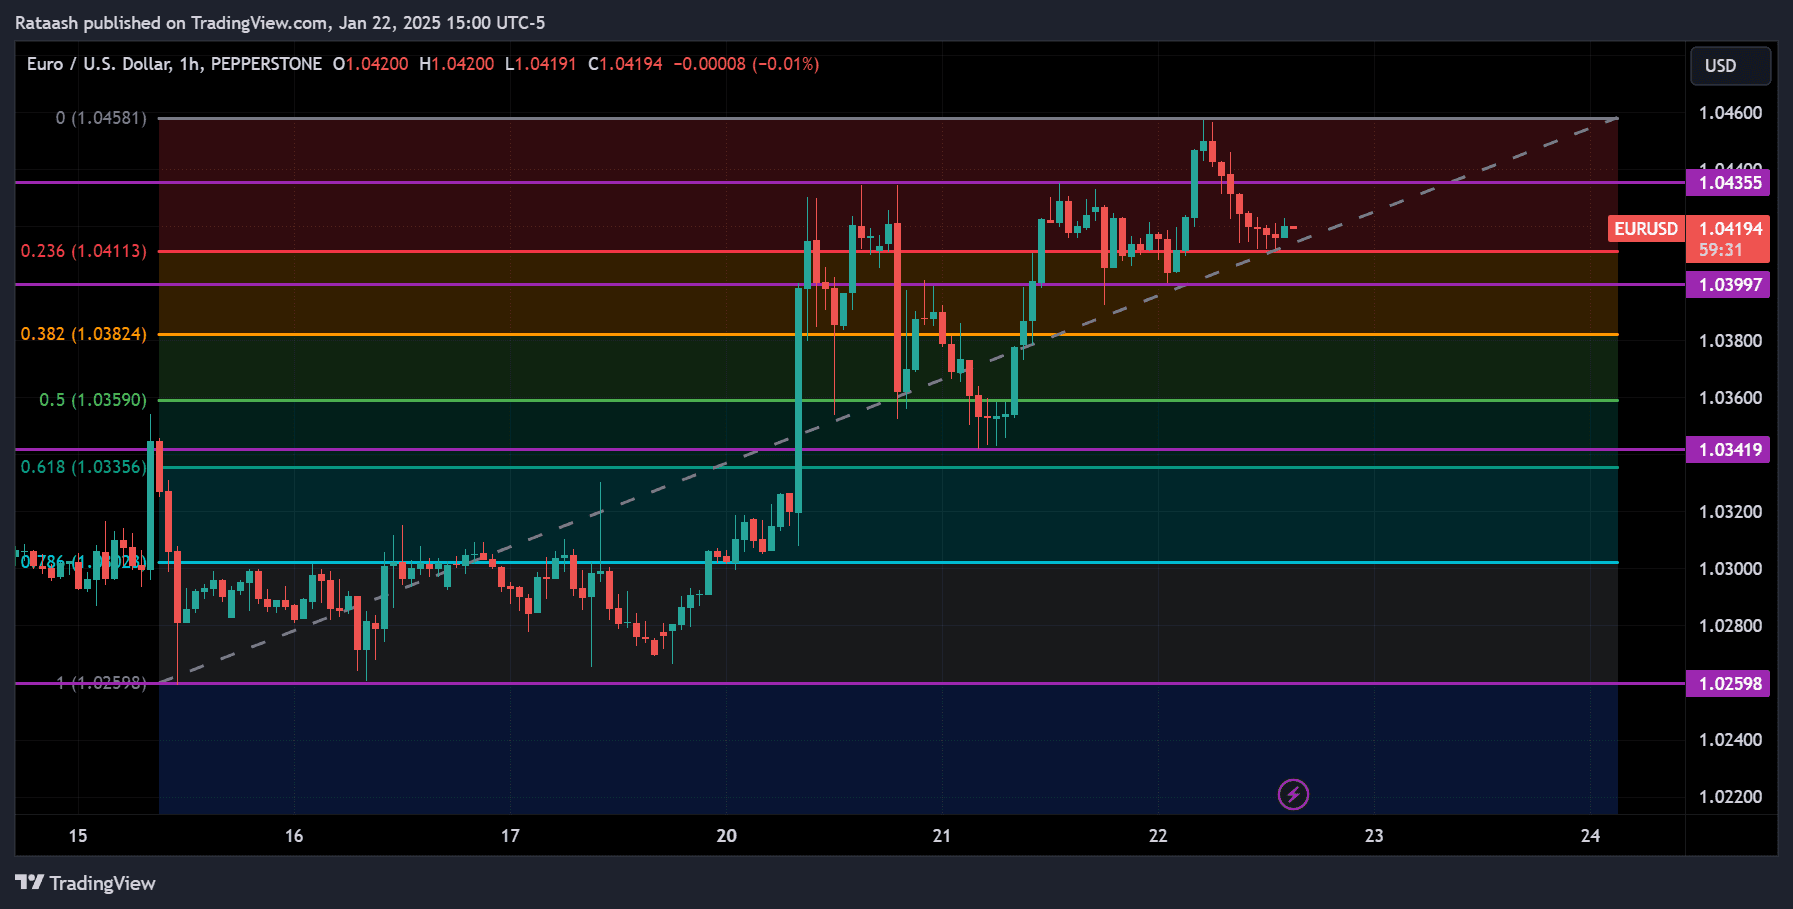
- Trend Lines: Draw diagonal lines that connect two or more swing highs or swing lows. If a Fibonacci level coincides with a trend line, that level gains importance.
- Horizontal Support/Resistance: Mark past support or resistance levels. If a Fibonacci retracement aligns with a historical support or resistance line, it’s more likely to hold.
2. Candlestick Patterns
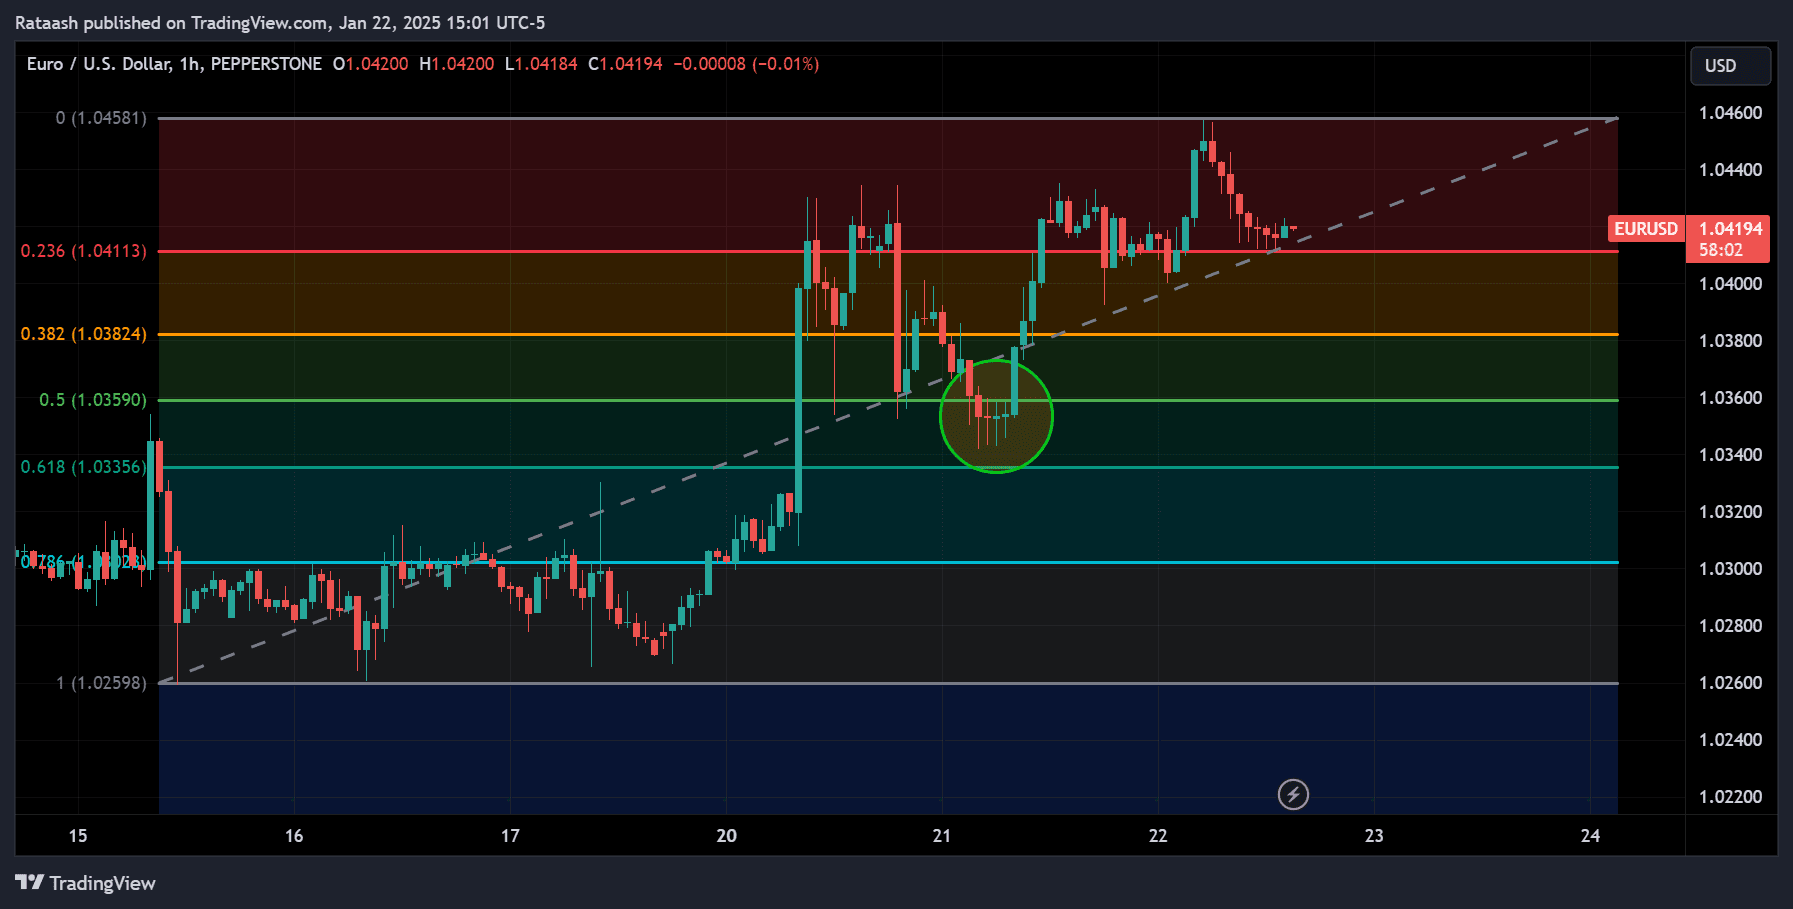
- Reversal Candlestick Patterns: Look for pin bars, doji, or engulfing candles forming at Fibonacci retracement levels. These candlestick signals can confirm that the market is respecting that level.
- Continuation Patterns: Sometimes the market will form bullish or bearish continuation candles at significant Fibonacci retracement points, indicating a resumption of the trend.
3. Moving Averages
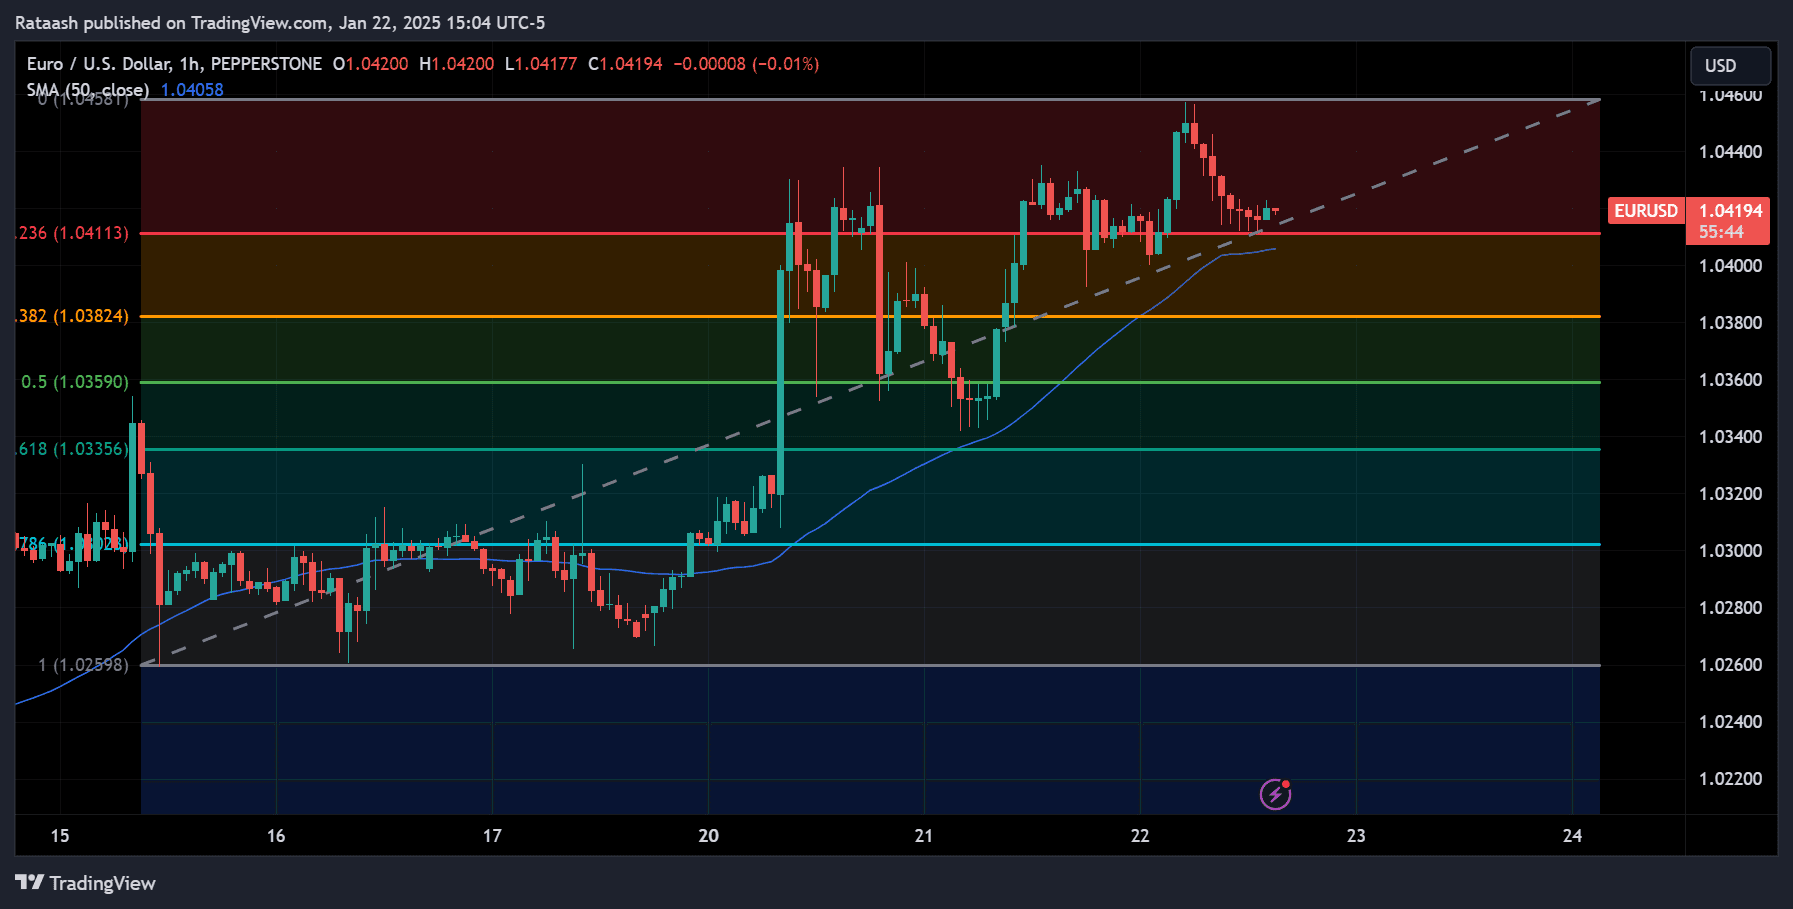
- Dynamic Support/Resistance: A 50-day or 200-day simple moving average can also act as support or resistance. If this moving average lines up with a Fibonacci level, it increases the probability of a bounce or reversal.
- Crossover Signals: Moving average crossovers can provide additional context. For instance, if a short-term MA crosses above a long-term MA near a Fibonacci level, it may signal a stronger bullish reversal.
4. RSI and MACD Confluence
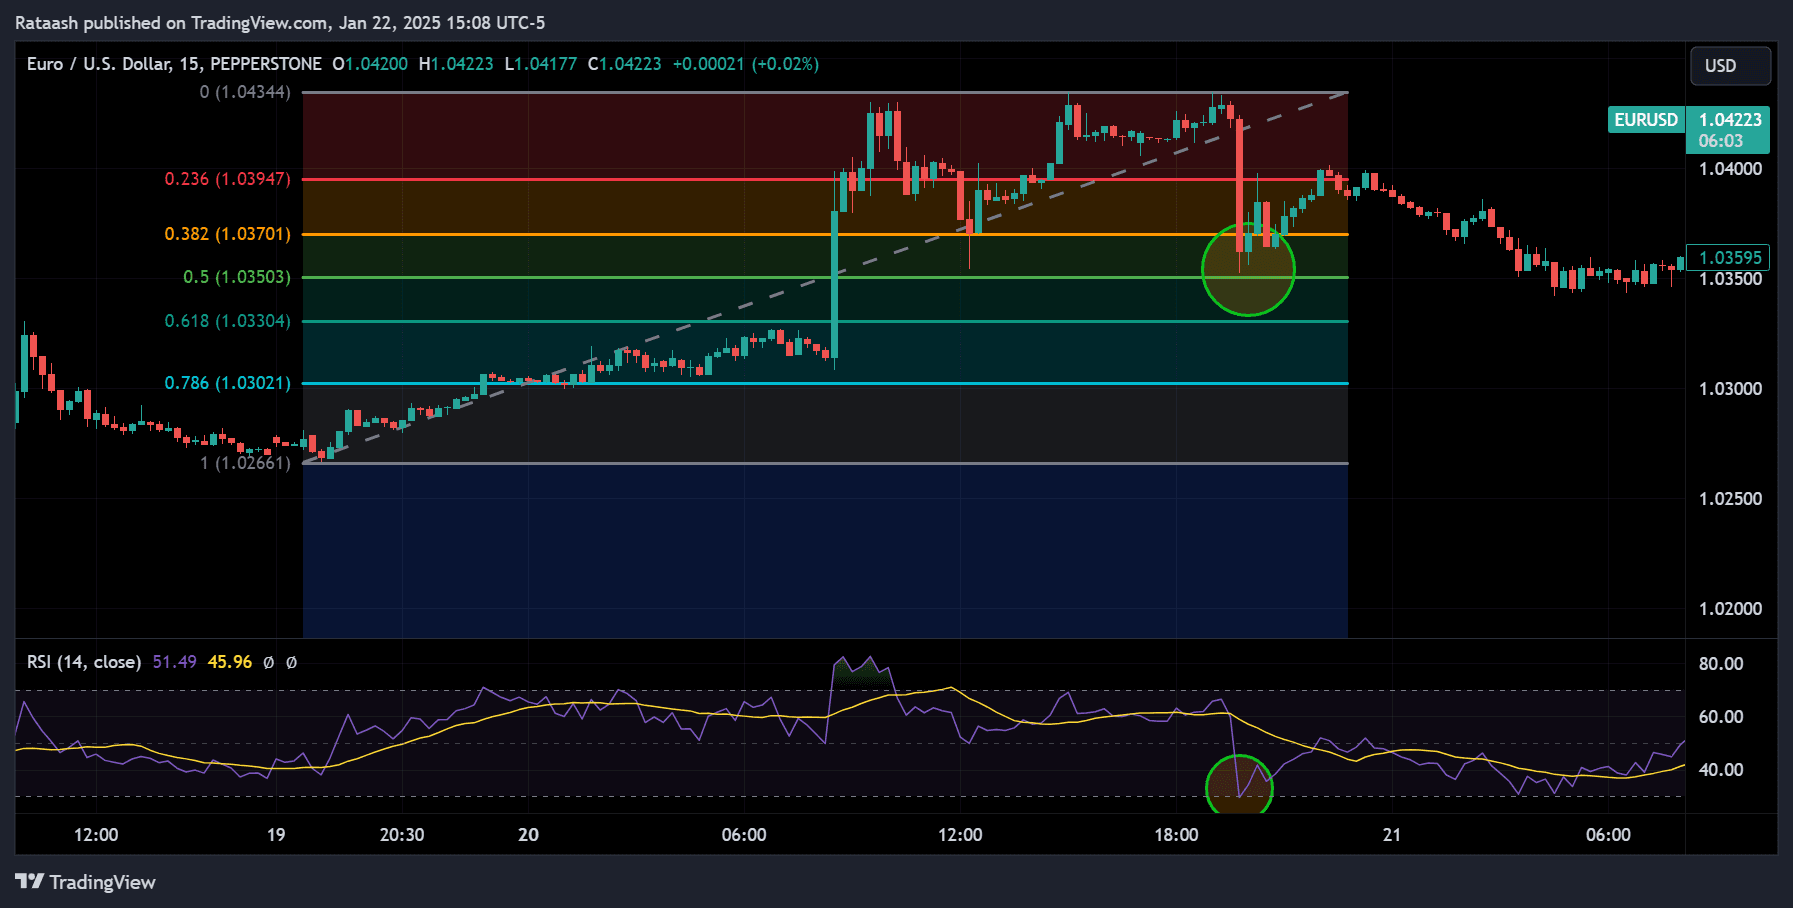
- RSI: The Relative Strength Index helps you spot overbought or oversold conditions. If the price pulls back to a Fibonacci level and the RSI transitions from oversold to rising, that’s a bullish sign.
- MACD: Look for bullish or bearish divergences on the MACD when price approaches a Fibonacci retracement. A bullish divergence at a key Fibonacci support can strengthen the case for a reversal.
When these tools line up at a Fibonacci retracement level, it boosts confidence in the trade. However, remember that confluence is not a guarantee it merely increases the probability of a successful outcome.
Fibonacci Retracement Forex Strategies

There are various ways to incorporate Fibonacci retracements into your trading plan. Below are some of the most common strategies that focus on pinpointing entry and exit levels in Forex.
A. Trend Continuation Strategy
- Identify the Primary Trend: Is the currency pair in an uptrend or downtrend? Analyze the larger time frame (daily or 4-hour) to confirm.
- Wait for a Retracement: As the price retraces from a swing high or swing low, apply Fibonacci retracements to the most recent impulsive move.
- Look for Confluence: If a key Fibonacci level (38.2%, 50%, or 61.8%) coincides with a trend line or support/resistance zone, it’s a strong sign.
- Enter on Confirmation: Use candlestick patterns or oscillator signals to confirm the price is likely to bounce. Place a buy order (in an uptrend) or a sell order (in a downtrend) at or near the Fibonacci level.
- Stop-Loss Placement: Usually goes below the swing low (for a buy) or above the swing high (for a sell). Aim to keep a positive risk-reward ratio—at least 1:2 or better.
- Take Profit: You can use the next Fibonacci extension level (127.2% or 161.8%) or a prior swing high/low as a target.
B. Range Trading Strategy
- Identify the Range: The market is neither making higher highs nor lower lows but oscillating between a horizontal support and resistance.
- Apply Fibonacci in the Range: Even within a range, the price often respects Fibonacci retracements on smaller moves.
- Look for Overlaps: If 50% or 61.8% lines up with range support or resistance, that’s a cue to enter.
- Use Oscillators: Stochastic or RSI can help confirm overbought or oversold conditions in a range. Enter near support when the market is oversold and exit near resistance—or vice versa.
- Stop-Loss Placement: Beyond the range boundaries (above resistance or below support).
- Profit Target: Opposite end of the range, or partial profits at intermediate Fibonacci lines within the range.
C. Breakout and Pullback Strategy
- Wait for a Breakout: A currency pair breaks a significant support or resistance level.
- Identify the Breakout Swing: Mark the high/low before the breakout and the peak of the breakout move.
- Apply Fibonacci: If the price pulls back, see which Fibonacci levels might offer a retest of the broken line.
- Enter on Retest: Often, the 38.2% or 50% retracement aligns with the previous breakout area. If the breakout is genuine, the price should hold this retest and continue in the breakout direction.
- Stop-Loss Placement: Place it below the breakout area or the next Fibonacci level to protect against false breakouts.
- Target: The next major support/resistance or a Fibonacci extension like 161.8%.
D. Fibonacci Extensions for Profit Targets
While this guide focuses on retracements, it’s also important to note Fibonacci extension levels, such as 127.2%, 161.8%, 200%, and more. These levels are used to project where the price may head next after a retracement. If you entered on a Fibonacci retracement, you can place your take profit near one of the extension levels, especially if it coincides with other forms of technical confluence.
Pinpointing Entry and Exit Levels
Pinpointing entry and exit levels using Fibonacci retracement levels is both an art and a science. Here are detailed guidelines to help you refine your approach.
1. Optimizing Entry Points With Confluence
- Wait for Candlestick Confirmation: A bullish engulfing, hammer, or piercing line at a Fibonacci support can confirm a buy entry. For sell entries, look for bearish engulfing, shooting star, or dark cloud cover at a Fibonacci resistance.
- Check Volume (If Available): Volume spikes near a Fibonacci level can hint at institutional participation. This is particularly relevant in stock or futures markets, but Forex volume indicators provided by brokers can still offer some insight.
- Verify Momentum: Use RSI, Stochastic, or MACD to ensure that momentum isn’t heavily against your trade idea. For instance, a deeply oversold RSI at a 61.8% Fibonacci support is a bullish sign.
2. Setting Target Profit Levels
- Nearby Swing High/Low: This is often the first level to watch. If the price respects that swing again, you might take partial profits.
- Fibonacci Extension: Levels like 127.2% and 161.8% of the original move can serve as excellent take-profit targets.
- Trailing Stop: For traders who like to ride trends, consider a trailing stop approach moving your stop-loss below higher lows (in an uptrend) or above lower highs (in a downtrend) as the price moves in your favor.
3. Placing Stop-Loss Orders
- Below/Above the Swing: A common technique is to place your stop-loss a few pips below the swing low (for a buy) or above the swing high (for a sell).
- Beyond the Next Fibonacci Level: For more conservative traders, place stops beyond a deeper Fibonacci line. If the price breaks multiple Fibonacci levels, the trade idea might be invalid.
- ATR-Based Stops: Some traders use the Average True Range (ATR) to gauge volatility and add that distance to their stops to avoid getting whipsawed by normal price fluctuations.
Pinpointing entries and exits effectively requires practice and experience. Don’t be discouraged by early mistakes. Keep detailed trade journals to study how price reacted at certain Fibonacci levels and refine your approach over time.
Risk Management and Position Sizing
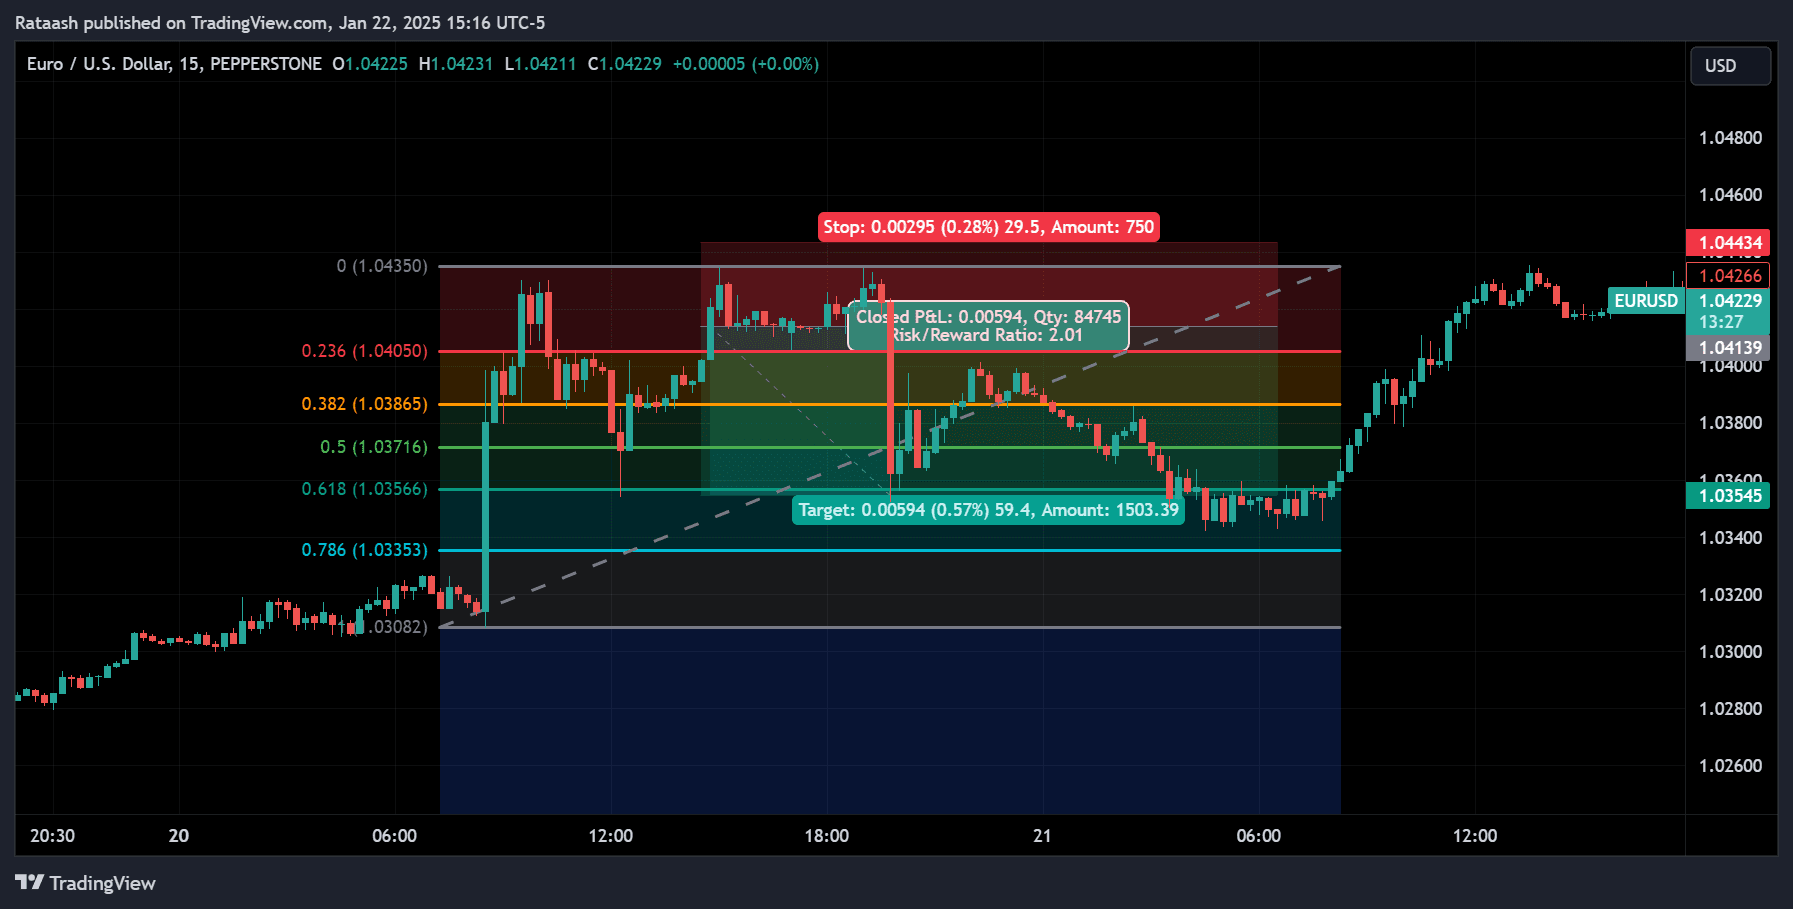
Risk management is often the dividing line between successful traders and those who eventually blow their accounts. Even the best analysis can fail if the market decides to do something unexpected. Fibonacci retracement levels can assist with risk management, but only if you use them properly.
1. Using Fibonacci Levels to Determine Risk-Reward Ratios
- Risk-Reward Ratio (RRR): This is the ratio between the amount you’re willing to risk and the potential profit you aim to gain. A 1:2 RRR means you risk 1% to gain 2%.
- Identify Clear Stop and Target: With Fibonacci, your stop is often located beyond a certain retracement (e.g., 61.8%) or beyond the swing high/low. Your target could be another retracement or an extension level.
- Ensure Acceptable RRR: If the target is 50 pips away and your stop is also 50 pips away, you have a 1:1 RRR. Ideally, aim for at least 1:1.5 or 1:2 to ensure you can absorb losing trades and still come out ahead over a series of trades.
2. Stop-Loss Placement for Enhanced Safety
- Wide vs. Tight Stops: Too tight a stop might result in quick losses due to normal price noise. Too wide a stop might reduce your RRR or increase your risk. Strive for a balance based on market volatility.
- Use Confluence: Placing a stop just under a confluence of Fibonacci retracements, trend lines, or moving averages often provides an extra layer of protection.
- Adjust for News: Major economic releases can cause large, sudden moves. Either tighten stops or close positions if the trade is not near your target before a high-volatility event.
Risk management should be approached systematically. Never risk more than you can afford to lose on any single trade many professional traders limit each trade to 1-2% of their account capital.
Common Mistakes and How to Avoid Them
Even seasoned traders can fall prey to errors when using Fibonacci retracements. Here are some pitfalls to watch for:
- Incorrect Swing Points: Choosing minor or irrelevant swing highs/lows leads to inaccurate levels. Always pick the most significant swings on the time frame you’re trading.
- Over-Reliance on a Single Tool: Using Fibonacci retracements alone can be risky. Integrate other forms of technical or fundamental analysis for better confluence.
- Ignoring Trend Context: Applying Fibonacci retracements in a sideways or choppy market without first identifying a clear trend often results in confusion and false signals.
- Forgetting Risk Management: A perfect Fibonacci setup can still fail. Always set a stop-loss and plan your trades around a sensible risk-reward ratio.
- Forcing Trades: Just because a Fibonacci level exists doesn’t mean the market will bounce there. Wait for confirmation.
- Not Practicing: Trading with Fibonacci levels effectively requires screen time and practice. Use a demo account or backtesting tools to refine your entry and exit tactics before going live.
Practical Example of a Fibonacci Retracement Trade
To illustrate how Fibonacci retracement might be used in a real-world scenario, let’s walk through a hypothetical trade example on the EUR/USD pair. Assume we’re looking at a 4-hour chart.
Step-by-Step Chart Analysis
- Identify Trend: The 4-hour chart shows a clear uptrend, with higher highs and higher lows.
- Most Recent Impulsive Move: The price has just completed a strong move from 1.0800 (Swing Low) to 1.1000 (Swing High).
- Draw Fibonacci: We select the Swing Low at 1.0800 and drag up to the Swing High at 1.1000. The key retracement levels appear at 1.0962 (23.6%), 1.0945 (38.2%), 1.0900 (61.8%), and so forth.
Monitoring the Trade
- Price Pullback: The price begins to pull back from 1.1000. We watch how it reacts at each Fibonacci level.
- Candlestick Confirmation: At the 38.2% level (around 1.0945), a bullish pin bar forms, with a long lower wick touching that retracement level. RSI on the 4-hour chart is above 50 but not overbought, suggesting continued bullish momentum.
- Entry Trigger: We enter a long position at 1.0945, anticipating the uptrend will continue from this Fibonacci support.
Trade Management and Exit
- Stop-Loss Placement: Place a stop-loss about 20 pips below the pin bar’s wick, around 1.0925. That’s also beneath the 50% retracement level, adding a layer of protection.
- Profit Target: We decide to target the previous swing high at 1.1000 initially. If the price breaks above that, we may let part of the position ride to a Fibonacci extension at 1.1050 (127.2% extension).
- Outcome: Price bounces from 1.0945 and heads to 1.1000, hitting our first profit target. We close half the position, move our stop-loss to break even, and hold the rest for a potential extension move.
This is a textbook example, and not all trades will be this clean. Nonetheless, it demonstrates how to identify a trend, draw Fibonacci, wait for confluence signals, and manage the trade throughout its lifecycle.
Advanced Tips for Mastering Fibonacci Retracements
For traders looking to elevate their Fibonacci retracement skills, consider the following advanced tips:
Multiple Time Frame Alignment
- Check Fibonacci levels on the weekly or daily chart for major zones.
- Zoom into the 4-hour or 1-hour chart to refine your entries.
- Look for overlaps of Fibonacci levels from different time frames—major confluence often signals a strong support or resistance area.
Fibonacci Clusters
- Draw multiple Fibonacci retracements on overlapping price swings.
- Identify “clusters” or “zones” where several Fibonacci levels (from different swings) overlap within a small price range. These clusters often act as powerful reversal zones.
- Patterns like Gartley, Bat, Crab, and Butterfly heavily rely on Fibonacci measurements. Understanding these can help you spot high-probability reversal setups.
- For instance, a Gartley pattern involves retracements to 61.8% and 78.6% in specific sequences.
- Traditional pivot points can add another dimension to Fibonacci-based strategies. If a Fibonacci retracement aligns with a pivot level or camarilla pivot, it may serve as an especially high-probability zone.
Fibonacci Time Zones
- While less commonly used, Fibonacci time zones can provide insight into when a market might reverse or consolidate. By placing vertical lines at Fibonacci-based intervals, you may gain clues about the timing of price moves in addition to their magnitude.
Psychological Levels
- Price levels such as 1.1000, 1.2000, or 1.0000 in EUR/USD often act as psychological magnets. If a Fibonacci retracement lines up near such a big round number, it’s an extra factor to consider.
- Mastering Fibonacci retracements is not about memorizing every ratio. Instead, it’s about understanding which levels are most relevant to your trading style, how to combine them with other tools, and how to manage your trades effectively.
Conclusion
Fibonacci retracement is a robust, time-tested tool that can help Forex traders pinpoint entry and exit levels with remarkable accuracy. Its foundation lies in the Fibonacci sequence and the Golden Ratio, which appear frequently in both nature and financial markets. By drawing retracement levels between significant swing highs and lows, traders can identify potential support and resistance zones where price might bounce or reverse.
However, success with Fibonacci retracements doesn’t come from these lines alone. To truly harness their power, combine them with trend analysis, candlestick patterns, moving averages, momentum oscillators, and other forms of confluence. Always pay close attention to risk management, ensuring you have a solid stop-loss strategy, a well-defined risk-reward ratio, and a keen understanding of position sizing.
While the examples in this guide illustrate the concepts, the real skill comes from practice and experience. Spend ample time backtesting your Fibonacci strategies and refining your approach in a demo environment before going live. With the right methodology, discipline, and patience, Fibonacci retracements can become a cornerstone of your Forex trading toolkit—helping you navigate price movements more confidently and consistently.
Final Thoughts
- Stay Flexible: Markets are dynamic; don’t treat Fibonacci levels as hard-and-fast rules.
- Use Confluence: Combine Fibonacci with other indicators for a higher probability of success.
- Manage Risk: Protect your capital so you can withstand the inevitable losing trades.
- Review and Adapt: Keep a trade journal, noting which Fibonacci levels worked best and why.
By embracing these principles, you’ll be well on your way to making more informed, strategic trading decisions using Fibonacci retracement levels ultimately improving your ability to pinpoint entry and exit levels in the ever-volatile world of Forex.

