
Forex traders widely use the Fibonacci retracement trading strategy to capitalize on market corrections within a trend. This strategy leverages the natural mathematical ratios found in the Fibonacci sequence to predict potential reversal levels, allowing traders to enter trades at optimal points during a trend’s retracement phase. Below is a detailed guide on how to apply a Fibonacci retracement-based trading strategy.
Understanding Fibonacci Retracement
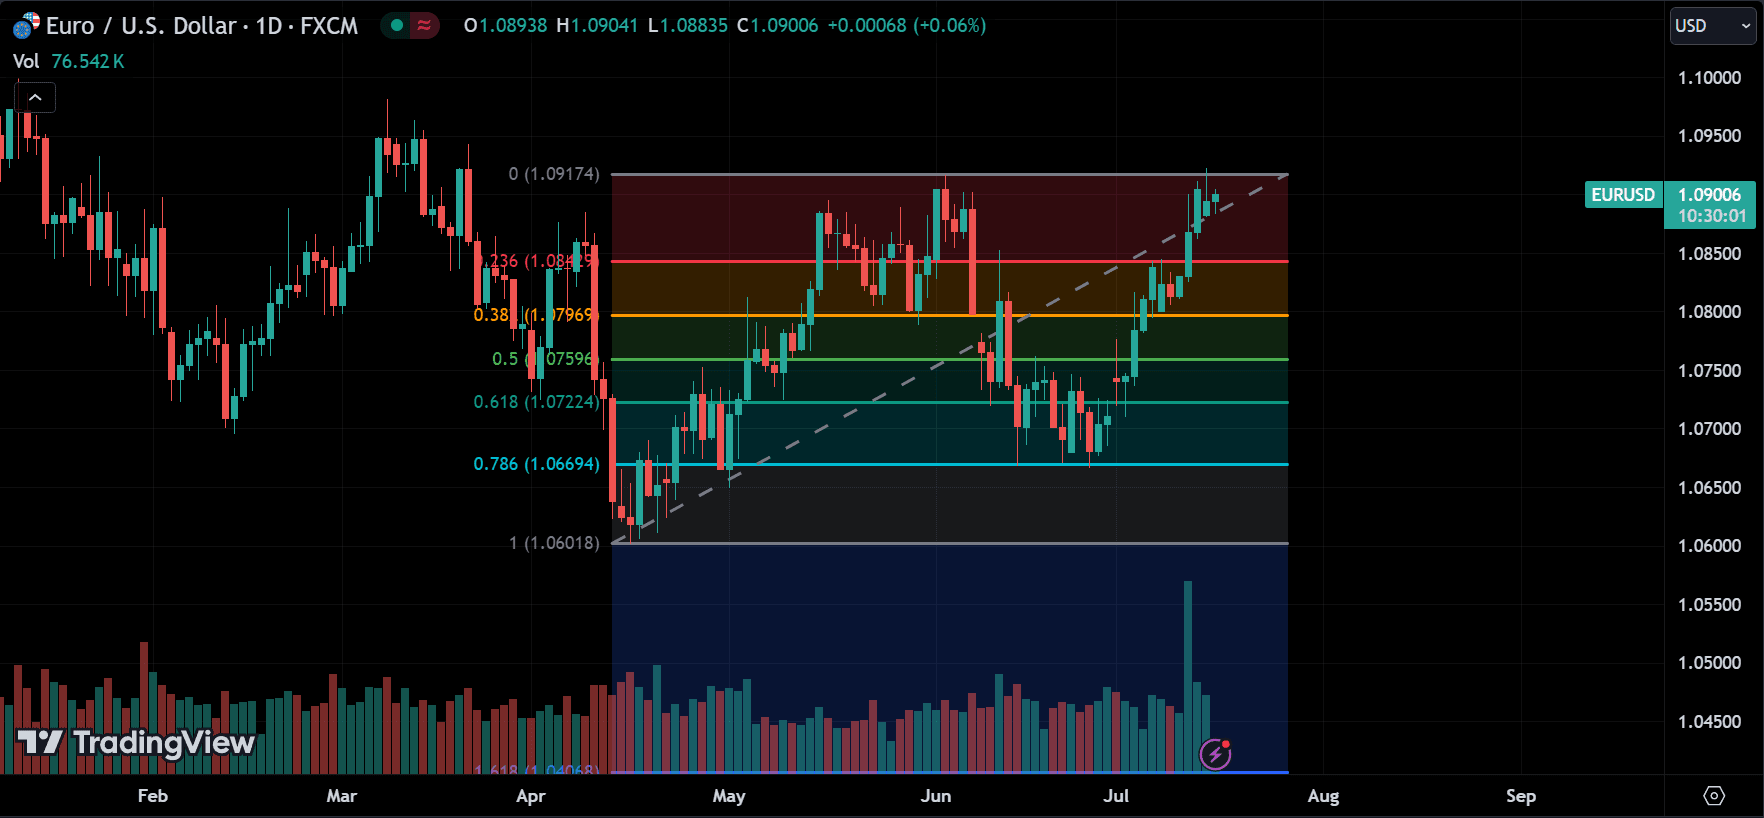
Fibonacci retracement is based on key levels derived from the Fibonacci sequence, which are plotted on a price chart to identify potential support and resistance levels. The most common retracement levels used in forex trading are 23.6%, 38.2%, 50%, 61.8%, and 100%. These levels represent the percentage of a price move that is expected to be retraced before the price continues in the original direction.
Drawing Fibonacci Levels
Drawing Fibonacci levels on a price chart is a straightforward process, but it requires careful identification of key points in the price movement, namely the swing highs and swing lows. Here’s a step-by-step guide on how to draw Fibonacci retracement levels:
Step 1: Identify the Trend
Before you draw Fibonacci levels, you need to determine the overall trend in the market. This can be done by analyzing the price action and using trend indicators such as moving averages or trend lines. The trend could be:
- Uptrend: When the price is generally moving higher.
- Downtrend: When the price is generally moving lower.
Step 2: Locate the Swing High and Swing Low
In an Uptrend:
- Swing Low: Identify the most recent significant low point where the price made a noticeable bottom before starting to move upward.
- Swing High: Identify the most recent significant high point where the price peaked before starting to retrace or pull back.
In a Downtrend:
- Swing High: Identify the most recent significant high point where the price made a noticeable top before starting to move downward.
- Swing Low: Identify the most recent significant low point where the price bottomed before starting to retrace or pull back.
Step 3: Select the Fibonacci Tool
Most trading platforms, including MetaTrader, TradingView, and others, have a built-in Fibonacci retracement tool. To access it:
- Open Your Chart: Ensure the chart is open for the asset you want to analyze.
- Choose the Fibonacci Tool: Look for the Fibonacci retracement tool in the toolbar. It might be under a section dedicated to drawing tools.
Step 4: Draw the Fibonacci Levels
For an Uptrend:
- Click on the Swing Low: Start by clicking on the swing low point where the price starts moving upward.
- Drag to the Swing High: Drag the tool from the swing low to the swing high, where the price reached before starting to retrace.
- Release to Draw Levels: Once you reach the swing high, release the mouse button. The Fibonacci retracement levels (23.6%, 38.2%, 50%, 61.8%, 78.6%) will automatically appear on your chart.
For a Downtrend:
- Click on the Swing High: Start by clicking on the swing high point where the price started the downward move.
- Drag to the Swing Low: Drag the tool from the swing high to the swing low where the price reaches before starting to retrace.
- Release to Draw Levels: Once you reach the swing low, release the mouse button. The Fibonacci retracement levels (23.6%, 38.2%, 50%, 61.8%, 78.6%) will automatically appear on your chart.
Step 5: Analyze the Fibonacci Levels
The drawn Fibonacci levels represent potential areas where the price might retrace before continuing in the direction of the trend. These levels can be used to identify potential entry points, stop-loss placements, and take-profit targets.
- 23.6% Level: A shallow retracement, often indicating a very strong trend.
- 38.2% Level: A moderate retracement level, commonly respected in strong trends.
- 50% Level: Not an official Fibonacci level, but widely used. It indicates the halfway point of the retracement.
- 61.8% Level: A deep retracement level, often seen as a last line of defense for the trend.
- 78.6% Level: A very deep retracement, after which the trend is less likely to resume.
Tips for Effective Use
- Use Multiple Time Frames: Check Fibonacci levels on multiple time frames to get a broader perspective on the potential retracement levels.
- Practice: Practice drawing Fibonacci levels on historical price data to become proficient in identifying the correct swing highs and lows.
By following these steps, you can effectively draw and utilize Fibonacci retracement levels in your forex trading strategy, helping you identify key areas where the market might reverse or continue its trend.
Idea Behind Fibonacci Retracement Strategy
The core idea of the Fibonacci retracement strategy is to identify potential areas where the price might retrace before continuing in the direction of the underlying trend.
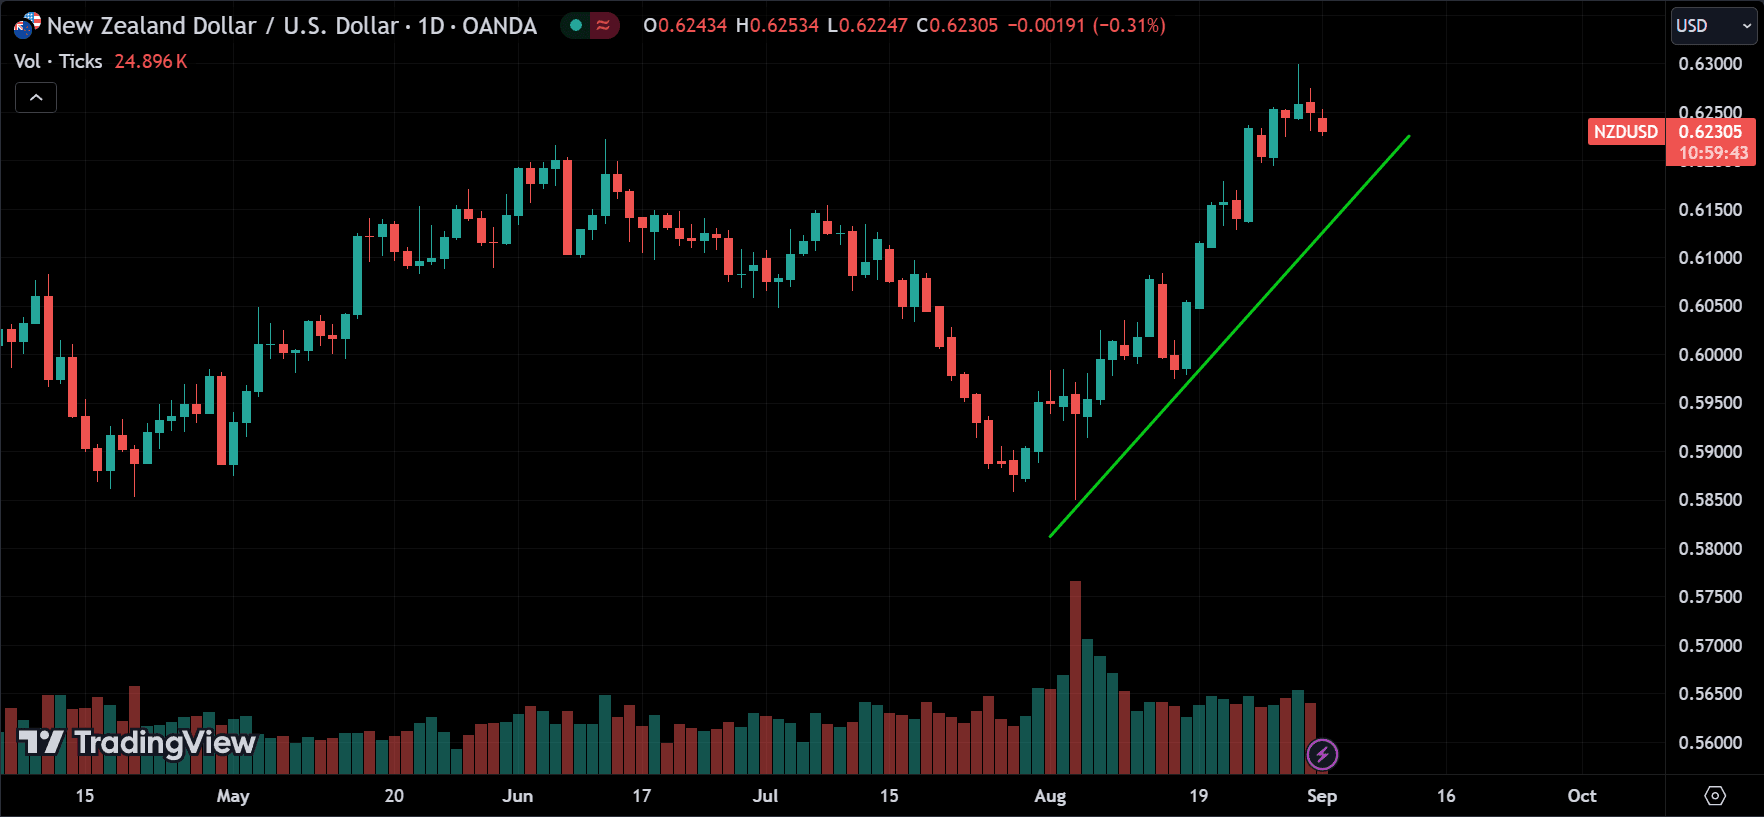
Let me explain. When you look at the daily chart, you can see the current trend. If it’s trending up or down—not sideways—you can switch to smaller time frames like 1-hour, 15-minute, or even 3-minute charts. These show short-term price action behavior. A healthy trend needs pullbacks to continue, so if the overall trend is bullish and you see a reversal on the 15-minute chart, you can aim to profit from these movements.
How to Execute This Strategy?
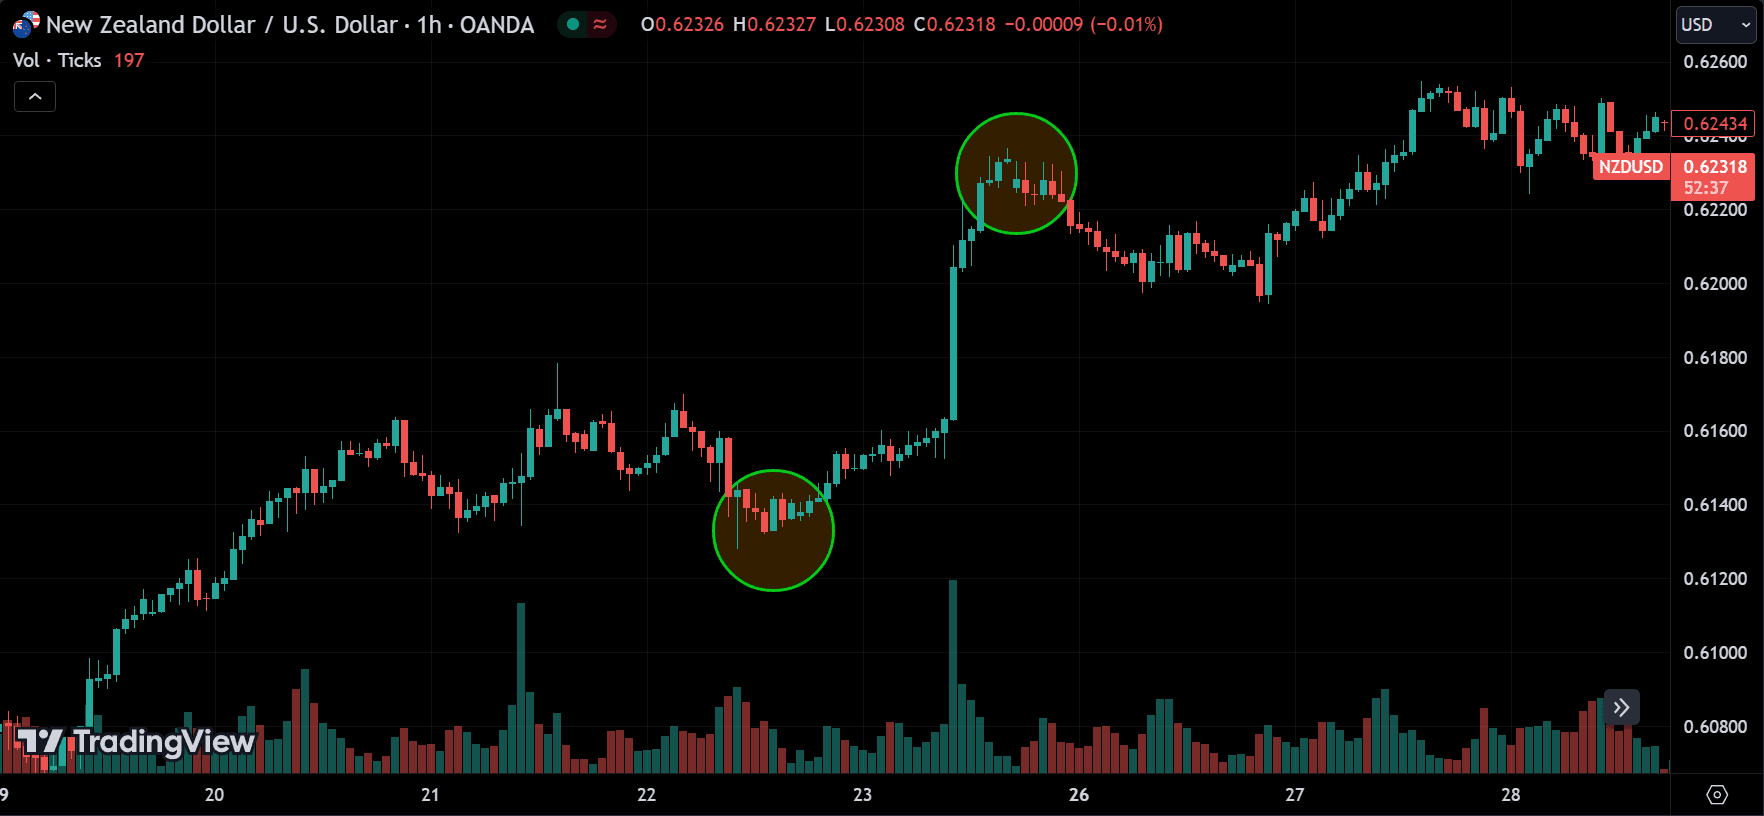
Entry Signal:
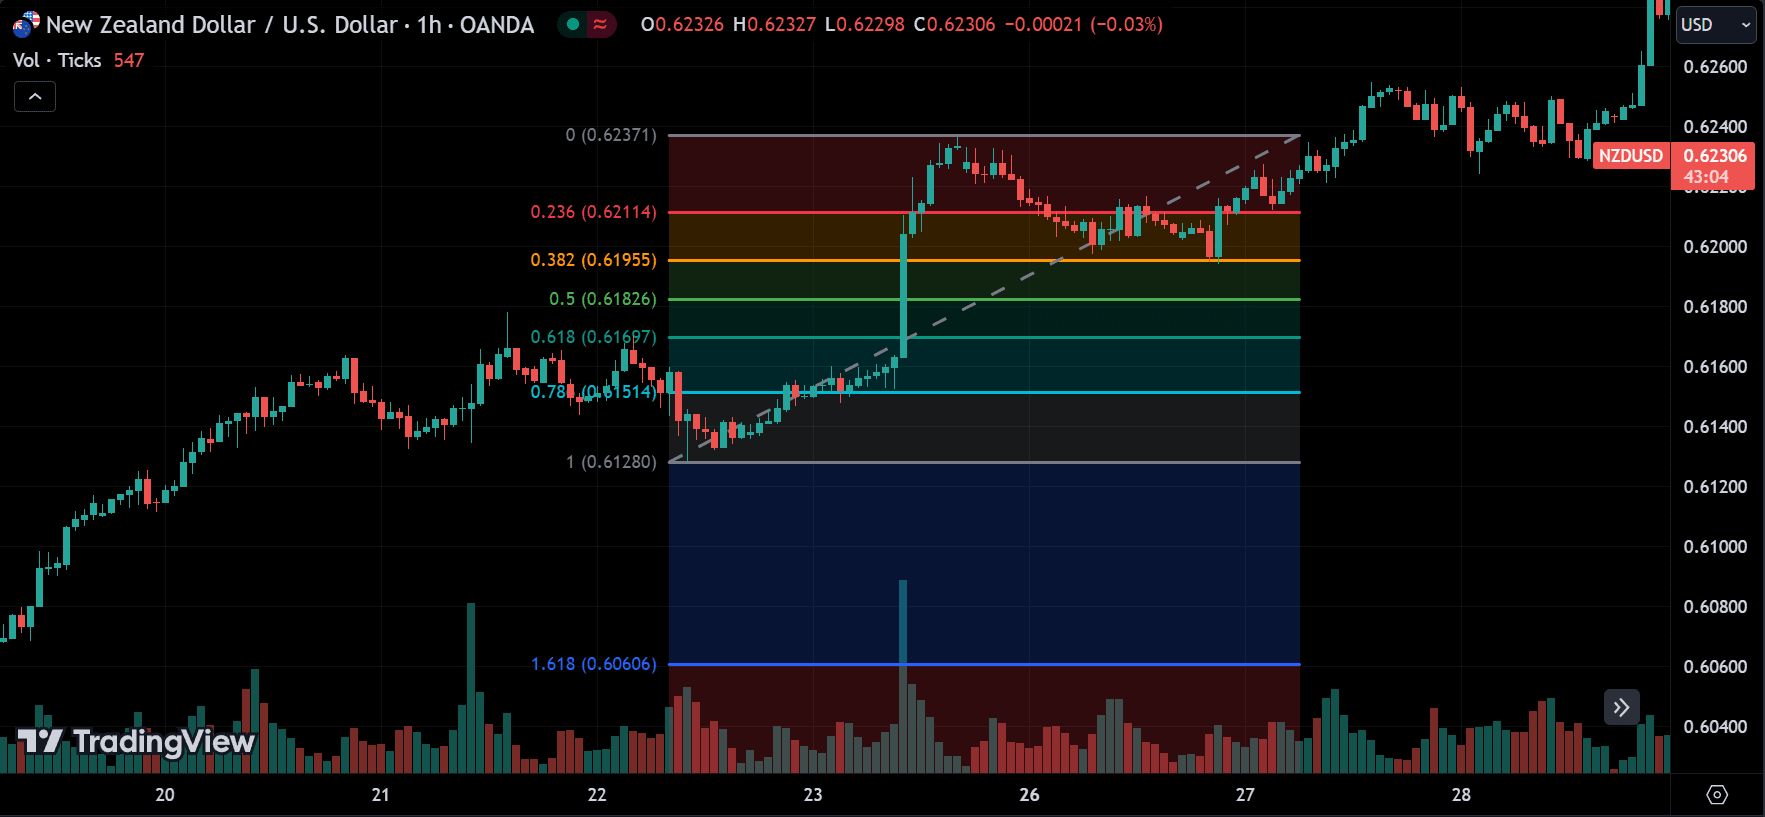
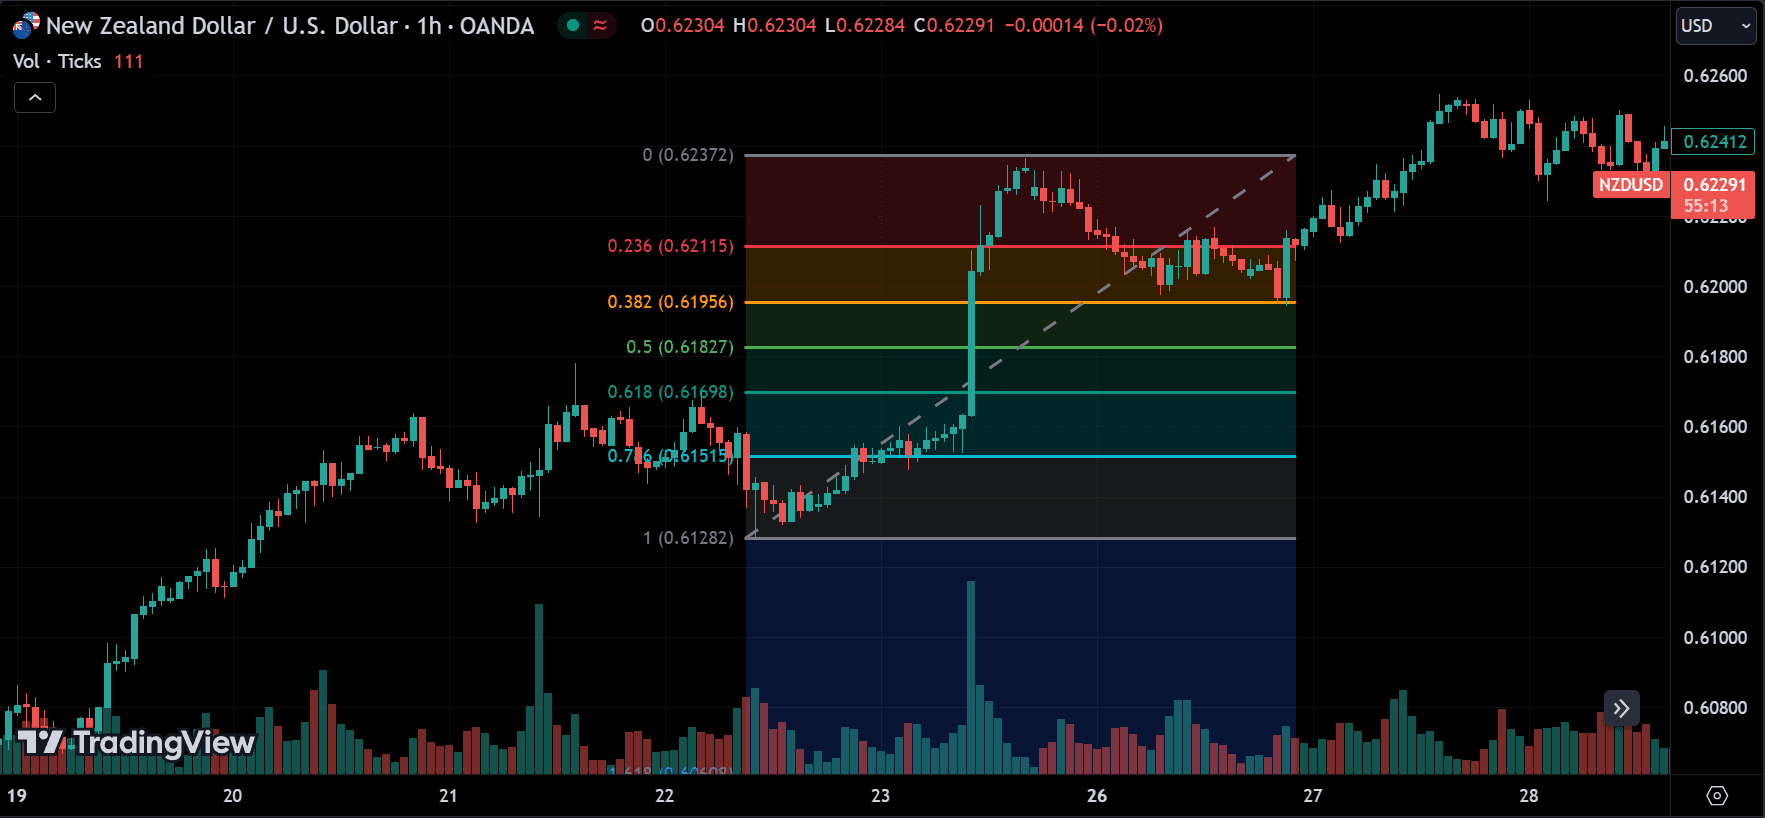
To execute this strategy, we focus on taking advantage of pullbacks. When something is trending up, and you see the price starting to reverse on lower timeframes (like the 1-hour, 15-minute, or even 3-minute charts), you look for candlestick patterns at key price levels. These levels could be round numbers, previous support, or resistance areas. Once you identify these, draw the Fibonacci levels on the chart and enter a short position. You then wait for the price to retrace to these Fibonacci levels. A really strong trend will often retrace around the 0.236 level. If that level is broken, the price might rise to 0.382, 0.5, 0.618, and 0.786.
Stop Loss:
Once you enter the position, set your stop loss just above the last high where the price hasn’t reached before. This protects your trade in case the trend reverses against your position.
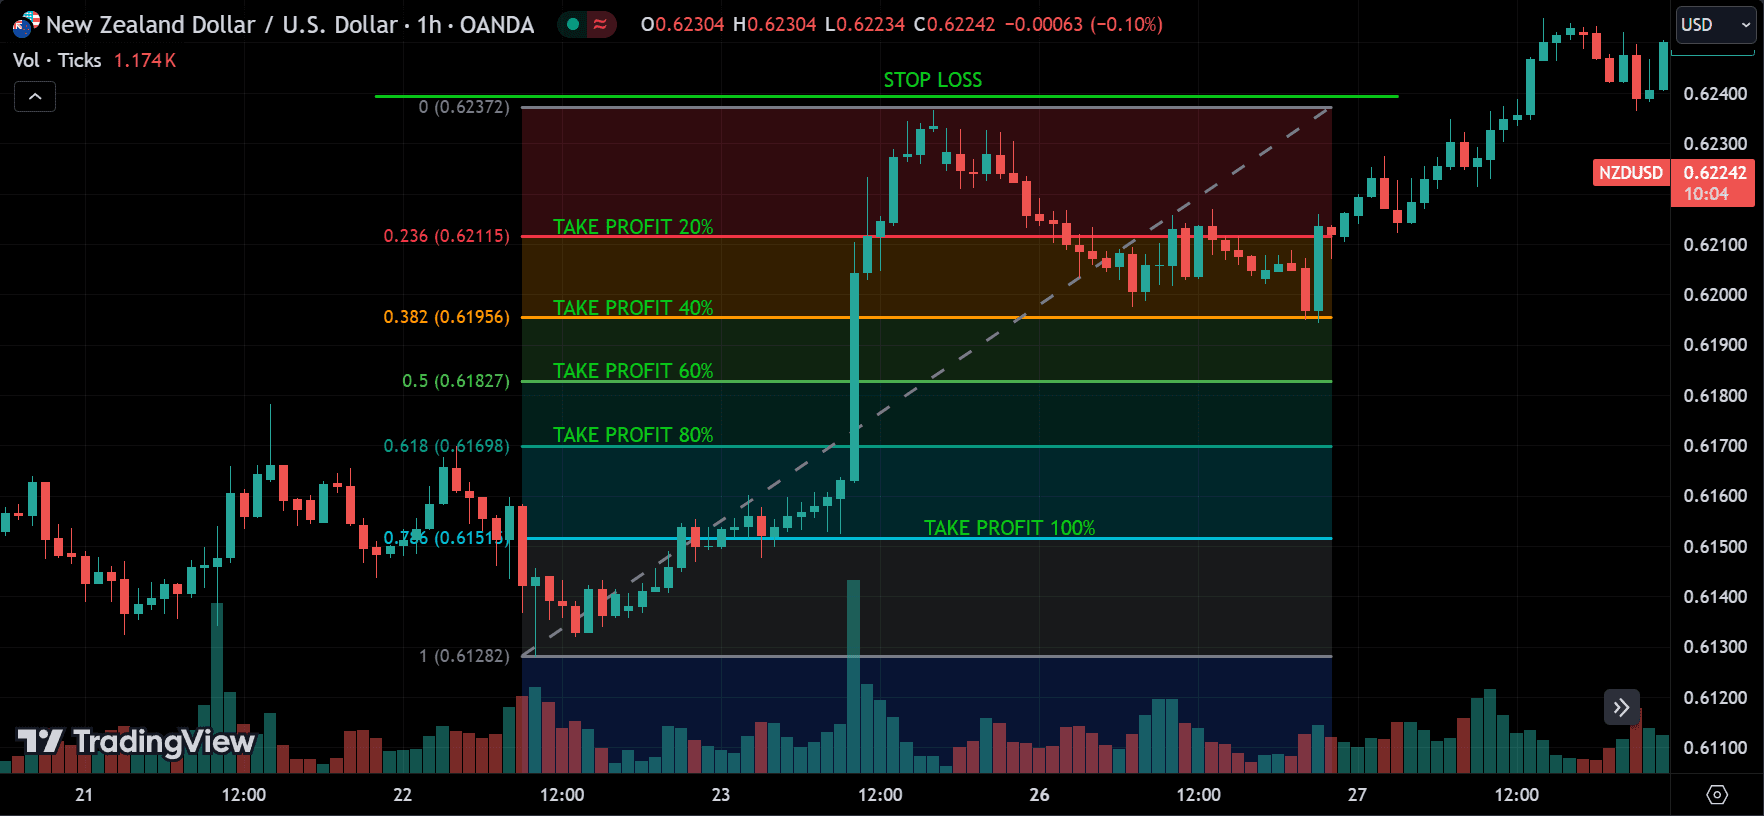
Take Profit:
You can use different strategies to take profit, but here’s how I do it: I take partial profits at each Fibonacci level. The retracement really depends on the trend and the asset. Some trends may remain strong for a while and then weaken, while others stay strong for a long time. I take small profits at each level instead of aiming for big wins to manage this. For each trade, I risk 2% of my capital. At the 0.236 Fibonacci level, I close 20% of the position. When the price reaches 0.382, I close another 20%, meaning 40% of the position is closed by this point. I continue this process with 60% at 0.5, 80% at 0.618, and finally 100% at 0.786.
Adjusting Stop Loss:
As the price breaks each level, I tighten the stop loss. For example, when the price reaches 0.236, I set the stop loss at the 0 Fibonacci level. If the price moves to the 0.5 Fibonacci level, I adjust the stop loss to 0.236. When the price reaches 0.618, I set the stop loss at 0.382. If it breaks below 0.618, I move the stop loss to the 0.5 Fibonacci level.
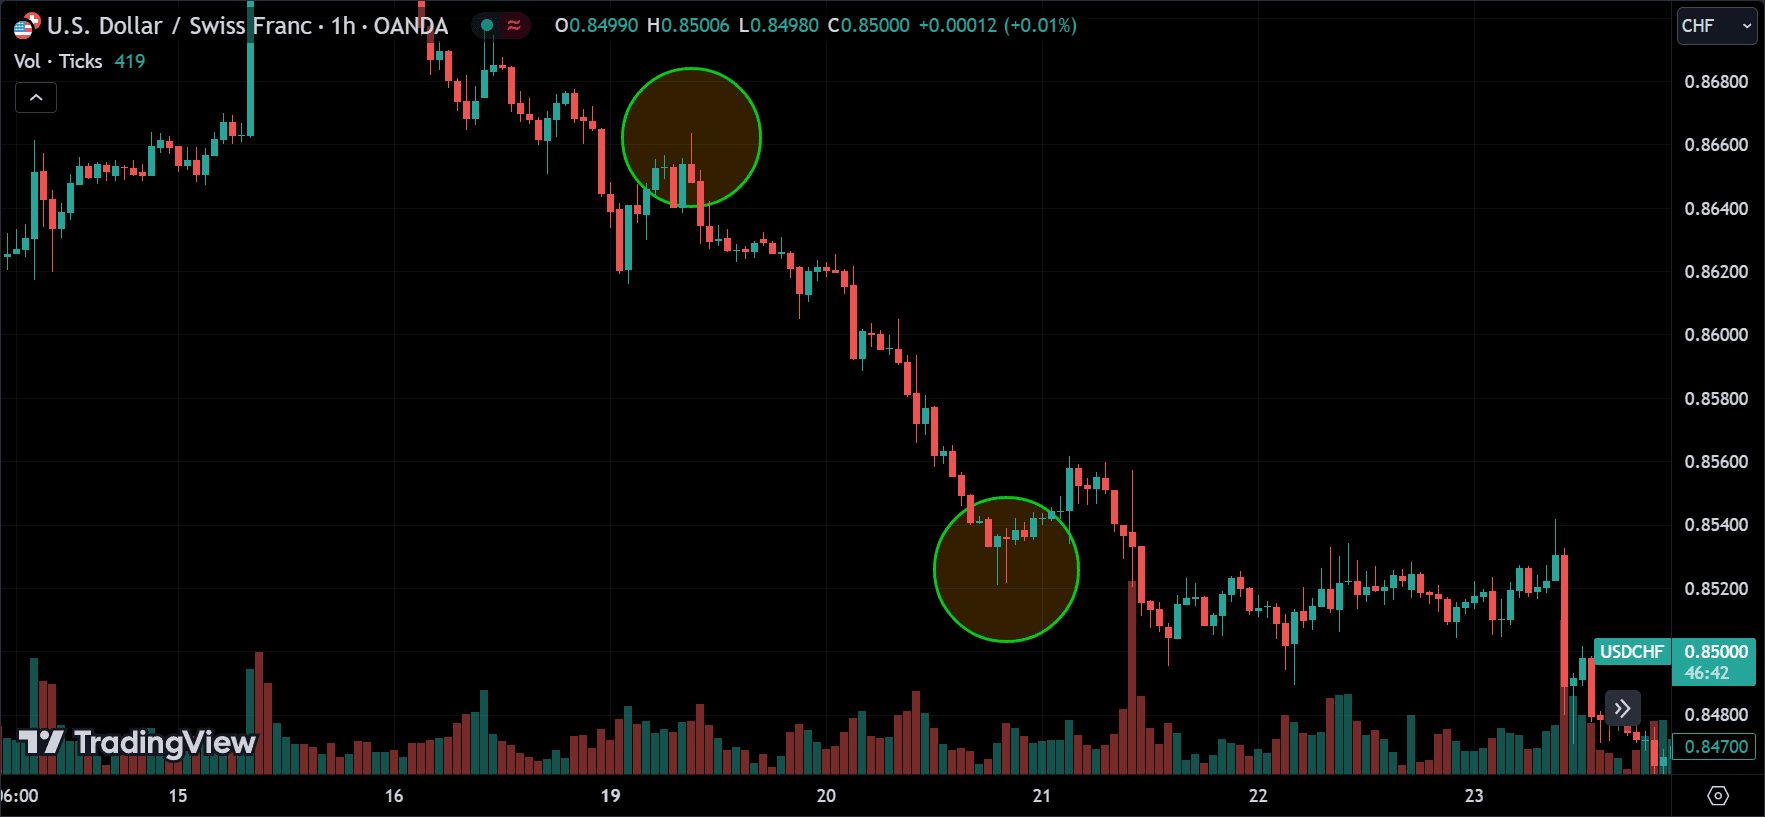
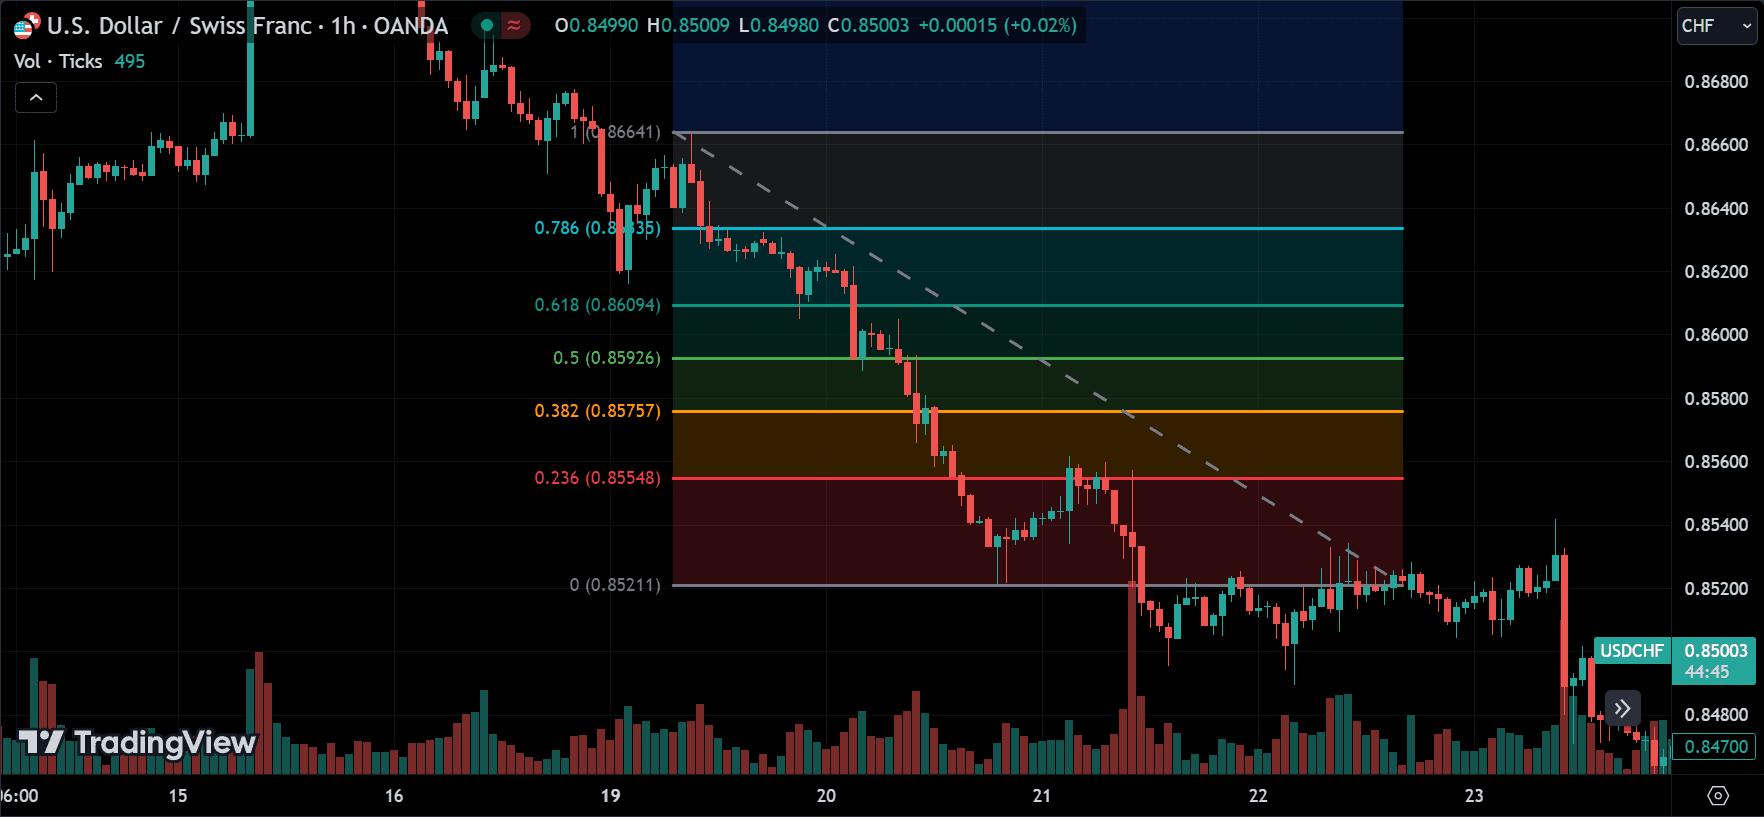
Same Approach for Downtrends:
This strategy applies the same principles in a downtrend, but instead of entering a short position, you take a long position. You follow the same process of identifying entry signals, setting stop losses, and taking profits based on Fibonacci retracement levels.
Trading Plan Implementation
| STRATEGY | FIBONACCI |
| TRADING STYLE | DAY-TRADING |
| STRATEGY TYPE | MEAN-REVERSION |
| HOLDING PERIOD | FEW HOURS(VARIES DEPENDS ON THE TRADER) |
| ASSET SELECTION | LIQUID FX PAIRS |
| TIME FRAME | 3M / 15M / 1H / |
| ENTRY SIGNAL | REVERSAL AROUND KEY LEVELS |
| ENTRY STYLE | SINGLE MARKET ENTRY |
| TAKE PROFIT SIGNAL | PRICE REACHING FIBONACCI LEVELS |
| TAKE PROFIT STYLE | MULTIPLE LIMIT ORDER 20% EACH |
| POSITION SIZING | SINGLE ENTRY 2% RISK |
| STOP LOSS | 2% RISK, JUST ABOVE/BELOW THE REVERSAL |
| BAIL OUT INDICATORS | STONG FUNDAMENTAL NEWS |
If you are unfamiliar with a trading plan and don’t know how to implement it correctly, consider reading that article.
Once you find the best setup for your strategy and plan, please write it down like shown above and follow it every time you trade. This is very important for your trading mindset.
Advantages of Fibonacci Retracement Strategy
- Versatility: Fibonacci retracement can be applied to any time frame and any currency pair, making it a versatile tool for traders.
- Improved Accuracy: By combining Fibonacci retracement with other technical analysis tools, traders can improve the accuracy of their trades and increase their chances of success.
- Enhanced Risk Management: Fibonacci levels provide clear areas for setting stop losses and take profit levels, which helps manage risk effectively.
- Identification of Key Levels: Fibonacci retracement levels highlight key areas of support and resistance, which are critical for making informed trading decisions.
Disadvantages Fibonacci Retracement Strategy
- Subjectivity: The effectiveness of Fibonacci retracement depends on correctly identifying swing highs and lows, which can be subjective and vary between traders.
- Lagging Indicator: Since Fibonacci retracement is based on historical price data, it is a lagging indicator and may not always accurately predict future price movements.
- False Signals: Fibonacci retracement, like any technical analysis tool, can produce false signals, especially in volatile or choppy markets.
Conclusion
The Fibonacci retracement trading strategy is powerful for identifying potential reversal points in trending markets. By following the steps outlined above, traders can enter trades with a higher probability of success and manage risk more effectively. However, as with any trading strategy, combining Fibonacci retracement sound risk management practices is essential to achieve the best results.