

The Volatility Breakout Forex Strategy is one of the most powerful ways to trade big moves in the market. When prices break out after a quiet period, they often move fast, and if you can catch that momentum early, the profit potential is huge.
In this guide, we’ll explain exactly how the Volatility Breakout Forex Strategy works, why it’s so effective, and how to use it step by step. From the best indicators to spotting real breakouts (not fakeouts) and managing your risk like a pro, you’ll get a full blueprint to trade volatility with confidence and precision.
Table of Contents
Understanding Volatility in Forex
What Is Volatility?
Volatility refers to the magnitude of market price movements over a given period. In Forex, volatility can be influenced by various factors such as economic announcements, geopolitical news, and changes in global market sentiment. A highly volatile market is characterized by larger swings—prices can rise or fall dramatically in a short amount of time.
Why Volatility Matters in Forex
- Profit Potential – When the market moves quickly, the potential for profit (and loss) increases. By correctly anticipating these movements, traders can capitalize on larger price swings.
- Risk Concerns – While volatility can present profit opportunities, it also introduces greater risk. Prices may move against your position more sharply than in a stable market.
- Market Activity – Periods of high volatility often coincide with increased market participation and volume, which can improve the efficiency of trade execution.
Common Misconceptions About Volatility
- “Volatility is always a bad thing.” While high volatility can be risky, it also offers excellent trading opportunities for those who know how to manage risk effectively.
- “Volatility can be predicted with 100% accuracy.” No indicator or strategy can predict market movements flawlessly. The Volatility Breakout Strategy aims to react to actual market movement rather than predict it outright.
What Is a Volatility Breakout Forex Strategy?
Core Concept and Definition
A Volatility Breakout Forex Strategy is designed to capture explosive price movements that occur once the market breaks out of a period of low volatility or consolidation. Essentially, the idea is to:
- Identify when the market has been trading in a narrow range or exhibiting low volatility.
- Detect the moment when the price breaks out of this range.
- Execute a trade in the direction of the breakout to capitalize on the accelerated price action.
Market Timing and Volatility
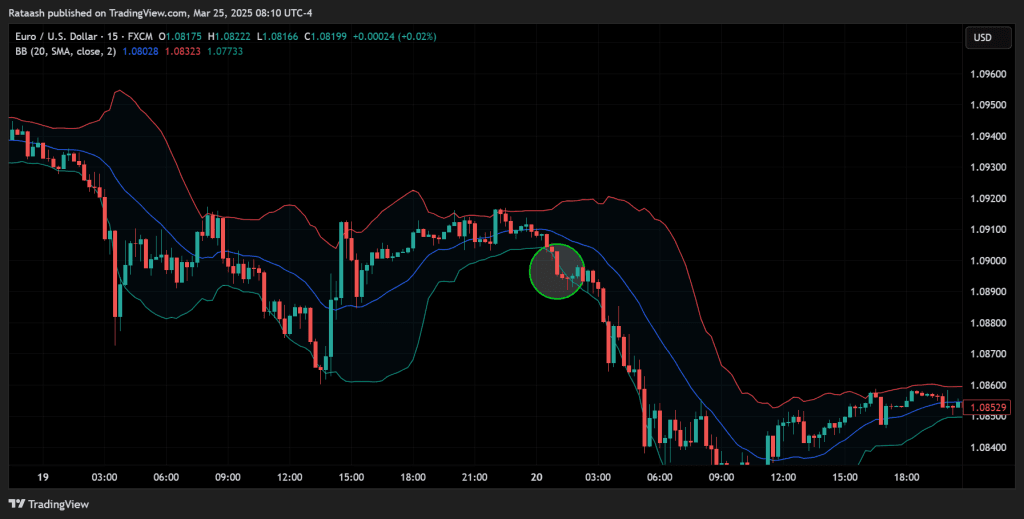
Timing is crucial. Many traders look for a spike in volatility after a period of consolidation or low activity. This is often visible on a price chart as narrow ranges or “squeezes” in certain indicators such as Bollinger Bands or Keltner Channels. When the bands expand or the price breaks above/below these channels, it can signify a shift from low volatility to high volatility.
Key Indicators and Tools
To effectively implement a Volatility Breakout Strategy, you need tools to measure volatility and identify breakouts. Some of the most popular are:
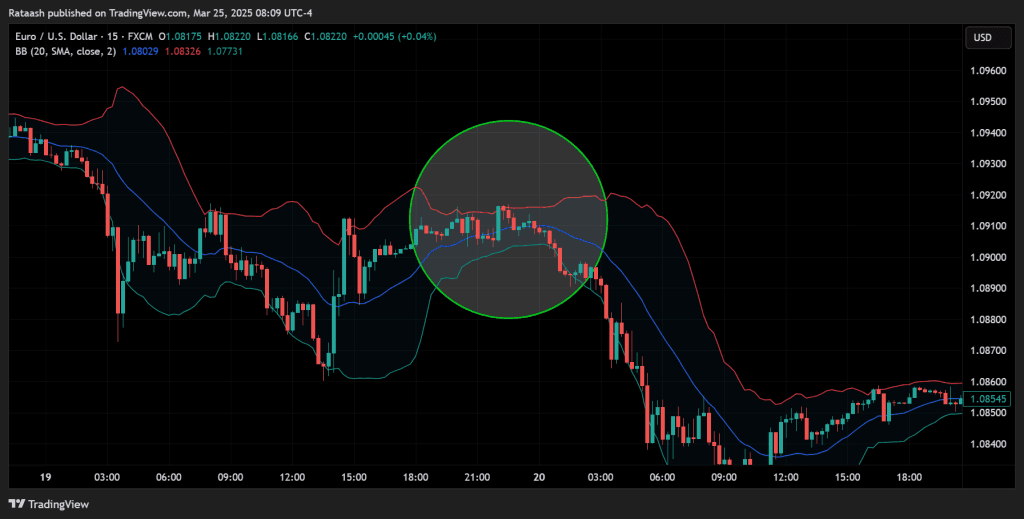
- Bollinger Bands – Highlights volatility by plotting standard deviations around a moving average.
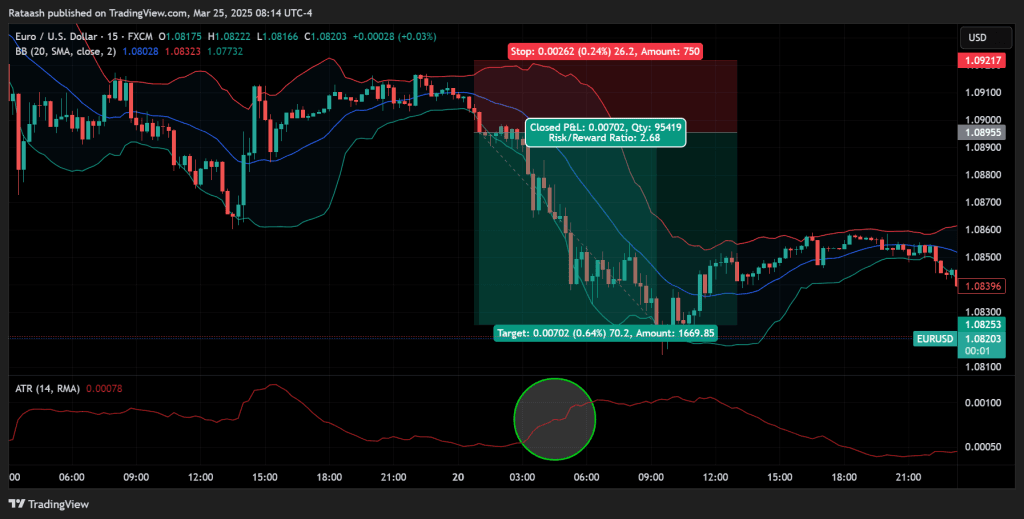
- Average True Range (ATR) – Measures how much an asset has been moving on average over a specified period.
- Donchian Channels – Based on the highest high and lowest low over a specified time period, useful for breakout signals.
- Keltner Channels – Similar to Bollinger Bands but uses the Average True Range for channel width.
Core Components of a Volatility Breakout Strategy

Identifying High-Volatility Market Environments
Not all currency pairs and time frames are suitable for a Volatility Breakout Strategy at all times. Traders typically wait for:
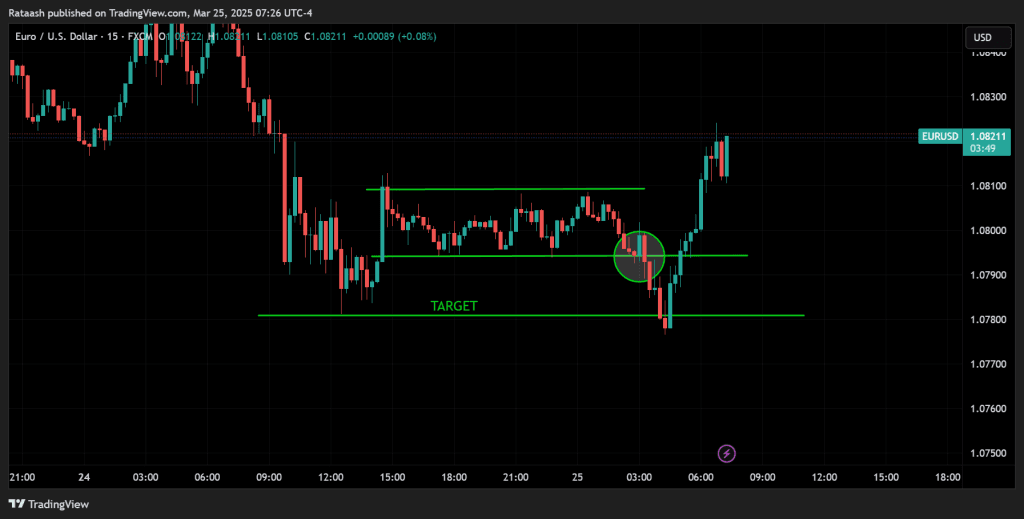
- Periods of Contraction: When the price movement narrows. Tools like Bollinger Band “squeezes” can help identify these moments.
- Sudden Expansion: A swift expansion in the price range or an actual breakout of a defined channel.
Defining Entry and Exit Criteria
- Entry: You decide on a set number of pips or an indicator-based threshold that signals a breakout. For instance, if Bollinger Bands start to expand and the price closes above the upper band, that could be your entry signal.
- Exit: Based on ATR or other indicators, determine whether you will use a fixed take profit or a trailing stop. The point is to exit either at a specific profit target or if the price action indicates the move has lost momentum.
Stop-Loss Placement and Risk Management
A Volatility Breakout Strategy without proper stop-loss placement can be dangerous. Popular choices include:
- Below/Above the Recent Swing: If you’re going long, place the stop-loss below the most recent swing low; if short, above the most recent swing high.
- Indicator-Based Stop: Some traders rely on ATR for dynamic stop-loss placement. For example, you might place your stop-loss 1.5 times the ATR below the entry price on a long trade.
Choosing the Right Currency Pairs and Time Frames

Currency Pairs With High Volatility
Certain currency pairs tend to exhibit higher volatility:
- GBP/JPY: Known for significant daily movement.
- GBP/USD: Pound-related pairs tend to move more due to macroeconomic factors.
- EUR/USD: The most liquid pair, and while its volatility may be moderate, it can still present reliable breakout opportunities.
- AUD/USD or NZD/USD: During certain times (especially related to commodity price changes), these can experience higher volatility.
Best Time Frames for Breakout Strategies
Time frames can vary based on a trader’s preference. Here are some guidelines:
- Short-Term (15-minute to 1-hour): Suitable for intraday volatility plays and quick breakouts, but signals can be more frequent and prone to noise.
- Medium-Term (4-hour to Daily): Fewer signals but potentially stronger and more reliable, as breakouts in these time frames are more significant and can lead to substantial trends.
- Long-Term (Weekly/Monthly): A Volatility Breakout Strategy is less commonly used on weekly or monthly charts because you need long periods of low volatility followed by dramatic breakouts, which might be rarer.
Correlated vs. Non-Correlated Pairs
Correlated Currency Pairs
| Positive Correlation | Negative Correlation |
|---|---|
| EUR/USD ↔ GBP/USD | EUR/USD ↔ USD/CHF |
| AUD/USD ↔ NZD/USD | GBP/USD ↔ USD/JPY |
| EUR/USD ↔ AUD/USD | EUR/JPY ↔ USD/JPY |
| USD/CAD ↔ NZD/USD | AUD/USD ↔ USD/CHF |
| GBP/USD ↔ AUD/USD | EUR/USD ↔ USD/JPY |
Non-Correlated Currency Pairs
| Examples |
|---|
| EUR/USD ↔ USD/JPY |
| GBP/JPY ↔ AUD/CAD |
| NZD/JPY ↔ EUR/GBP |
| USD/CHF ↔ AUD/JPY |
| CAD/JPY ↔ GBP/NZD |
Traders often choose non-correlated pairs to diversify. For instance, if you’re trading GBP/JPY, you might avoid taking a similar breakout signal on EUR/JPY if both move similarly. That said, focusing on correlated pairs can also compound gains if the strategy is successful, but it carries higher risk.
Setting Up Your Charts and Indicators
Bollinger Bands
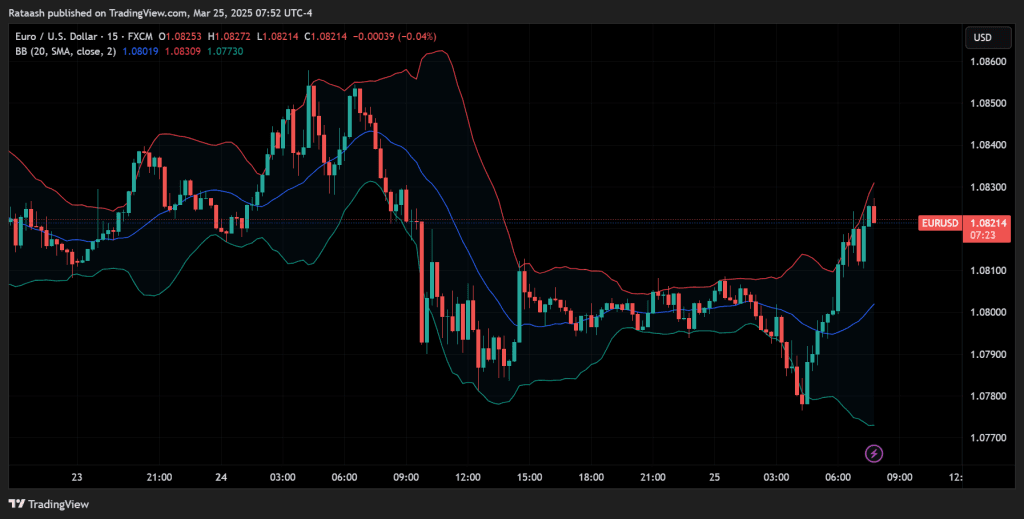
Created by John Bollinger, Bollinger Bands plot an upper and lower band around a simple moving average. The distance between the bands widens during volatile periods and narrows during low-volatility periods. For a Volatility Breakout Strategy:
- Look for a squeeze: A period where the bands narrow significantly.
- Await the price to close outside the band: Potential breakout signal.
Average True Range (ATR)
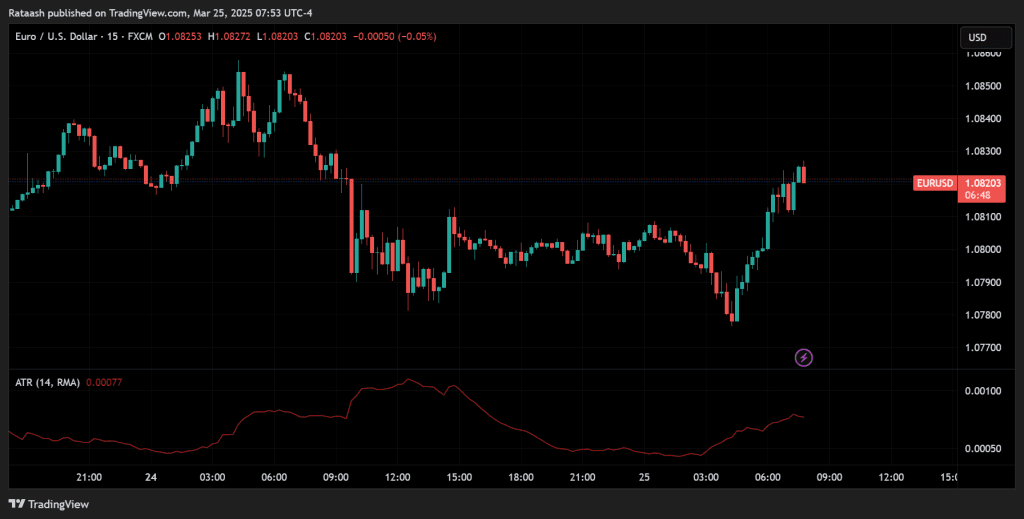
ATR calculates the average range between high and low over a specified number of bars. Traders use ATR to:
- Set Stop-Loss Orders: Using a multiple of the ATR below/above the entry can help accommodate normal price fluctuations.
- Gauge Breakout Potential: An unusually high ATR might indicate a breakout or a trending market.
Keltner Channels
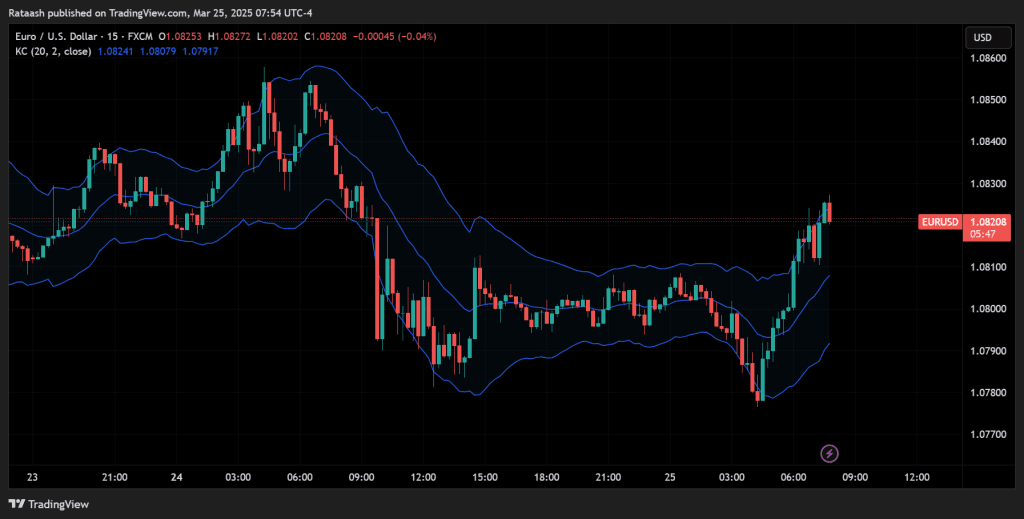
Keltner Channels use the ATR to plot bands around an exponential moving average. They’re often less noisy than Bollinger Bands. A breakout above the upper Keltner Channel or below the lower channel can signal a potential entry.
Donchian Channels
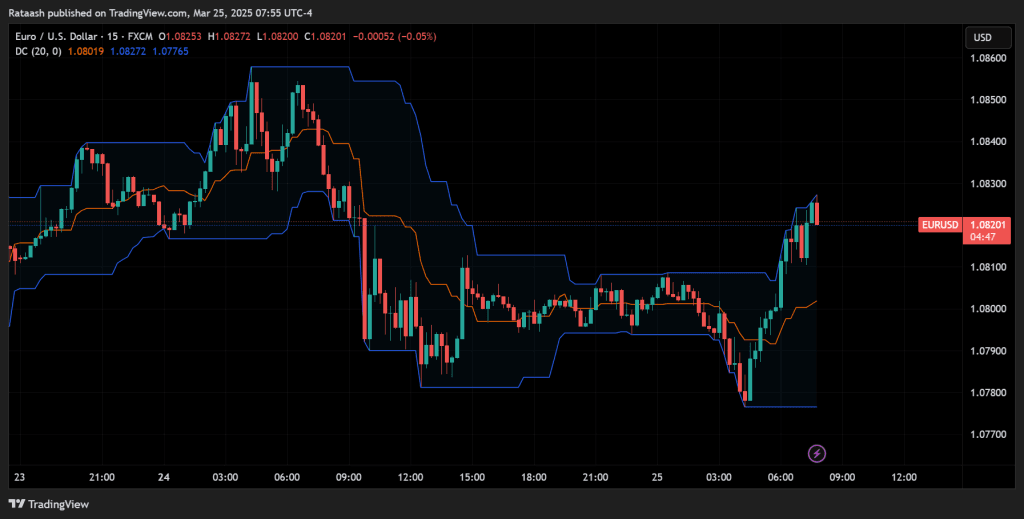
Developed by Richard Donchian, these channels mark the highest high and the lowest low over a set period. A break above the upper channel signals a bullish breakout, while a break below the lower channel signals a bearish one.
Step-by-Step Implementation of the Volatility Breakout Strategy
In this section, we’ll combine everything discussed so far into a cohesive step-by-step plan for trading volatility breakouts. The main objective is to detect low-volatility phases and capture profits when volatility suddenly expands.
Step 1: Pinpointing the Setup
- Scan Currency Pairs: Focus on pairs known to exhibit high volatility or check the entire market for potential breakout conditions.
- Identify Low-Volatility Periods: Use indicators like Bollinger Band squeezes or declining ATR values to find when a pair is trading in a narrow range.
Step 2: Confirming the Breakout
- Look for a Price Close Beyond a Key Level: For Bollinger Bands, you’d look for a close above the upper band or below the lower band.
- Check Volume (if available): Higher volume can confirm that the breakout has momentum behind it.
- Validate With Additional Indicators (optional): Use tools such as moving average crossovers or MACD to see if momentum aligns with the breakout direction.
Step 3: Placing Entry Orders
- Market Orders vs. Pending Orders:
- Market Orders: Enter immediately once the breakout is confirmed.
- Pending Orders (Stop Orders): Place buy stop above resistance or sell stop below support to catch the breakout if it continues.
- Avoid Impulsive Entries: Wait for at least one candle to close beyond your breakout threshold to filter out potential fakeouts.
Step 4: Stop-Loss and Take-Profit Placement
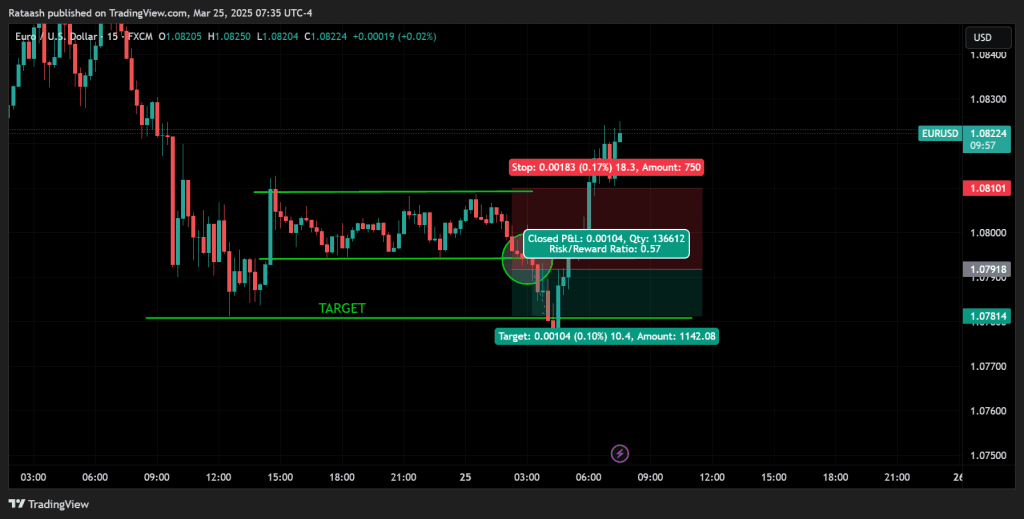
- Stop-Loss:
- Below/Above the Recent Swing: For a long position, a stop below the recent swing low; for a short, above the recent swing high.
- ATR-Based: If your ATR(14) is 20 pips, consider placing a stop-loss 1.5 × 20 = 30 pips away from the entry.
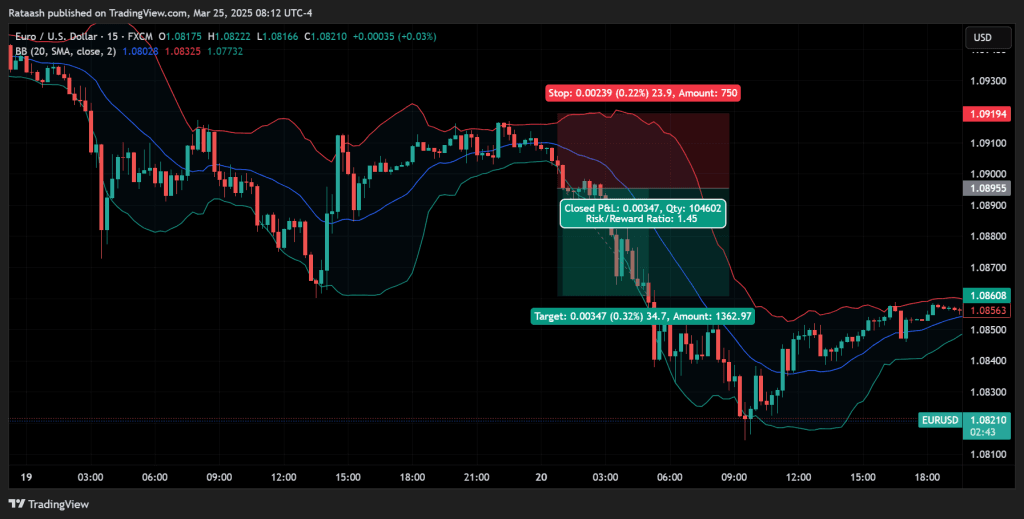
- Take-Profit:
- Fixed Ratio: Aim for a 2:1 or 3:1 reward-to-risk ratio.
- Dynamic Targets: Use a trailing stop or move your stop as the trade goes in your favor, aiming to capture sustained breakouts.
Step 5: Trade Management During Live Market Conditions
- Monitor ATR or Volatility Indicators: If volatility spikes further, you may want to adjust targets or add to your position (scaling in).
- Move Stops to Break Even: Once the trade moves favorably by an amount equal to your initial risk, you might consider moving your stop-loss to your entry price to eliminate risk.
- Partial Profits: Some traders take partial profits at a certain level and let the remainder run.
Step 6: Exit Strategies
- Stop-Loss Hit: If the market reverses and your stop is hit, accept the loss and move on. Discipline is crucial.
- Trailing Stop Trigger: If you’re using a trailing stop, you’ll exit when the price retraces enough to trigger your stop.
- Indicator-Based Exit: For instance, if price moves back inside Bollinger Bands after a breakout, that could be an exit signal.
Risk Management Tactics
Position Sizing
- Risk Per Trade: Many professionals recommend risking no more than 1%–2% of your account on any single trade.
- Lot Size Calculation: If your stop-loss is 30 pips, and you’re risking 1% of a $10,000 account (i.e., $100), you can adjust your position size so that a 30-pip loss equals $100.
Hedging Techniques
- Pair Hedging: Some traders open a long position in one currency pair and a short position in a correlated pair to mitigate risk. This approach is more advanced and requires a thorough understanding.
- Instrument Diversification: Rather than trading multiple positions on the same currency pair, diversify across different pairs—though make sure you understand correlation.
Trailing Stops
- Dynamic Risk Control: As the trade moves in your favor, you can gradually lock in profits by moving your stop-loss upward (for long trades) or downward (for short trades).
- ATR-Based Trailing Stops: For instance, as volatility increases, you might widen your trailing stop or keep it at a consistent multiple of the ATR.
Diversification Within Forex
Trading multiple pairs can spread risk, but avoid overexposure to correlated pairs. For instance, if you’re already trading EUR/USD and GBP/USD, be mindful that both pairs may react similarly to USD-centric news.
Practical Examples and Case Studies
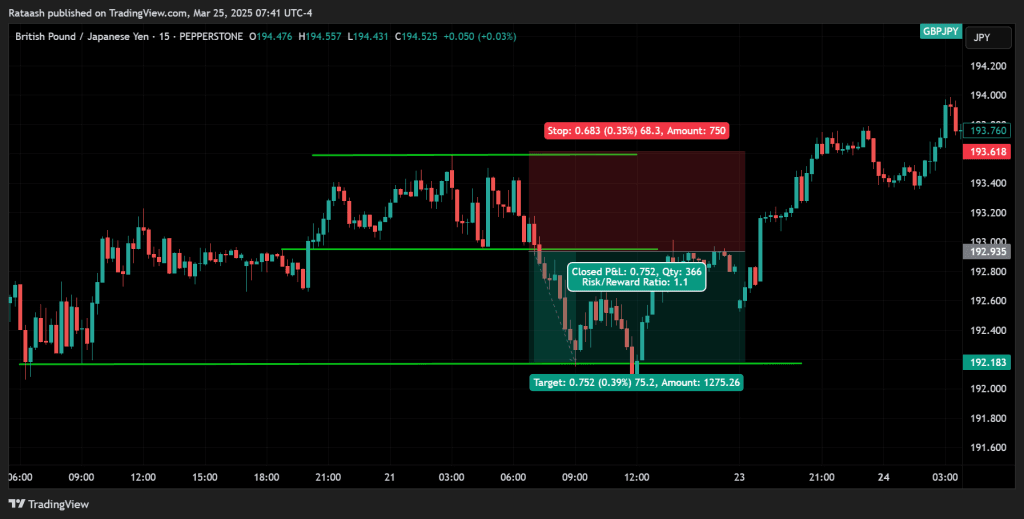
Real-Time Example of a Volatility Breakout Trade
- Currency Pair: GBP/JPY
- Time Frame: 1-hour chart
- Indicator Setup: Bollinger Bands (20,2) and ATR(14)
- Market Context: GBP/JPY had been in a tight 50-pip range for several hours. Bollinger Bands narrowed noticeably, signaling reduced volatility.
- Breakout: Price closed above the upper Bollinger Band while ATR increased from 12 to 18 pips, indicating rising volatility.
- Entry: Trader placed a buy stop 5 pips above the breakout candle’s high.
- Stop-Loss: 1.5 × ATR (1.5 × 18 = 27 pips) below the entry point.
- Outcome: The pair rallied another 50 pips. The trader moved stop-loss to break even after 27 pips of profit and trailed stops by 10 pips as price climbed. Eventually closed the trade at +40 pips.
Analyzing Historical Data

Backtesting a Volatility Breakout Strategy on historical data can help validate its effectiveness. For instance, if you’re using a Bollinger Band breakout, you might review how often a close above the upper band led to sustained upward moves. Keep track of the frequency of false signals and adjust your criteria accordingly.
Lessons Learned From Successful and Failed Trades
- Successful Trades: Typically occur when multiple factors align—breakout, rising volume, higher ATR, and supportive price action.
- Failed Trades: Often happen when a trader ignores or misinterprets additional confirming indicators, or enters prematurely before a candle close beyond a breakout zone.
Psychological Factors and Discipline

Controlling Emotions During Volatile Markets
- Adrenaline Rush: A sudden spike in volatility can be exciting. This excitement can lead to impulsive decisions. Have a plan and stick to it.
- Fear of Missing Out (FOMO): Seeing a massive price move can tempt you to jump in late, which often results in poor trade entries.
Sticking to Your Plan
A well-defined trading plan outlines exactly what conditions must be met before you place a trade. If these conditions aren’t met, avoid jumping in. Consistency is the backbone of long-term success.
Overcoming Fear of Losing
All traders face losses at some point. A robust risk management plan helps mitigate the impact of losing trades, making them less emotionally distressing.
Common Mistakes and Pitfalls to Avoid

- Overtrading in Volatile Conditions
When volatility is high, multiple currency pairs might signal breakouts simultaneously. Jumping into all of them can escalate risk exponentially. Aim for quality over quantity. - Misreading False Breakouts
Not every price movement beyond a resistance or support level constitutes a genuine breakout. Some moves quickly reverse, trapping overzealous traders. Waiting for a candle close or a secondary confirmation (e.g., volume spike, confluence with a momentum indicator) can help filter out false signals. - Ignoring Risk Parameters
Failing to place a stop-loss, or placing a stop so far away that it neglects risk management, can be disastrous. Always define your risk per trade and adhere to it strictly.
Tips for Improving Your Volatility Breakout Strategy

Backtesting and Forward Testing
- Backtesting: Use historical price data to simulate trades. It gives you an idea of the strategy’s potential performance under various market conditions.
- Forward Testing/Demo Trading: Apply the strategy in real-time with a demo account to understand how the market behaves and how effectively you can execute the plan.
Refining Entry and Exit Signals
You can enhance the reliability of your signals by combining volatility indicators with momentum oscillators like RSI or MACD. This additional confluence might help distinguish real breakouts from false ones.
Staying Current With Market News and Events
Major economic announcements can spark volatility, creating breakout conditions. Stay aware of upcoming events like interest rate decisions, Non-Farm Payrolls, or GDP releases. While some traders avoid trading during major news events due to unpredictability, news-driven volatility can also present prime breakout opportunities.
Conclusion: Mastering Volatility Breakouts for Long-Term Success
The Volatility Breakout Forex Strategy is a powerful method for capturing sharp price movements during periods of sudden market expansion. By focusing on low-volatility phases that transition into breakouts, traders can time entries with precision and unlock substantial profit potential—if backed by disciplined risk management.
Key Steps:
- Identify low volatility using tools like Bollinger Bands, ATR, Keltner, or Donchian Channels.
- Confirm the breakout with candle closes beyond key levels and possibly volume or momentum indicators.
- Set stop-loss and targets near logical levels with a solid reward-to-risk ratio.
- Monitor trades closely, adjust stops, and take partial profits if needed.
- Stay disciplined by following your plan and avoiding emotional decisions.
Takeaways:
- Volatility offers big rewards but comes with increased risk.
- Systematic, well-tested strategies help reduce false signals.
- Choose the right pairs and trade during active sessions like London or New York.
- Consistency, backtesting, and emotional control are essential for long-term success.
With proper execution, this strategy can become a key part of your trading toolkit helping you navigate and profit from the most dynamic phases of the Forex market.