

STRATEGY OVERVIEW
Trading Type: Scalping
Timeframes: 5 minutes (M5), 15 minutes (M15), 30 minutes (M30)
and 1 hour (H1)
Trade Execution Timeframe: 5 minutes (M5)
Signal Detection Timeframe: 15 minutes (M15)
Confirmation Timeframe: 30 minutes (M30) and 1 hour (H1)
Indicators: Bollinger Band, Relative Strength Index (RSI), Stochastic Oscillator and MACD
Next there is a table showing the functions of all the indicators we going to
use in the strategy:
| INDICATOR | FUNCTION |
| Bollinger Band | Measures Volatility |
| Relative Strength Index (RSI) | Measures Market Exhaustion |
| Stochastic Oscillator | Measures Momentum |
| MACD | Direction and Momentum |
STEPS TO TAKING A TRADE
- Set up all indicators on your MT5 app(like shown on images)
- To detect a potential trading signal for further analysis, switch
your chart to M15 (15 minutes timeframe).
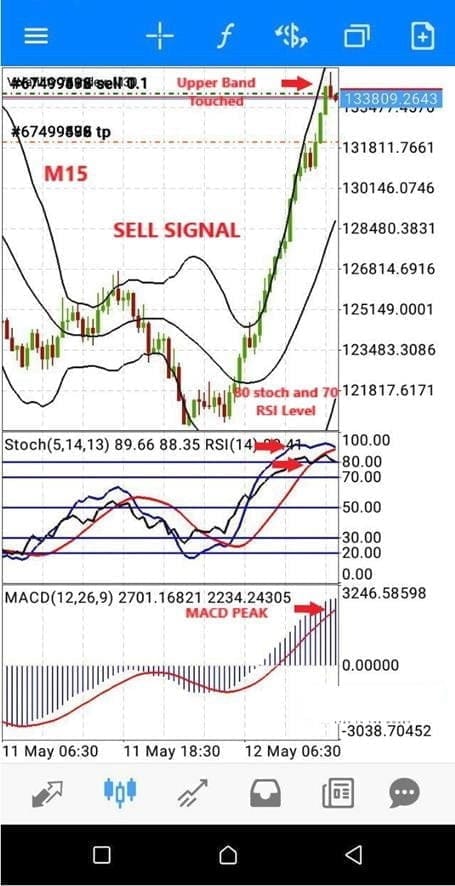
SELL SIGNAL ↓
Blue line in Stochastic Oscillator needs reach the 80 level
Black line in RSI have to reach the 70 level
MACD histogram forms a peak
The price has to touch the upper Bollinger Band
Candlestick rejections forms
Check again to be sure
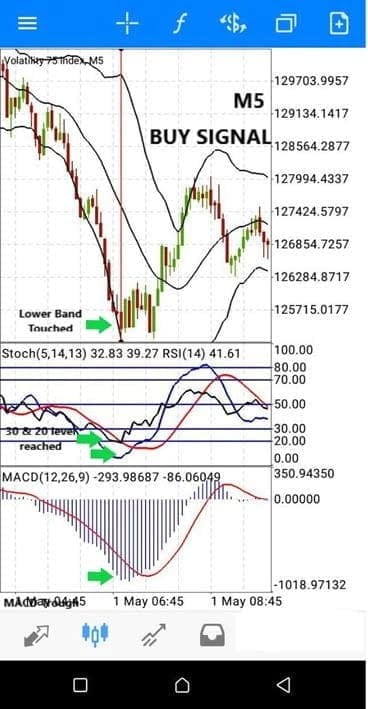
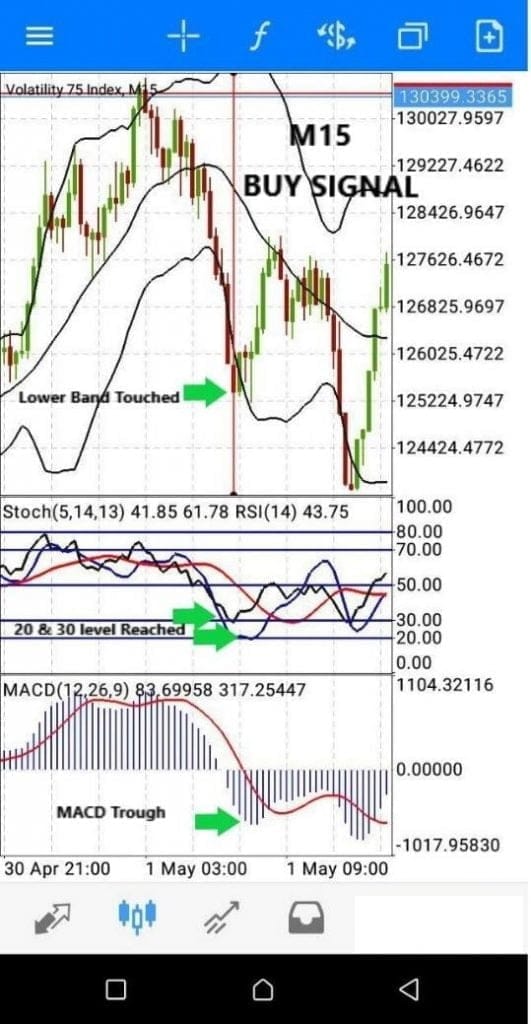
BUY SIGNAL ↑
Blue Line in Stochastic Oscillator has to reach the 20 level
Black Line in RSI has to reach the 30 level
MACD histogram forms a trough
The price has to touch the lower Bollinger Band
Candlestick rejections forms
Check again to be sure
- When all the rules for sell or buy are met on M15, draw a
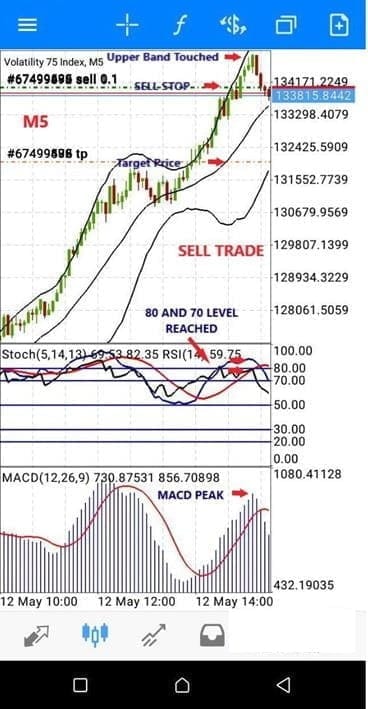
straight line to mark out the targeted reversal point. - After drawing a line on M15, move to M5 for further
confirmation. Take the following actions if you see any of the
following on M5:
Scenario 1
All the conditions met on Min 15 are also met Min 5
Action: Mark as HIGH POTENTIAL SET UP
Scenario 2
All the rules met on Min 15 are not met on Min 5
Action: DISCARD TRADE IMMEDIATELY AND WAIT FOR ANOTHER
SIGNAL ON M15
Scenario 3
All the conditions met on Min 15 are about to be met on Min 5
Action: WAIT PATIENTLY FOR COMPLETE SIGNAL FORMATION ON
M5 BEFORE ENTERING
- In the case of Scenario 1, you must carry out the following
simple analysis before entering your trade:
Switch to M30 and H1 timeframes to check if the price moves in a direction opposite to your short-term prediction. If it is, DON’T ENTER A TRADE. This is because a strong fake reversal can occur, which will mostly hit your SL.
Example:
The conditions for SELL have been met on M15 and confirmed on M5. when you checked Min 30 and H1, you noticed that the BUYING POWER is high. This means the price might not respect the signal and move along with the trend instead.
To detect the trend direction on both M30 and H1, you will check the crossover on the Stochastic Oscillator and MACD histogram formation.
BUY BIAS: Stochastic Blue line crosses the Red and moves upward, while the MACD predicts an upward movement.
SELL BIAS: Stochastic Blue line crosses the Red and moves downward, while the MACD predicts a downward movement.
- If all these conditions are met, you can safely enter your trade on M5.
HOW TO ENTER A TRADE
- All trades should be executed and monitored on M5 only.
- Before opening a trade, make sure of the lot size to use depending on your trading account’s size.
- We don’t use the Instant Execution option in this strategy, but we will use pending Stop trades (SELL STOP or BUY STOP). This will prevent us from entering the market too soon.
- When all your signals have formed on all timeframes, switch to Min 5 and place a pending STOP trade few PIPS below (For a SELL TRADE) or above (For a BUY TRADE).
- SL should be put few pips over the highest or lowest candlestick (depending on the type of trade). Note that there is always a possibility of a retest before the final movement.
WARNING: ALWAYS SET STOPLOSS AND DON’T USE A LOT SIZE
THAT IS BIGGER THAN YOUR ACCOUNT SIZE!
WHEN TO EXIT A TRADE
There are methods you can use to determine when the movement is done.
- The Bollinger Band
Price reaches the middle band or
Price reaches the last band - The Stochastic Oscillator
The blue Stoch line touches the opposite level, e.g. For a SELL entry, the line goes from 80 levels and approaches 20. Vice versa for BUY. - Constant PIP target per trade
I personally target 100 pips per trade irrespective of the movement. This 1000.0000 points per trade based on observation.
It would be best if you watched 1 and 2 to decide when to opt-out of a trade prematurely.
RULES
- Don’t be greedy. Make use of stop-loss and appropriate lot size.
- Your total opened positions should be equivalent to your normal lot size, depending on your capital.
- Keep a daily profit limit to control greed or limit overtrade.
- If a signal is not following the strategy, avoid it.
- If you are not confident with the strategy, don’t trade it.
- Read all articles on all indicators during your testing period.
- Don’t trade an amount you can’t afford to lose.
- Be confident in yourself as a trader.
- Trading is risky irrespective of the strategy.
This strategy works for my friends and me; I hope it works for
you also.
I also recommend that you take part in the Forum section at https://justforforex.com/, there are many forexes experienced
traders who will be able to answer all your questions. This will shorten your learning curve as you learn from the experts.
Read More : Bollinger Bands Trading Strategy
Download a Collection of Indicators, Courses, and EA for FREE
Wassup bro. Thanks for the strategy but you didnt give us the settings for the indicators.
Can we have the settings of the indicators please.
Plzzzz give us the settings of the indicators
where is the download button ?
All indicators are default indicators that comes with both metatrader 4&5 installed on your pc or phone.