This is like a double top reversed.
Let’s start by looking at the typical characteristics of a double bottom,
A double bottom majorly consists of 4 major parts
- Downtrend
- First bottom
- Second-bottom
- Neckline
Let me show you all the above in an illustration
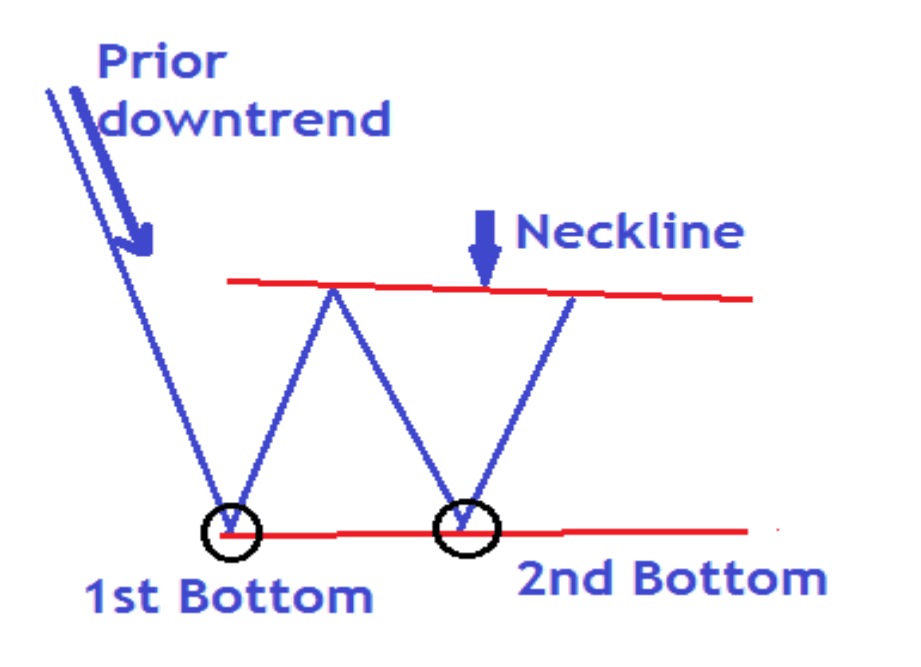
From our illustration above, the market was in a downtrend. It made an extended
move lower but was quickly rejected by support (first bottom).
The price then fell back into resistance and subsequently retested the same support level (second bottom). Once again the market was rejected from this level and rises back into the same resistance level (neckline).
Why does it form?
The psychology in the pattern is pretty simple. The bears (sellers) are exhausted
after an extended downtrend and some exit positions at the support zone. This
leads to the formation of the first bottom.
Some bears take advantage of the rise and sell the rise in price, they push price back down toward the previous low. Unable to push price back below this previous low, sellers give up and more buyers come into the market, so prices begin to rise back to resistance. This leads to the formation of the second bottom completing the double bottom structure.
A double bottom is only confirmed once the market closes above the neckline.
Now let’s get to the most interesting part, how to trade and of course make profits daily with the double bottom pattern.
Trading the double bottom
There are mainly two ways of making entries on this pattern
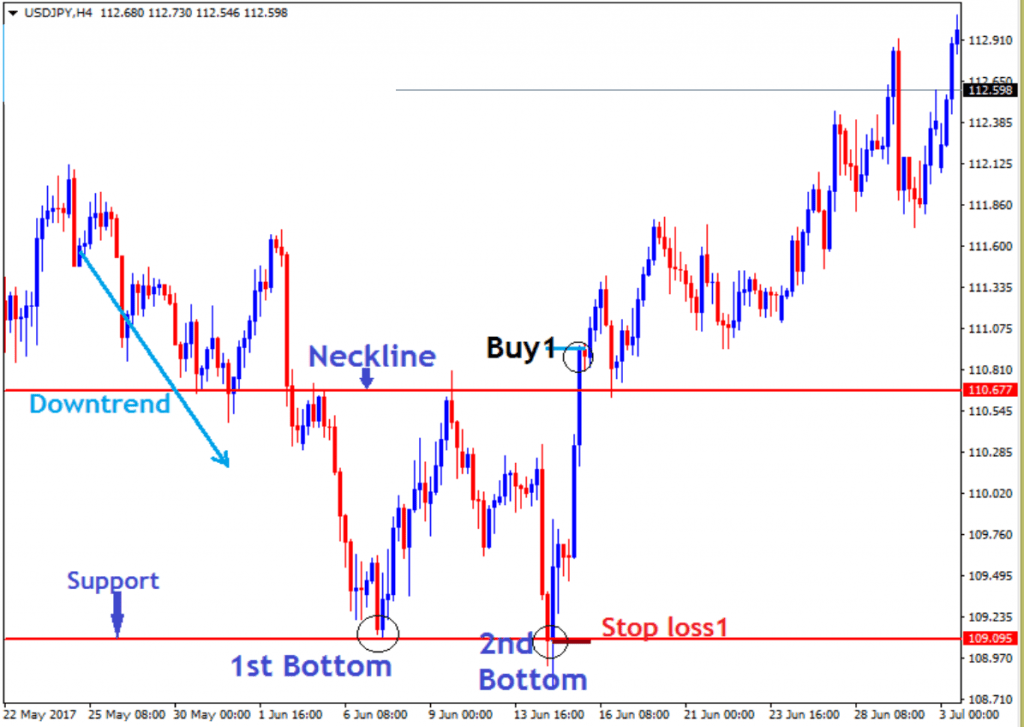
Method1
The first way to trade this pattern is to look for the neckline that is marked on the
chart below. Once the price breaks and closes above the neckline, you can then
enter the market with a buy order. Stop-loss is set just below the 2nd bottom
Now let’s look at the second method, this is my preferred and recommended way of trading a double bottom
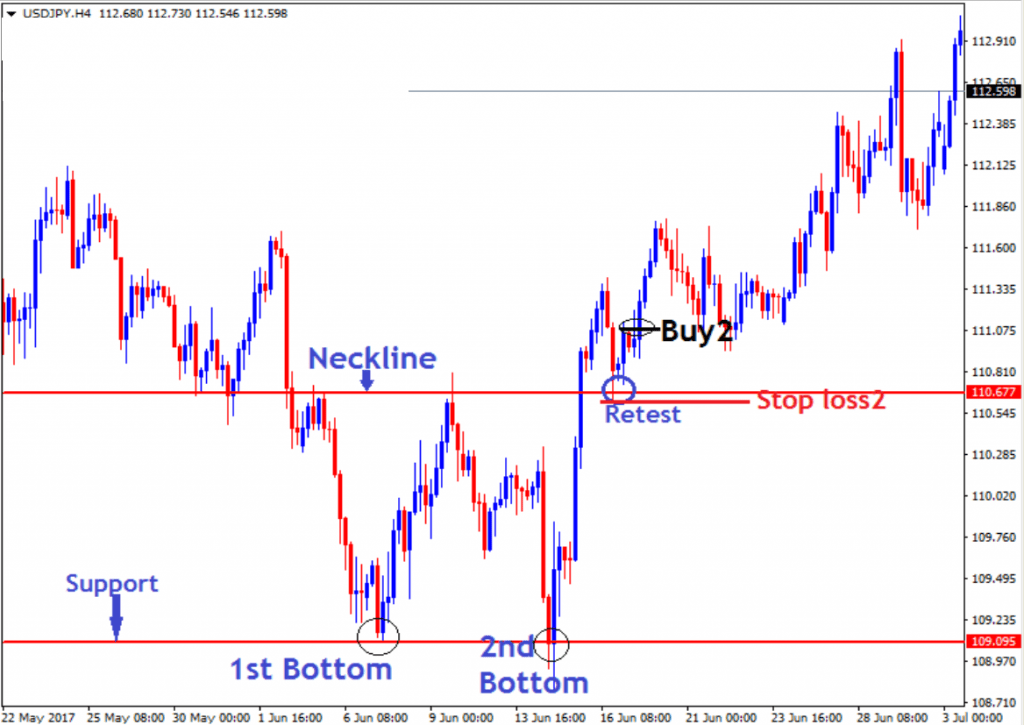
Method 2
In this case, we wait for the price to trade above the neckline (broken resistance)
and then look to place a buy order on a retest of the neckline as support (broken
resistance becomes new support). The stop loss would go below the new support as shown below
I recommend the second method for entry because it ensures a favourable risk-reward which is an essential ingredient if you wish to succeed in this business over the long-term. Let’s compare the stop losses for both entries;
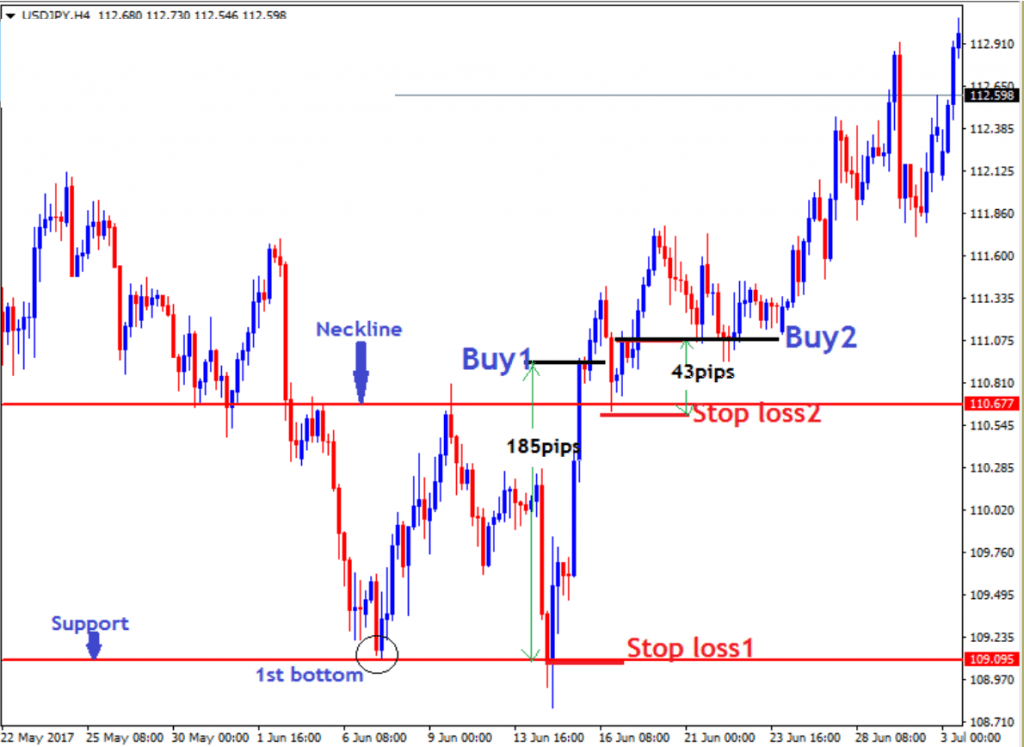
Looking at our chart above you can see how the Stop loss on the second method was cut from 185pips to only 43 pips. This means you risk less and make more profits since the target stays constant. This the main reason why I recommend this method of entry.
At this point, we have now learnt how to identify, enter a buy trade and set a stop
loss using a double bottom. The next is the PROFIT TARGET
Read More : How to Trade Forex Head and Shoulders Pattern
How to set profit targets on a double bottom.
Just like the double top, the easiest and traditional way to set a profit target on a
double bottom is a measured objective move.
This is how this is done; you take the distance (height) from the double bottom
support to the neckline and project the same distance from the neckline to a higher, future point in the market. Take a look at the chart below;
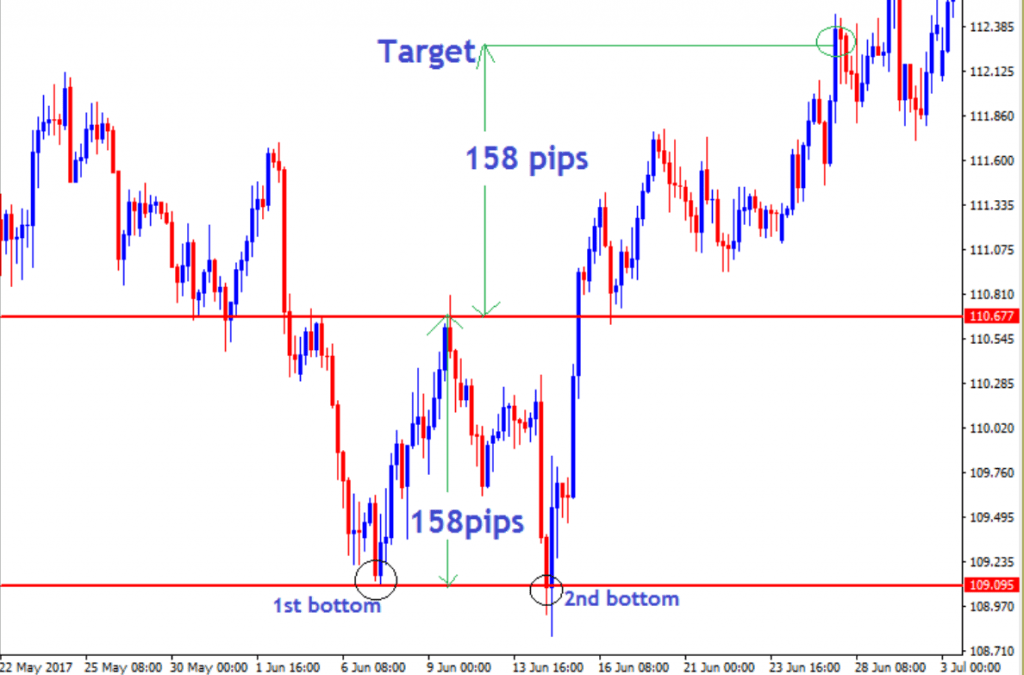
The distance from the double bottom support level to the neckline, in this case, is
158 pips. Therefore we would measure an additional 158 pips beyond the neckline
to find a possible target as shown on the chart above.
Ok That’s It for The time, Let’s Talk About how to trade forex SHOCK WAVE pattern In next article
Read part 3 : How to Trade Forex WOLFE WAVE PATTERN
I wish everyone successful trading and consistent profits !!
Join Our Forex Forum and Community : Visit
Download a Collection of Indicators, Courses, and EA for FREE


