I wrote this last because you must not miss this. This is the first time the pattern
will be shared publicly since its discovery. I had a chat with the discoverer of the
Shock Wave pattern and got consent to share the strategy with only you.
The strategy will be published in 2021, and I will let you know first when this
happens.
Just like any other pattern I have shared above, it also very versatile and occur in a wide range of time frames, over minutes or even as long as weeks or months. This is the reason why this pattern has the potential to make your profits every single day.
Shock wave pattern has a very high winning rate when fully utilized it can give large profits. The challenge at the start may be identifying the wave, but as you continue to train your eye, you will be able to see it on spot.
But most importantly, let’s look at what the Shock wave pattern is, and of course
how we can use it to make money while trading.
Attributes of the Shock Wave Pattern
Let’s begin with the illustration below
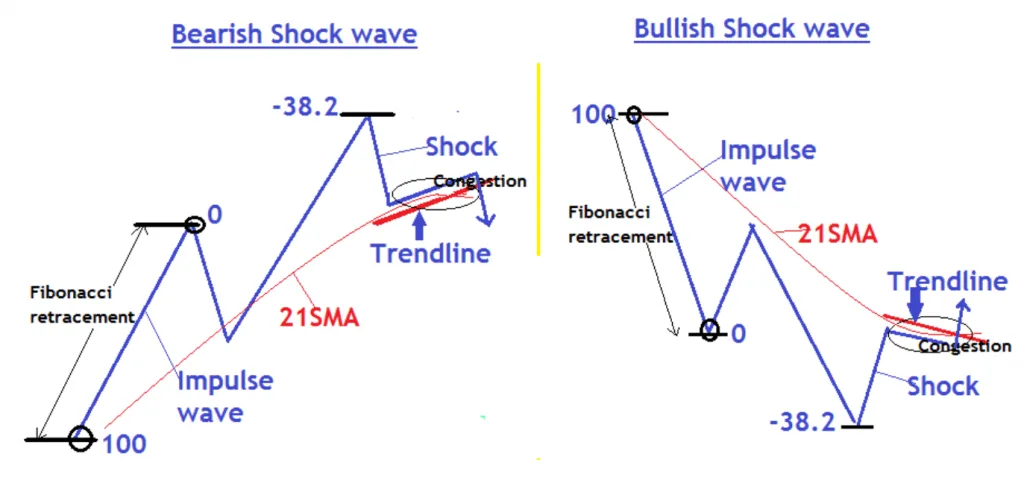
From the above illustration, there are 5 components to the Shock wave pattern that must be present in order to confirm the pattern has formed.
- Impulse wave
- Fibonacci retracement
- -38.2 retracement level(added level)
- Shock
- Small congestion and 21 Simple Moving Average
We will look at each part individually, and then later put them together with some
examples.
Impulse wave
This is a swing where the Fibonacci retracement is drawn. The retracement of
impulse wave and must at least be up to 38.2% retracement but not beyond 100%.
Fibonacci retracement
This is drawn on the impulse wave. In the Shock wave strategy, another extra level is added which is the -38.2 level after the 0 levels as shown in the illustration above. The 61.8% retracement level is the Take profit level So the main important levels are -38.2% and 61.8%. Don’t get so bothered by other levels.
-38.2 retracement level (Shock zone)
This is the zone where price must give an immediate strong opposite reaction
(Shock). Price must reach the level but also ok for price to go beyond the level as
long as the Shock is clear
Shock.
Like we mentioned above, this is an immediate strong opposite move. It is very
important because it shows a shift in strength from buyers to sellers (bearish
pattern) or vice versa for a bullish pattern
Small congestion and 21SMA
The congestion must be below the -38.2 level for a bearish pattern or above for a bullish pattern and must be in the zone of the 21SMA. The 21SMA can be through, just above/below the congestion.
The congestion indicates a total takeover of buyers or sellers after the Shock. For abearish shock wave pattern, this would mean buyers have failed to make a new high hence more sellers into the market
For a bullish pattern, this would mean that the sellers have given up and can’t make new lows and more buyers into the market. The congestion determines entries and Stop loss levels. We will discuss this in detail below Now the really fun part, how to make entries nag profit from the pattern
How to make entries using the Shock wave pattern.
The small congestion in the 21SMA zone is the trigger zone.
A trend line is drawn on the candle tails and a break and close of the candle below for a bearish pattern confirms the sell entry.
Let’s look at an example below;
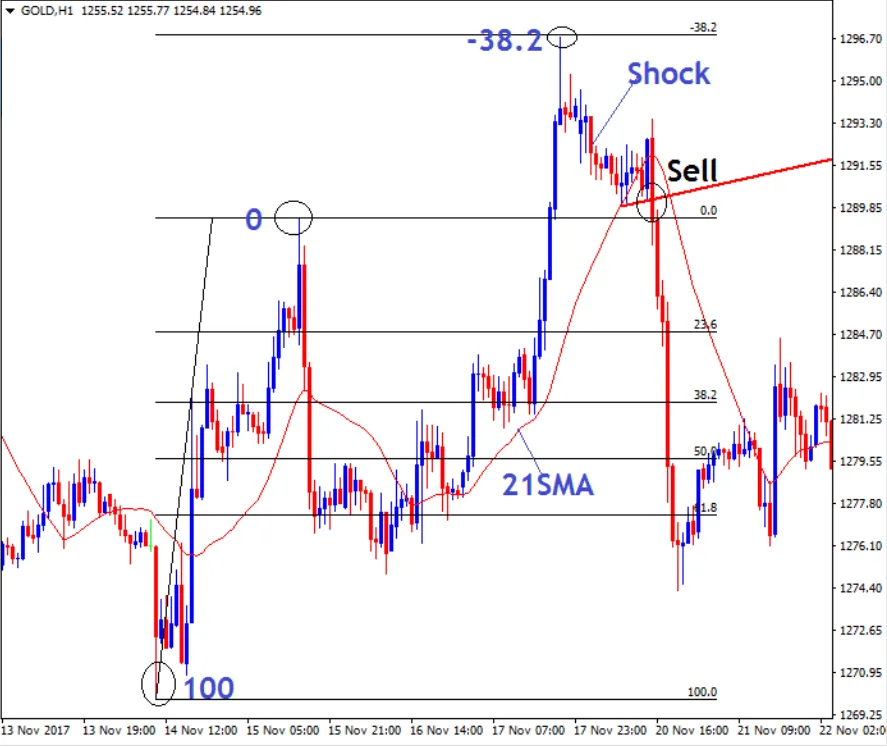
From our chart above, a break and close of the bearish candle below the trendline confirmed the Sell/short entry. For bullish pattern, a break and close above the trendline confirm the entry.
Take a look at the chart below. The bullish candle that closed above the trendline
confirmed the buy entry
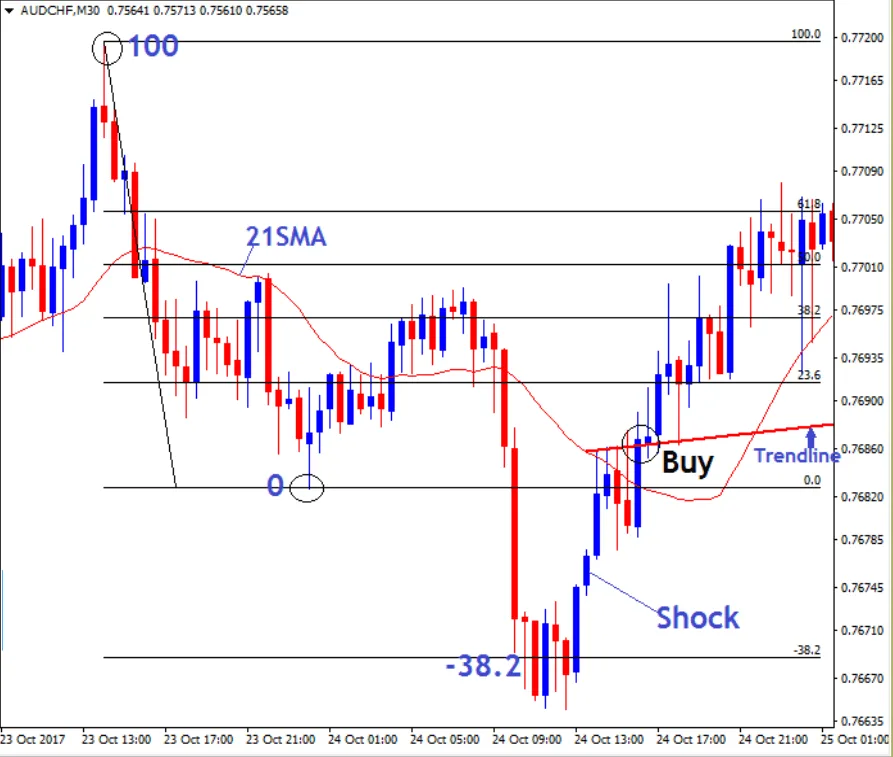
So the buy entry on the above chart is made immediately when the bullish candle closes above the trendline.
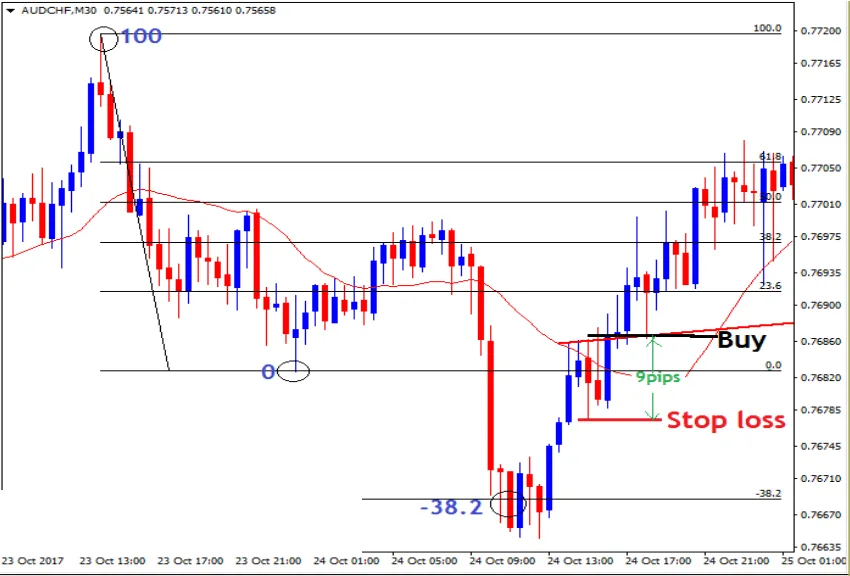
How to set Stop Loss (SL) on the Shock wave pattern
The SL is set at the highest high of congestion for a bearish pattern as shown on
example below
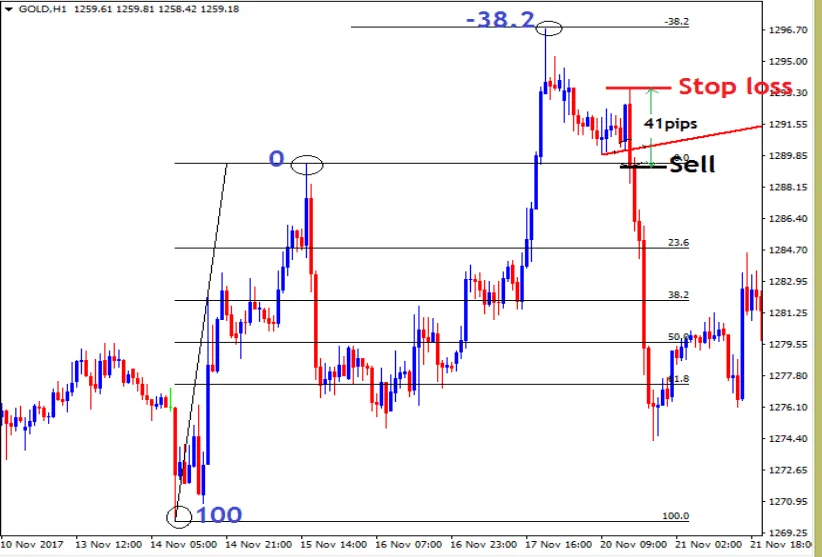
For bullish pattern our example, the Stop loss is set on the lowest low of congestion as shown below
Read More : How to Trade Forex INVERSE HEAD AND SHOULDERS Pattern
How to set target (Take Profit) on the Shock wave pattern
In this pattern the target is plain clear, 61.8% retracement level. This is
retracement of the impulse wave.
So on the Shock wave bearish pattern on
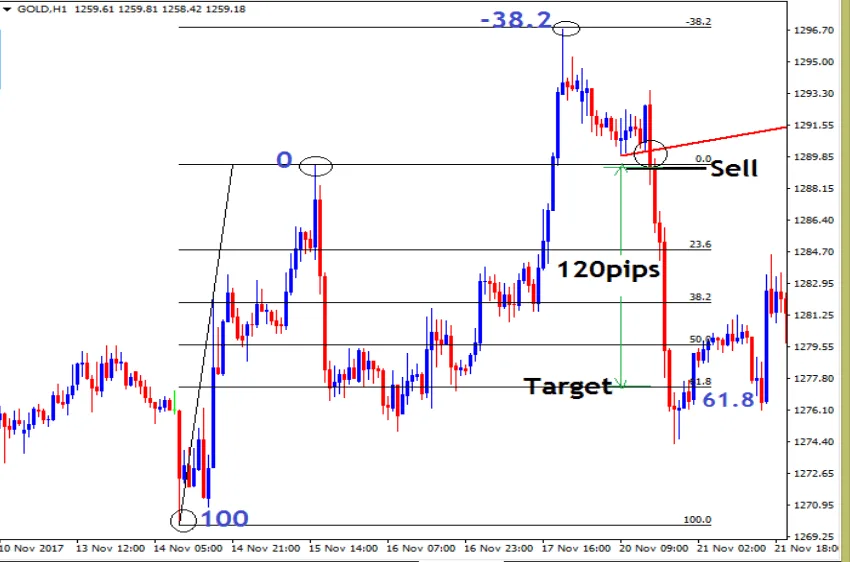
On the bullish pattern below, this would look as follows;
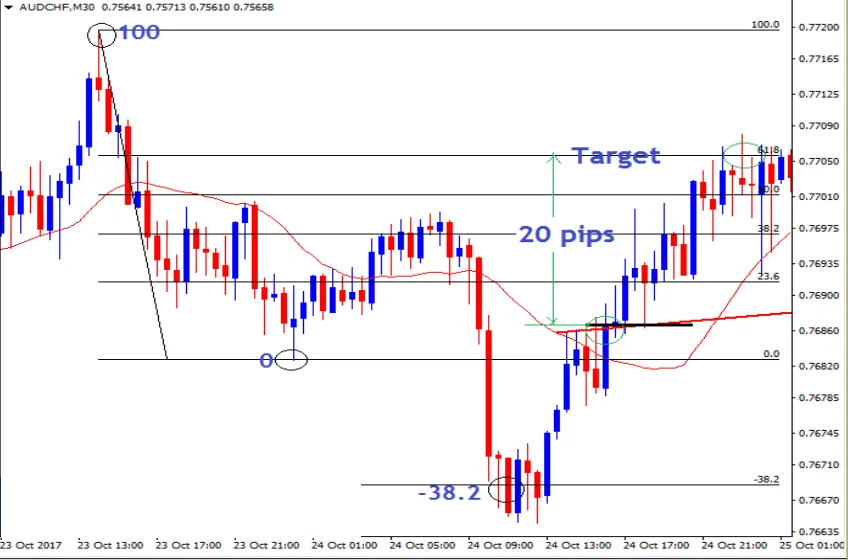
Looking at our examples above, you can see price always moves with strong
momentum so the target usually hits fast and you book your profits early. But this of course depends on the timeframe with the setup
LAST REMARKS
If you are new to forex trading, I highly recommend that you go through the https://www.forexcracked.com/education/forex-strategies/. You will get the details of what forex is, how it operates and how to profit from the entire forex market.
I also recommend that you take part in the Forum section at https://justforforex.com/, there are many forexes experienced
traders who will be able to answer all your questions. This will shorten your learning curve as you learn from the experts.
Read part 4 : How to Trade Forex DOUBLE BOTTOM PATTERN
Download a Collection of Indicators, Courses, and EA for FREE



That’s Good
Very Good !