The Forex 61.8% Fibonacci Forex Trading Strategy is a whole Fibonacci trading system based on the 61.8% Fibonacci Retracement level.
Here’s how it works:
- Sometimes, when the chart price is in an uptrend, it will eventually retrace/reverse back down to the Forex 61.8% Fibonacci retracement level and then shoots up from that level.
- Similarly, the opposite also happens in a downtrend; price will rise to the 61.8% Fibonacci retracement level and then shoot back down again from that level.
Knowing this price behavior, we can build trading rules around how to trade this price behavior.
Trading Requirements
- you must know how to draw Fibonacci retracement levels on the mt4 charts
- currency pairs: any
- timeframes: 5 minutes and up
- Forex indicators: none
- Additional tip: look for fib levels of confluence that coincide with the 61.8% level. This gives more “punch’ to the validity/success of any buy or sells signal that will generate.
Read More: Candlestick Traders – For FREE
The Strategy Buying Rules
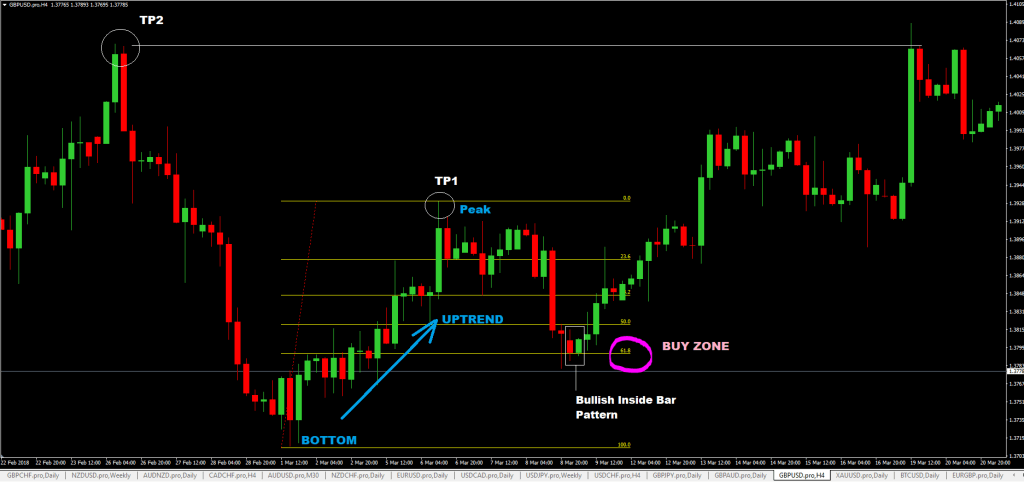
- The price must be in an uptrend, and it makes a peak and starts reversing down.
- Use the Fibonacci drawing tool on the MT4 forex trading platform and draw the fib retracement levels using the chart “bottom” and the “peak” of the mt4 price chart and wait for the price to go down to the 61.8% level.
- When the price hits the 61.8% level, look for bullish reversal candlestick chart patterns to buy. Place pending sell order 1-2 pips above the high of the chart bullish candlestick pattern.
- Place your stop loss(SL) anywhere from 2-10 pips below the low of the chart bullish candlestick pattern.
- Options for taking Profit: use risk to reward of 1:3 to calculate your take profit target level(TP), or you can use previous swing high peaks like TP1 and TP2(Take Profit) shown on the chart below and place your take profit(TP) order there.

The Strategy Selling Rules
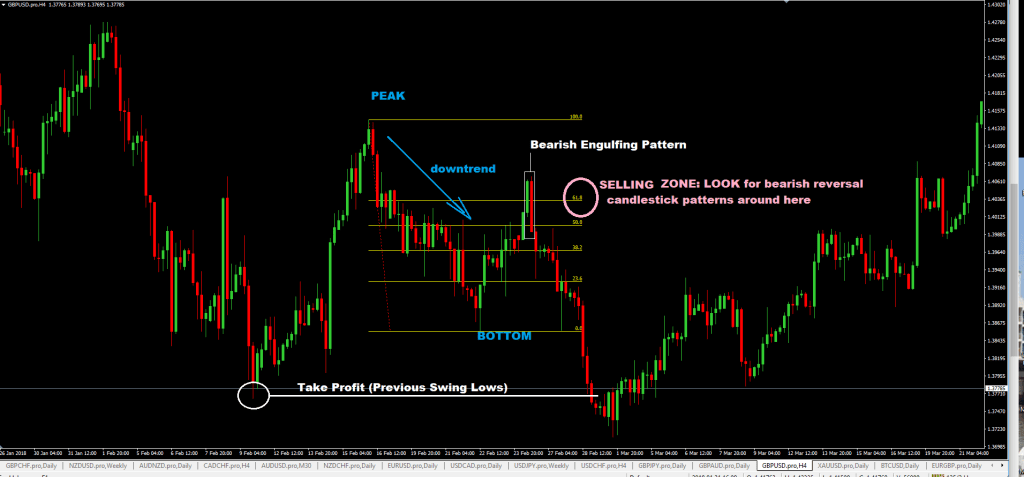
- Make sure price is in a chart downtrend, and it makes, and it makes a “bottom” and starts reversing up.
- Using the MT4 Fibonacci drawing tool, draw retracement levels on the chart, wait for the price to go up, and hit the 61.8% fib retracement level.
- If a bearish reversal chart candlestick forms in that selling zone, place a pending sell stop order 2-1 pips below the low of the bearish chart candlestick
- place your stop-loss order anywhere from 2-10 pips above the chart high of the bearish reversal candlestick
- for take profit targets, you can use previous swing lows are your take profit target levels or calculate it based on risk: reward of 1:3

Disadvantages Of The 61.8% Fibonacci Forex Trading Strategy
- As will all forex trading strategies, everyone has limitations, and for this, sometimes, you will see price will not respect the 61.8% level but will bust through it.
- Trading with lower timeframes can be an issue as there is a tendency for too much “noise,” and you as the trade will fail to see the bigger picture.
Advantages Of The 61.8% Fibonacci Forex Trading Strategy
- A straightforward price action trading system to implement
- If and when those reversal candlesticks used as your signal to buy or sell are actual/accurate, you are effectively buying at the very bottom of the top of a price swing which means.
- that your risk: reward is excellent
Read More: Daily Candlestick Breakout Forex Trading Strategy


[…] Read More Simple 61.8% Fibonacci Forex Trading Strategy […]