- What is it based on ?
Old School Simple Technical Analysis based on EMA (Exponential Moving Average) with use of Stochastic oscillator and RSI(Relative Strange index) as an
Entry and alternative Exit signal. And dynamic Stop Loss and Profit Target based
on the percentage of ADR (Average Daily Range)
- Why do i trade simple strategy ?
Complex strategies can easily draw in traders since it is somewhat logical that the more information we factor into a system, the more reliable it will be. Yet, the market does not always reward logic and when it does, it may not do it in the trader’s timeframe. Remember, the market can be wrong a lot longer than the trader can afford to be right !!
- What Should You know about this system ?
As this is a short-term trading system on lower Time Frames, it will expect traders to be extremely disciplined and focused. Every mistake You make a will and could be expensive! Learn the system, test it, believe in it, and trade it live after You are 100% positive, that this is what You are looking for. We are individuals and each has taste for different things, including trading style. If You like it then don’t forget to backtest ..backtest..backtest !!!!!
- Why do i share this system ?
There is no real reason I guess. Maybe because it is Christmas time. But mainly I
have been searching for grail before, like many others, and lost patience and money by testing different things and paying subscription fees and other crap. I find out, that trading is mostly in You as a person, and every systém works if You také it by the right end of it. I want to help traders realize, that trading needs to be taken as a disciplined business.
- Who am I ?
I am a trader who has been unsuccessful before as most beginners are. I have had a hard time getting to the profits and a few wiped out accounts before it started to turn into profits a few years ago. Since that, I have made a long way and keeping on profitable trading each year.
Basics
Trading time and Highest probability of profitable trades based on past statistics:
- Monday through Friday
- London Open 3 am – 5:30 am EST (Eastern Time)
- US Open 8 am – 10:30 am EST (Eastern Time)
- Time Frame – 5 minutes Charts
- Traded Currency Pairs:
- EUR/USD – best performer
- USD/JPY
- GBP/USD – best performer
- USD/CHF
• Avoid Trading during Banks Holidays
• Avoid Trading during Christmas Time – mostly for low volume, tight range, and unexpected spikes, which happens quite often during these times. Bank traders get on Holidays and many Black Box companies and Funds keeping prices in a range.
• Avoid Trading 10Minutes pre and 30minutes past major economical news release – Stay off trading at times of unexpected news release if You can and if such occur, close all Your opened positions and stay off until the market subsides.
• Avoid Trading if ADR (Average Daily Range) of currency pair is under 100. That means the volatility of the traded pair is too low to achieve profitable trade in the desired time. And possibly staying in a tight range.
Indicators
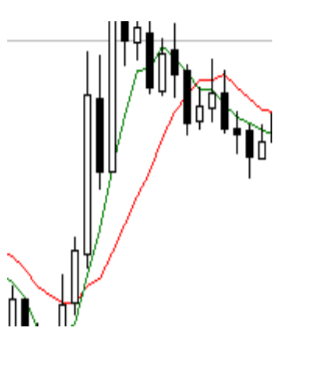
EMA – Exponential Moving Average
Basically Moving average shows traders’ sentiment.
Higher MA number = longer-term trade and position
holding in that trend (simply said).
EMA is a type of moving average that is similar to a
simple moving average, except that more weight is given
to the latest data.
Set-Up 1: EMA period 5 (green line in the chart)
Set-Up 2: EMA period 10 ( red line in the chart)
Since we are trading strategy on a smaller Time Frame with tighter SL/TP we are using faster Moving Average to avoid false signals(price movement back) which could occur with slower MA on such TF
Stochastic Oscillator
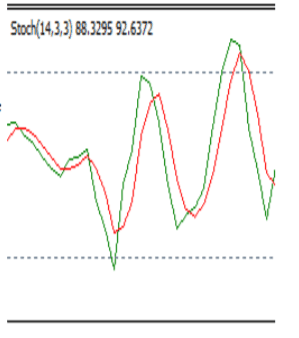
The theory behind this indicator is that in an upward trending market, prices tend to close near their high, and during a downward-trending market, prices tend to close near their low. Transaction signals occur when the %K crosses through a three-period moving average called the “%D” .
Stochastic is the only indicator I decide to optimize a little. Even tho it does not seems to be a major issue, I did change the k% period from 14 to 15 to adapt to the sensitive
markets of last year. It has been tested and proven.
Set Up : 15 , 3, 3 Simple
Levels: 80 overbought,20 undersold
RSI – Relative Strength Index
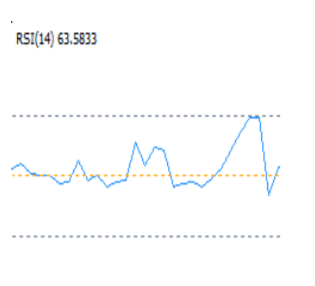
A technical momentum indicator that compares the magnitude of recent gains to recent losses in an attempt to determine overbought and oversold conditions of an asset.
Set-Up: 14
Levels : 70 (overbought)
30 (undersold)
50 ( signal level )
ADR – Average Daily Range
Daily move in pips over a period of time per currency pair. In our case, it is for 14 days. This indicator I use to determine my Stop Loss and Profit Target level per each trade I make. My basic set up of SL is 10% of ADR. PT 15% of ADR. Based on the past trading activity I recommend keeping this setting unchanged as we are keeping off major economic news and most expected volatility of the market.
If ADR is under 100 per given currency pair, I do not trade it !!!
Enter the position
- Enter the position with MARKET order on the opening of the new bar!
- Enter the position only if all signals are true!
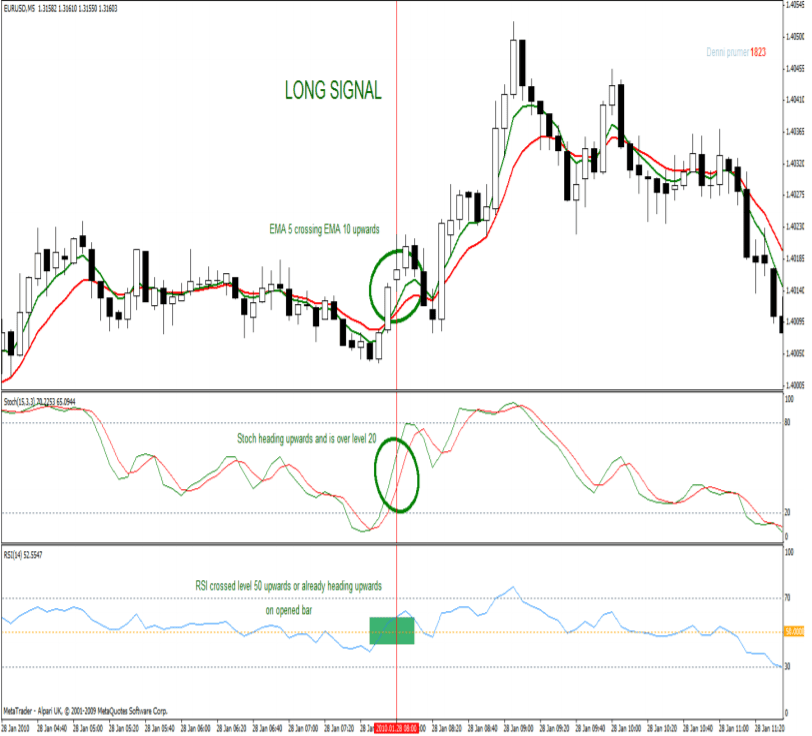
• LONG
EMA 5 crossing EMA 10 upwards at the open of the new bar
RSI heading upwards and is over level 50 or crossing at the open of the new bar
and is under level 70
STOCHASTIC heading upwards and is over level 20 and under level 80
• SHORT
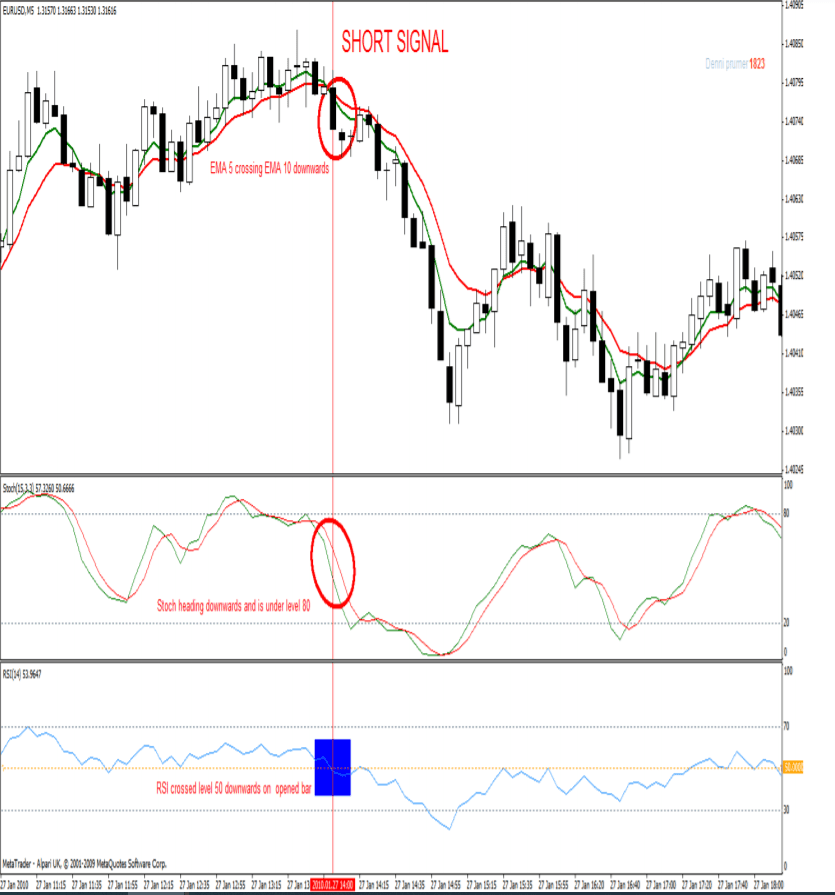
EMA 5 crossing EMA 10 downwards at the open of new bar
RSI heading downwards and is under level 50 or crossing at the open of new bar
and is over level 20
STOCHASTIC heading upwards and is over level 20 and under level 80
Exit the position
• Stop Loss
Based on the percentage of ADR. In my case 10% of Average Daily Range
• Profit Target
Based on the percentage of ADR. In my case 15% of Average Daily Range
• Trailing Stop
Set Trailing based on Your Broker’s availability to 12 points.If Your Broker will not allow it, then stick with the lowest setting possible over 12points
• Break Even
After 10pips move in Your profit direction move SL to BE
• Alternative Profit Target
If You decide to maximize Your profit by taking Your Profit Target off the charts, move Stop Loss after every 10 pips price move in Your profit direction. Do not use Trailing Stop as it moves every highest high of the current price . By moving SL You could, but it is not guaranteed, maximize Your profit . Simply said, You never know when the big move is coming. If the move goes in Your favor fast, use it.
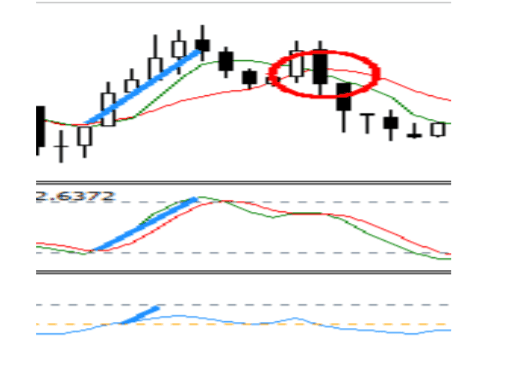
• Alternative Exit
When EMA crosses back to the opposite of Your signal after closing of the bar and stays after the opening of a new bar.
Money/Risk Management
• 2% rule – Do not risk more than 2% equity on position with this strategy can have periods of loosing as any other. If You risk no more than 2%, then You will hardly ever gets to the ugly Drawdown. Stay with this rule as this strategy is quite an aggressive trading wise. Expect up to 3 trades per traded currency pair per session. Trade with low position size based on risk management rule and keep trading forever with constant long term profit!
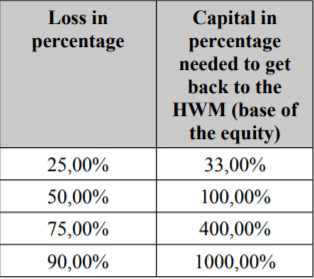
• Here is an example of getting back to the base level of equity after serious loosing
• Rule of the 4 consecutive losers
If we experience 4 consecutive losses in one session, we are ending the session and getting off the charts until the next session – NO EXCEPTION.
Get through each trade to find out possible mistakes, if any :o)
Position sizing
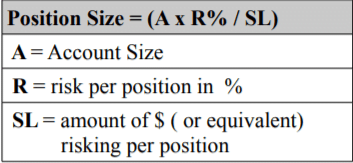
• For this strategy and few others I use Fixed Fractional Risk or You can use the 2% rule (2% of equity as position size). Both are straight and simple.
• For example use this simple calculation form.
System profitability
• I do have statistics of trading with this systém on Live account from May 2008 to November 2010 with average monthly profits of 6.3 % while trading both sessions and 4 major pairs with holidays, days off, sick days and similar taking into account. I am not going to share any Live numbers as You can Backtest them manually Your self and by this understand and learn the systém better.
The Year 2008 69%
The Year 2009 71%
In the year 2010 46%
• Win to Loss ratio over the period 54:46 (54% winners, 46% losers)
Risk to Reward ratio
• Since I have been using dynamic SL/TP based on % of ADR and my setting is 10 and 15%, then the obvious RRR would be 1:1.5. But since there have been larger profits from time to time by using moving SL without TP, my RRR gets to 1:1.7. THE ideal RRR would be around 1:2, but You have to understand, that we do trade fast on small TF !!
Expectancy
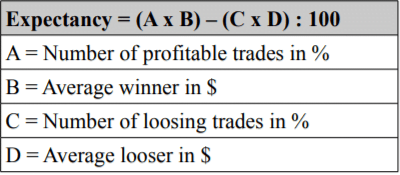
• Calculations of expectancy in currency per strategy. Expectancy calculates profit or loss from each position taken over a period of time. My expectancy based on my trading history is 78.6 $ per position (both lost and profitable) while I am trading full lots now. Expectancy at first should be taken from Backtest and Demo trading for at least 3 months each to come up with reliable numbers!
• Simply said, if You have positive expectancy over a longer period of time, Your system is reliable a You can trust it. You need to believe in Your systém to use it LIVE !!
• How to calculate Expectancy? Here is a simple form. I advise reading some of Van K.Tharp stuff to better understand the importance of Expectancy in trading
Drawdown
• Maximal Drawdown (manual trading) – 13.7% Means, that if You started trading Your account with this strategy in the last 3 years, You could lose 13.7 % in max before it begins to getting back. Since there is no assurance of such a
losing period, You have to always expect a bigger DD after the maximum DD.
You can get to trading while strategy is losing or vice versa. For that reason, each of You could have a different Balance and Equity at the end of the Year. Which is obvious.
• Maximum number of consecutive losing trades: 9
In more than one session, since we keep on 4 consecutive losers rule !!
Daily Routine
Although it might not be suited for everyone, i do keep on daily routine !
• Before the market opens :

• During the session :

• After the session :

Few words at the end
• Trading and all its aspects are dependent on the individual preparation and mental readiness of each trader!
• You need to have an individual trading plan! No plan = No profits
• Stick to the rules You believe in and are proven in long term!
• Stop looking for the holy grail. Pick a strategy, that suits You the most (for example by Time Frame, used Indicators, Calculations, that makes sense to You, and so on), test it and paper trade it. Make Your own rules based on Your own backtests and when You 100% sure and belief in it, then trade it LIVE!
• Traders are losing because
- They have no plan
- They have no experience with their systém
- They have no patience
- They change strategies way too often
Expect to be losing from time to time. There is no 100% winning systém in this world. If You believe in Your systém and use proper money and risk management, stick to Your rules even through losing period. That’s the point of systematic trading. Work on Statistics of Your past trading activity to Improve Yourself.
I guess that’s about it for now. You have a winning system in front of You, but You might be just at the absolute beginning. Now You have to work hard to get the results. Don’t look for shortcuts, don’t lie to Your self. It is not going to be easy, but definitely possible!
I wish everyone successful trading and consistent profits !!
Read More : Forex 4-Hour Stochastic EMA Trend Trading Strategy
Join Our Forex Forum and Community : Visit
Download a Collection of Indicators, Courses, and EA for FREE



where do i get the ADX for mt5?
May I have this EA with this Simple Forex Strategy Using ADR, EMA, Stochastic Oscillator