

Any simple moving average forex trading strategy needs a good trending market to be an effective forex trading strategy.
Once an mt4 trading chart shows consolidating price action, the moving averages become virtually useless. However, moving averages converging can help you objectively identify a forex market in chop.
Forex trading strategies take advantage of consolidations, either market trading the range or using a breakout forex trading strategy. Understanding various methods of technical forex analysis to identify favorable range trading conditions is something forex traders should learn so they are not mixed up in trading consolidations when they think they are trading a forex trending market.
This moving average forex trading strategy is going to focus on forex trading pullbacks in a trending forex market, and we will combine it with measures of:
- The strength of the chart trend we are trading
- If the price is either overbought or oversold
You can use this forex trading strategy in Forex or other markets as a swing approach, day trading, or even position trading.
Difference Between Forex Simple Moving Averages(SMA) And Others
In reality, the differences between many forms of forex moving averages will not improve a forex trading strategy to any measurable result. We are using forex simple moving averages(SMA) as a matter of course, and by using the SMA indicator, we will just be using the last X day’s average price.
Exponential moving averages take into account more data than the period used. However, the impact of historical chart price data decays over time.
Let’s keep things very simple and stick to the SMA
Timeframes – You can use lower time frames such as 5-minute charts. Higher timeframes (4 hours – daily chart) are my favorite timeframes for trading Forex.
Currency – Any mt4 currency pair but stick to the mt4 currency pairs that move, such as EURJPY, EURUSD, GBPUSD
Indicators – 5 and 10 forex simple moving averages (SMA), stochastic oscillator 14,3,3, and RSI setting of 9
We are using forex stochastic at 80/20 for oversold and overbought markets
RSI (relative strength index) – Measure trend strength
Trend Determination Using Moving Averages
The 5 SMA is a fast-moving average, and we will combine it with the slightly slower ten-period SMA. When the 5 SMA crosses the 10 to the upward side, we will assume we are in an uptrend.
When the five crosses to the downside over the ten simple moving averages, assume we are in a downtrend.
This is an excellent objective way to measure the trend. However, you will lag between the price action and the arrow showing the chart trend change using any technical indicator.
RELATED Daily Chart Forex Trading Strategy for Non-Day Traders
SMA Trading Strategy Rules
As with any forex trading strategy, you must follow the rules, or you will not find much success. Even better, make sure you make a forex trading plan that dictates every move you make in the forex markets.
Let’s check how a sell entry signal will show up on the chart and how you will trade the movement.
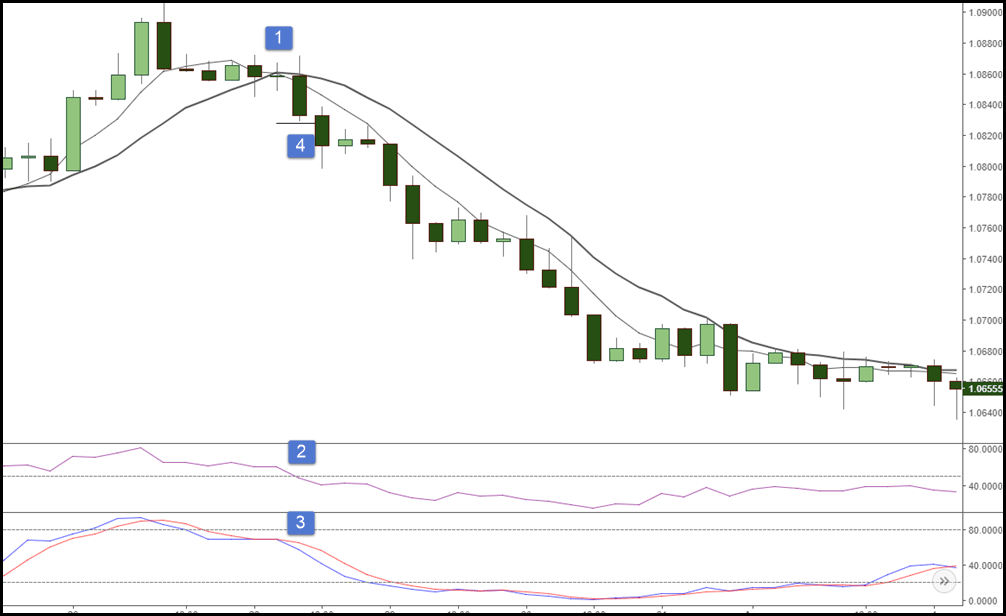
- The first thing we check for is a crossing of the 5-period simple moving average(SMA) over the 10 SMA to the downside
- Look to see that the forex RSI is either crossing or has crossed the 50 level, which indicates the momentum is to the downward side
- Has the forex stochastic left the overbought area, or is it trending to the downside in the process?
- If all the above are yes, put a pending sell stop order below the low of the chart candlestick that turned the forex moving averages
That is how you will determine a sell trade and before you trade the sell entry signal, ensure that you know where you will get out if you are wrong. We will cover stop loss(SL) positions later. The chart candlestick shown as the setup candlestick may not be the one that turned the forex moving averages.
Remember, moving averages are lagging forex indicators, and it may have been the next one that showed the precise turn.
A buy signal is the opposite of a sell entry signal.
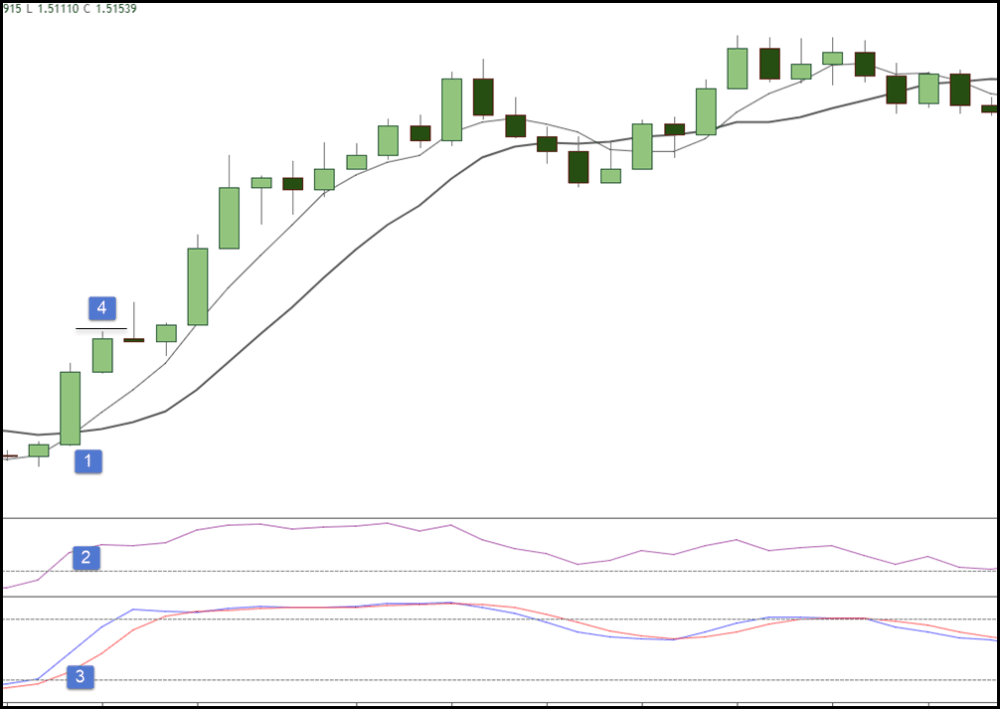
- The forex moving averages have crossed over, and the 5-period SMA is above the ten periods.
- The relative strength index has already crossed over the 50 levels indicating an uptrend.
- The stochastic indicator has crossed from oversold and is heading up
- A pending buy stop order is placed above the high of the chart candlestick that turned the forex moving averages
The only difference between a sell entry signal and a buy signal is the direction the forex indicators must show.
Download a Collection of Indicators, Courses, and EA for FREE
Stop Loss For Simple Moving Average Forex Trading Strategy
We are not believers in a set number of pips for a stop loss(SL). You have many techniques you can use for a safe stop loss:
- Use the chart high or low of the setup chart candlestick and place your stop loss below (above) that candlestick. This is dynamic as every chart candlestick will have a different range in price.
- Use a true average range to place your stop loss(SL). I’ve covered this and other stop loss(SL) placement methods in another site blog post.
Whatever method you use, the key is to be consistent with all your chart trading setups. This is why you need a forex trading plan to stay on the right track.
RELATED Parabolic SAR Forex Trading Strategy
Take Profit Strategies
Stop loss(SL) placement; taking your profits is not one size fits all.
You can read this site article, Let Profits Run, to see how to take full advantage of what the market offers instead of taking only a few pips from the move.
Some traders will target various support or resistance levels to exit their trade. Here is a support and resistance indicator for Metatrader you can download.
Fibonacci Price Targets
One of my favorite ways of finding profit targets for any strategy, including a moving average trading strategy, is Fibonacci extensions.
As you can see in this mt4 chart, price found all three targets, including finding the top at the 200% level measured from the previous swing.
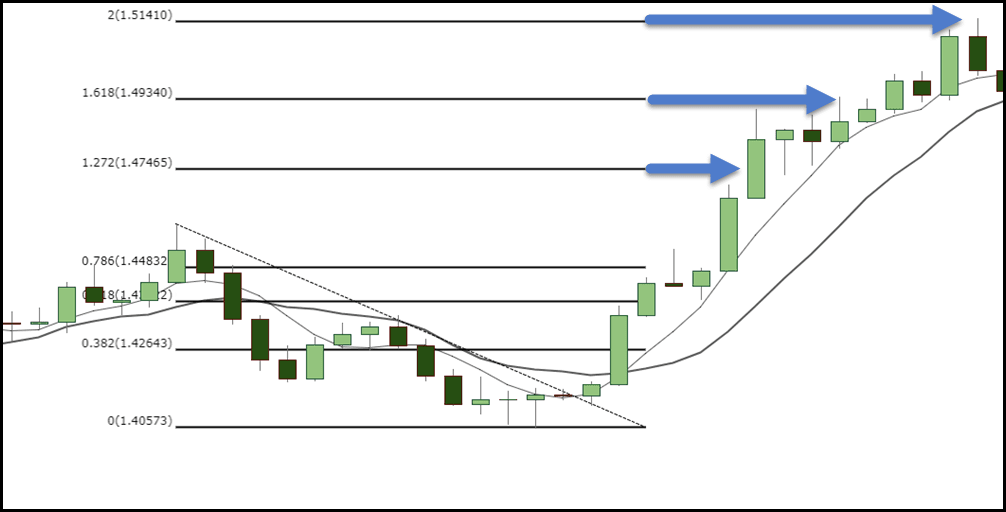
I may do an article on how to use Fibonacci in terms of taking profits. I find it incredibly useful as the various levels also act as areas to scale out partial profits.
Summary
As you can see, this is a simple moving average trading strategy that takes into account trends and momentum for your trading signals.
Ensure you use stop losses and risk control and find ways to take what the market offers without knee-jerking out of your trades.
[…] weekly moving average levels. The trading signals are based on the crossover of the 5-period daily moving averages and the 1-period weekly moving averages. They can be plotted on the current […]