EMA gives the meaning of Exponential Moving Average, and this is one of the most commonly used forex trading strategies. Simple Moving Average (SMA) This is a result of the This helps to determine entry and exit points of the trade base on the place of price action sit on the trading chart. When a forex trading using this EMA, it relies on selecting shorter-term EMA and a longer-term EMA. Then the trade base on the position of the short term EMA concerning the long term EMA. After considering all these things, a trader enters to buy orders when the short term EMA crosses over the long term EMA. Or else, traders move into sell orders when the short period EMA crosses below the long term EMA. This strategy gives more weight to the recent data and also EMA reacts faster to current prices than SMA.
- Read More The Best Forex Strategy for You in 2020
What is EMA and how to calculate?
Traders use this to smooth the variations in data to determine the underlying trend. EMA leads to calculating the average of the values by looking back at a recent number of data points. EMA is adding a portion of the current price. To a part of the value of the previous moving average.
Usually, EMA calculate at the time (t), and the formula of an exponential moving average is as follows:
EMAt= ɑ x current price + (1- ɑ) x EMAt-1
ɑ is a smoothing constant in which the value between 0 and 1.
EMAt-1 is the EMA for the previous period. So, to calculate EMA for a specific time require the previous calculations of EMA. If we calculate daily EMA, we can derive the current value of the previous day’s EMA.
Use EMA with the trend
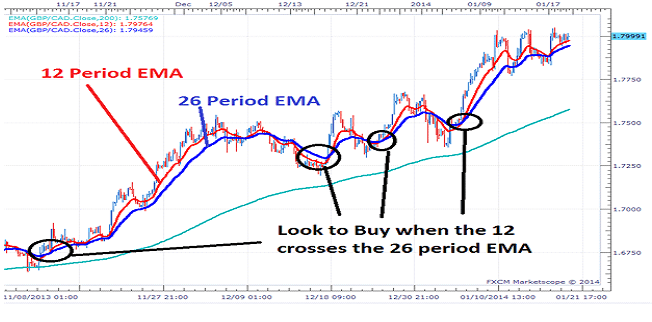
As mentioned earlier, a more effective way of reading the EMA cross is by using a double exponential moving average combination. It means, one short-term and one long-term EMA. This strategy creates a trading signal when the shorter EMA crosses the longer one.
If the short term EMA crosses above a long time EMA, it is an uptrend market, and if the short term EMA crosses below the long term EMA, it usually is known as a downtrend.
As an example, a longer-term trader may use 12-day EMA as a short term average and 26-day EMA as the long-term trend line. In this situation, the trader will buy when 12-day EMA crosses above the 26-day EMA while selling when the 12-day EMA crosses below the 26-day EMA.


This crossover strategy had mostly used before the computerized charts invented. But after the digital operations came into the market traders can access charts and indicators. So now this uses to indicate the uptrend and the downtrend in trading. So, now the most popular EMA strategy in trading is pullbacks.
- Read More one-minute forex scalping strategy
How to use EMA to Trade Pullbacks
Pullbacks also name as retracements, and this is one of the most popular trading strategies since they usually don’t go up in a straight line. Always there is a rest period before continuing the trend.
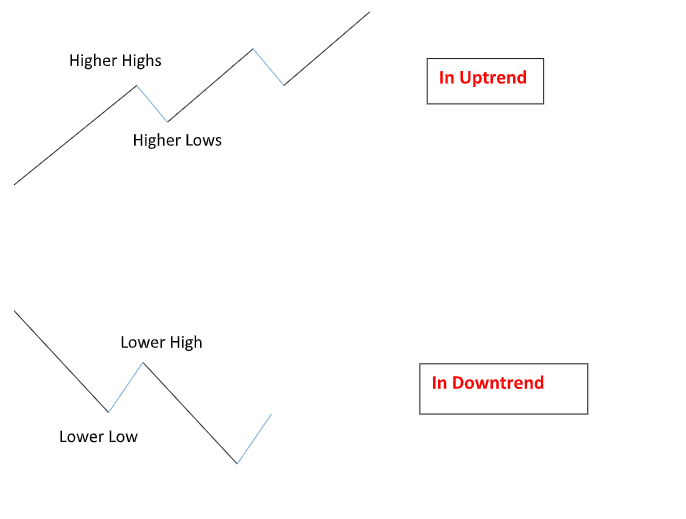
When markets are in a high position of an economy (uptrend), they form higher highs and higher lows. So, the higher lows consider as the pullbacks.
When we turn in to the other side, it means if there is a downtrend, they form lower lows and lower highs. In this situation, lower highs are the pullbacks.

These pullbacks are great opportunities for traders to get into a trade before the market resumes its trends. So, the EMA is the best way to trade pullbacks.
- Read More A Simple Forex EMA Strategy
Why is EMA better than SMA?
Even though there are many types of moving strategies in forex trading, most commonly used strategies are EMA and SMA (Simple Moving Average). But the most effective strategy is EMA. When you plot the EMA and SMA on the same chart, you may notice that EMA stick closer to price. So, when EMA strategy uses to pullbacks, it make the market seem like it is bouncing off the EMAs. But when we use SMA, it isn’t as sticky as EMA.


[…] Moving Average indicator is a customized moving average forex indicator. It is a very reliable forex indicator with a high winning rate. XP Moving […]
[…] 4-hour time frame, wait for a retracement on the 1-hour chart, and then enter a long trade when the EMA (5) crosses over through the EMA (20) on this same time frame when the longer-term trend […]