

Heiken Ashi for Forex Trading is a powerful charting method that helps smooth out market noise and reveal clearer trends. Unlike standard candlesticks, Heiken Ashi uses averaged data to give you a better view of price direction making it easier to spot entries, ride trends, and avoid false signals. In this guide, you’ll learn how to use Heiken Ashi for Forex Trading effectively, from understanding the basics to advanced and combining it with other indicators for consistent results.
Table of Contents
Introduction to Heiken Ashi
Heiken Ashi (pronounced “hay-ken ah-shee”) is a Japanese term that translates to “average bar.” This chart type is designed to eliminate much of the short-term volatility that can overwhelm traders who rely on standard candlestick charts. By modifying how candlesticks are formed, Heiken Ashi aims to present a clearer picture of price action, enabling traders to ride trending moves and reduce the occurrence of false signals.
Why Traders Use Heiken Ashi
- Smoother Price Trends – Heiken Ashi candlesticks often show extended periods of uniform color, indicating a sustained bullish or bearish trend with fewer whipsaws.
- Improved Clarity – By averaging out open, high, low, and close values, Heiken Ashi helps traders stay focused on the bigger market move rather than short-term spikes.
- Easier Trend Identification – Many traders find that identifying trends, pullbacks, and trend reversals becomes more straightforward with Heiken Ashi charts.
Whether you are a swing trader, day trader, or scalper, integrating Heiken Ashi into your charting approach can help you gain a more robust understanding of market momentum and reduce impulsive trading decisions.
The Fundamentals of Heiken Ashi
Before diving deep into strategies and technical applications, it is important to understand the basics. A standard candlestick will show the open, high, low, and close (OHLC) of a particular period (e.g., a 1-hour, 4-hour, or daily candle). In contrast, Heiken Ashi candles are calculated using some of the previous candlestick’s data, resulting in a smoother transition from one period to the next.
Core Components
- Open – Instead of using the current period’s actual open, the Heiken Ashi open is derived from the midpoint of the previous candle.
- Close – The Heiken Ashi close is the average price (open+high+low+close) of the current candle.
- High/Low – The highest and lowest values in a Heiken Ashi candle are determined using a combination of the current high/low and the calculated open/close.
These formulas will be explicitly covered in a later section, but the main takeaway is that Heiken Ashi relies partly on previous bar data to compile a new bar. This smoothing effect is what makes Heiken Ashi distinct and a favored tool for trend traders.
How Heiken Ashi Differs from Traditional Candlesticks
Because Heiken Ashi candles incorporate averaged data, there are a few key differences compared to traditional Japanese candlesticks:
- Lagging Effect – Heiken Ashi introduces a slight lag. This means the signals you get are not always reflective of the precise current market price. In return for this lag, you gain a more reliable view of the trend.
- Fewer Noise Candles – Standard candlesticks can change color (from bullish to bearish or vice versa) multiple times in quick succession during choppy markets. Heiken Ashi candles tend to remain one color longer, filtering out many minor oscillations.
- Candle Shapes – In normal candlestick charts, a candle with a long wick (shadow) might indicate significant price action within that period. In Heiken Ashi, some wicks are shortened or sometimes hardly visible because the calculations smooth out the extremes.
- Use in Identifying Trends – Heiken Ashi is used primarily as a trend-following or trend-identification method. Standard candlesticks can serve multiple purposes (reversal patterns, doji patterns, engulfing patterns, etc.). While you can still analyze patterns with Heiken Ashi, the real strength lies in its clarity in showing trend direction.
- Potential Delay in Entry/Exit – Because the Heiken Ashi open and close calculations deviate from actual market prices, you might get delayed signals to enter or exit a trade. This “delay” is often seen as the cost of reduced whipsaws.
When using Heiken Ashi, it’s vital to remember that you’re looking at a modified interpretation of the market’s price action. It does not necessarily reflect the actual traded price at any single point in time. Instead, it provides a smoothed perspective that can keep you in profitable trends longer.
Interpreting Heiken Ashi Candles
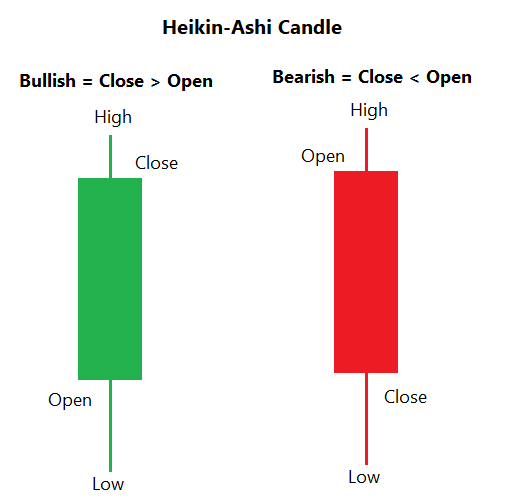
The main function of Heiken Ashi in Forex trading is to help identify and follow trends. Therefore, the color of the candlestick (which is typically green/blue for bullish and red for bearish on most trading platforms) and the presence or absence of wicks can speak volumes about market sentiment.
Bullish Trend Indicators
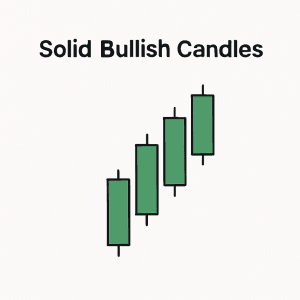
- Solid Bullish Candles: When you see a series of candles in a row without lower wicks (or with very small lower wicks), it typically indicates a strong uptrend.
- Green (or Blue) Consecutive Bars: If the Heiken Ashi chart consistently prints bars of the same color, the trend is said to be stable and bullish.
Bearish Trend Indicators
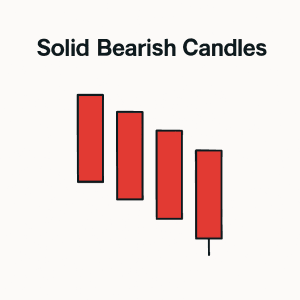
- Solid Bearish Candles: Heiken Ashi candles with no upper wick are often indicative of a strong downtrend.
- Red Consecutive Bars: Similar to bullish trends, multiple consecutive red bars signal consistent bearish momentum.
Transition or Weakening Trend
- Candles with Both Upper and Lower Wicks: These bars can indicate indecision. They often appear when the trend is losing momentum or when the market is moving sideways.
- Changing Candle Colors: If the chart starts to produce alternating bullish and bearish candles, especially with wicks on both ends, the market may be choppy or reversing.
By using Heiken Ashi candles, traders can often “see” the forest for the trees. Instead of getting lost in every little tick, Heiken Ashi guides them to focus on the major directional movement.
Calculating Heiken Ashi Candles
For a complete understanding of Heiken Ashi, you should know the formulas. Even though most trading platforms automatically calculate and display Heiken Ashi charts, grasping the math behind it can deepen your appreciation for how these candlesticks are formed.
Let:
- H AOpen(t) = the open of the Heiken Ashi candle at time t.
- H AClose(t) = the close of the Heiken Ashi candle at time t.
- H AHigh(t) = the high of the Heiken Ashi candle at time t.
- H ALow(t) = the low of the Heiken Ashi candle at time t.
- O(t) = the actual open of the period at time t.
- H(t) = the actual high of the period at time t.
- L(t) = the actual low of the period at time t.
- C(t) = the actual close of the period at time t.
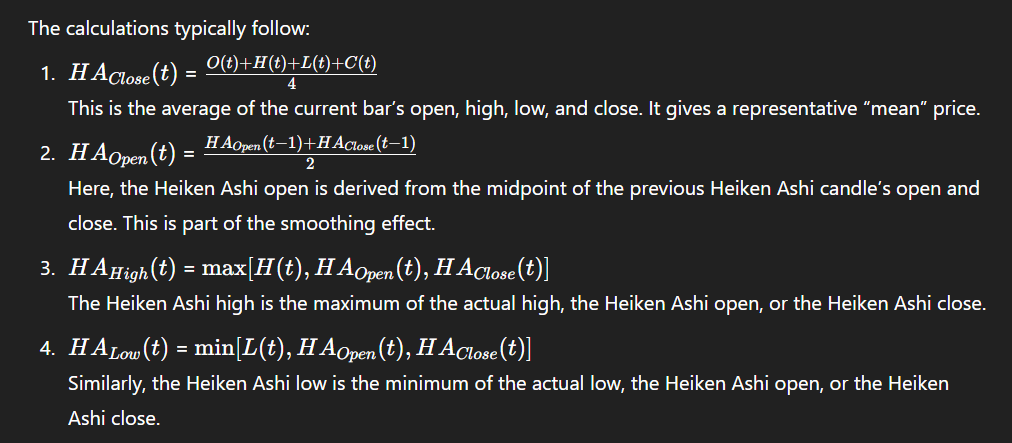
By using the previous period’s Heiken Ashi data to compute the current bar (specifically the open), the chart achieves a smoothing effect. In other words, volatility is somewhat “averaged” out.
Key Benefits of Heiken Ashi in Forex Trading
Heiken Ashi has gained traction because it can improve many aspects of a trader’s decision-making process. Some of the main benefits include:
- Smoother Trends – One of the top reasons traders adopt Heiken Ashi is the way it visually smooths out the trend. This reduces confusion and allows for more confident trend trading.
- Reduced Whipsaw Noise – Forex markets can be extremely volatile, especially around economic news releases or other catalysts. Heiken Ashi filters out some of these abrupt fluctuations, leading to fewer false alarms.
- Clearer Signal to Stay in a Trade – In an ideal scenario, a Heiken Ashi uptrend will show continuous bullish candles for an extended period. As long as the candle color and shape remain indicative of bullishness, traders have a visual cue to stay in a profitable trade longer.
- Ease of Spotting Possible Reversals – When the Heiken Ashi bar colors change from bullish to bearish (or vice versa), it can be a strong signal that the market trend might be shifting. This can alert traders to tighten stop-losses or exit trades accordingly.
- Adaptable to Different Time Frames – Whether you trade on the 1-minute, 5-minute, hourly, or daily charts, Heiken Ashi can be applied seamlessly. That said, the reliability tends to be higher on higher time frames.
Because these candles simplify the identification of trends, many traders looking to remove emotional guesswork from their trading find Heiken Ashi charts beneficial for staying objective.
Potential Drawbacks of Heiken Ashi
While Heiken Ashi offers many advantages, it is not without limitations. No indicator or chart type is a cure-all solution. Below are some potential drawbacks to keep in mind:
- Lag in Signals – Because Heiken Ashi relies on averaging, it lags behind the actual price movements. This means that if the market suddenly changes direction, a Heiken Ashi chart might only show that reversal once it’s in progress, sometimes leading to slightly late entries and exits.
- Less Detail on Intraday Volatility – Some traders thrive on seeing intraday price spikes and dips because they use them to scalp or make quick trades. Heiken Ashi might obscure these quick movements.
- Potential for Overconfidence – The smoothing effect may lull traders into a false sense of security, especially if they ignore actual price levels. When using Heiken Ashi, it is often wise to glance at a standard candlestick chart or other indicators to confirm price action before entering a trade.
- Limited Use in Certain Market Conditions –If the market is range-bound, Heiken Ashi can still produce misleading signals. Candles might shift between bullish and bearish repeatedly, so staying mindful of additional support/resistance levels is essential.
- No Guarantee of Profit – As with any technical analysis tool, Heiken Ashi is not a guarantee of success. Proper risk management and supplemental analysis are still crucial.
Understanding these drawbacks ensures you know how to work around them. Many professional traders incorporate Heiken Ashi but also use other analysis methods to avoid blind spots.
Combining Heiken Ashi with Other Indicators
Using Heiken Ashi alone can be effective, but many traders prefer a multi-indicator approach to gain confirmation. Below are some common indicator pairings:
- Relative Strength Index (RSI) – Helps assess overbought or oversold conditions. You might choose to avoid entering a bullish position if the RSI is extremely overbought, despite Heiken Ashi signaling bullishness.
- Moving Averages – Help identify overall trend direction and dynamic support/resistance. If Heiken Ashi shows bullish candles and price is above a rising moving average, it adds extra confirmation to take long trades.
- Bollinger Bands – Heiken Ashi candles that strongly push against the upper or lower Bollinger Band can signal potential trend continuations or reversals.
- MACD (Moving Average Convergence Divergence) – MACD’s histogram and signal lines can confirm if momentum is building in the same direction as your Heiken Ashi candles.
- Volume Profile / Volume Indicators – While volume in Forex is decentralized and not as transparent as in stock markets, many platforms still provide a volume approximation. A strong bullish Heiken Ashi bar accompanied by rising volume can be a powerful combination.
Download a Collection of Indicators, Courses, and EA for FREE
When combining indicators, be careful about overloading your chart. Too many tools can lead to “analysis paralysis.” It’s often best to select one or two complementary indicators and master how they work in conjunction with Heiken Ashi.
Time Frames & Best Practices
Heiken Ashi charts can be applied to any time frame. However, each time frame has its nuances:
Short-Term (1- to 15-Minute Charts)
- Pros: More trading opportunities, suitable for scalping.
- Cons: More susceptible to noise, so Heiken Ashi’s smoothing might still produce choppy signals during high volatility sessions.
Medium-Term (30-Minute to 4-Hour Charts)
- Pros: Balanced approach, popular with intra-day and short swing traders.
- Cons: Market changes can still occur overnight or between sessions, requiring careful position management.
Long-Term (Daily, Weekly Charts)
- Pros: Less noise, clearer trends, fewer false signals.
- Cons: Fewer trade entries, requiring patience; bigger stop-loss distances might be necessary.
In general, higher time frames are more reliable when using any form of trend-following approach, including Heiken Ashi. That being said, many traders successfully use a multiple-time-frame approach:
- Step 1: Check the daily Heiken Ashi chart to see the overall trend.
- Step 2: Move to a lower time frame (1-hour or 4-hour) for entry signals.
- Step 3: Manage the trade based on candle color changes in the chosen entry time frame, always keeping the higher time frame trend in mind.
Practical Example: Applying Heiken Ashi to a Forex Pair
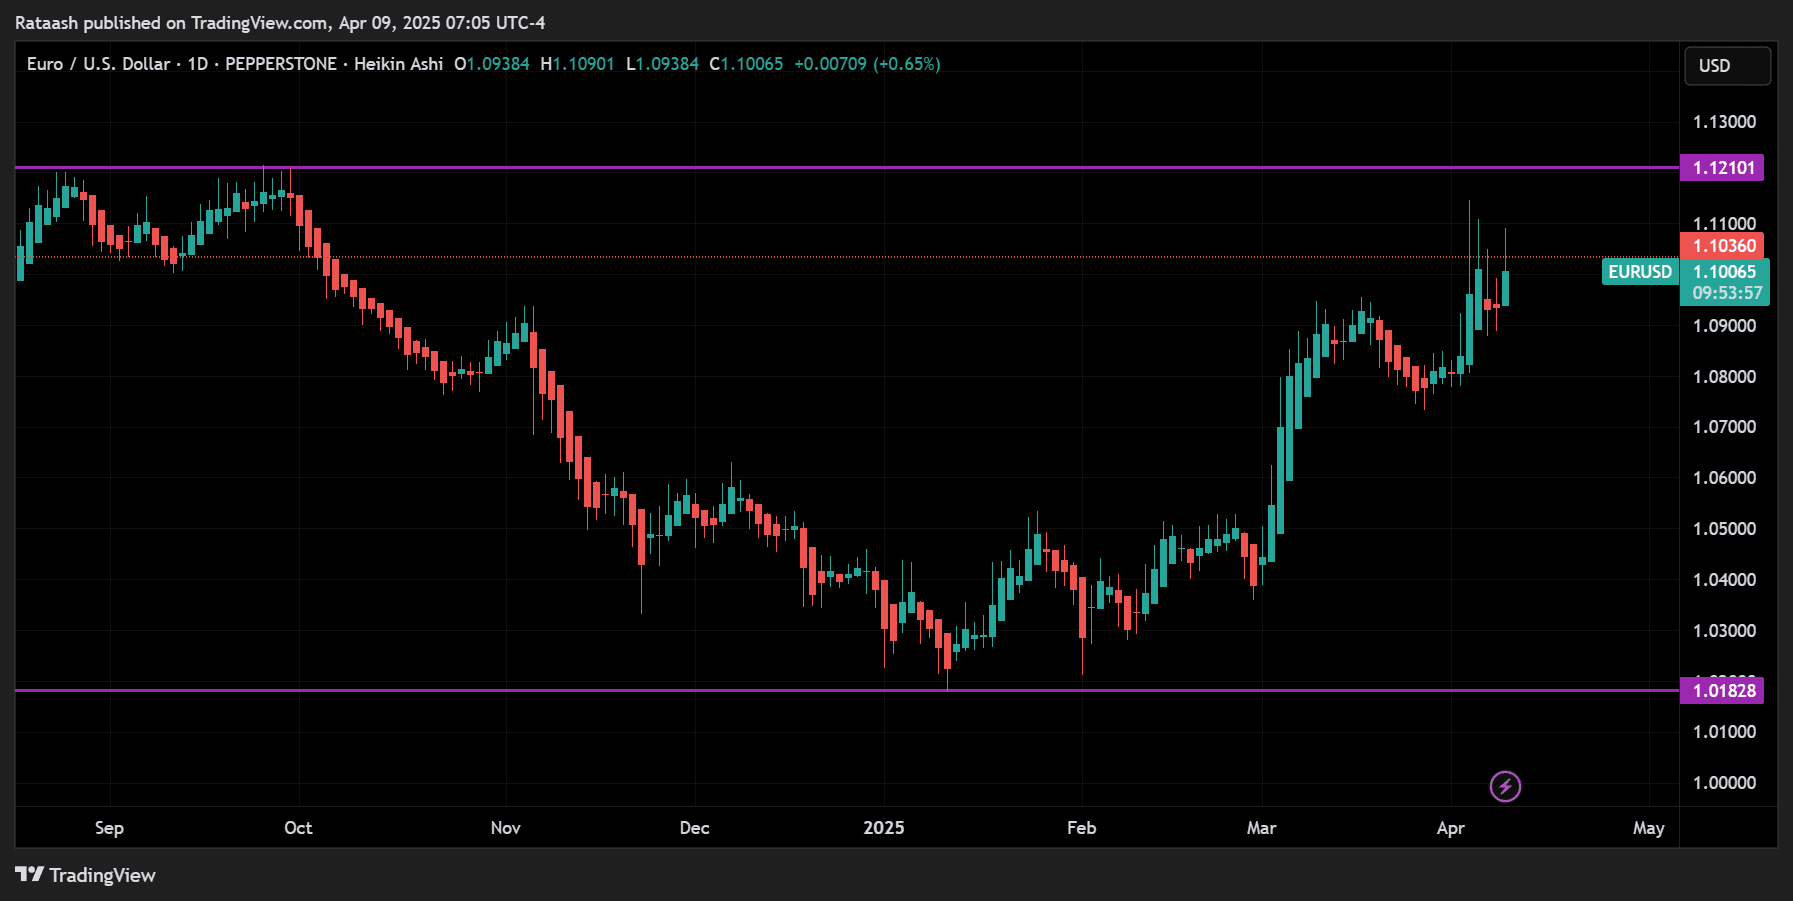
Let’s illustrate how you might use Heiken Ashi in a real trading scenario. Imagine you’re analyzing the EUR/USD pair on a 1-hour chart.
- Trend Identification – The past several Heiken Ashi candles are bullish (green) with small or non-existent lower wicks. This suggests a strong upward momentum. You also notice that the daily chart is bullish overall.
- Confirmation – A quick glance at a 20-period SMA also slopes upward. RSI is around 60-65, indicating upward momentum but not extreme overbought conditions.
- Entry – You decide to enter a long position on the next bullish Heiken Ashi candle open because it confirms continued bullish momentum. Let’s say that candle opens at 1.1200 (hypothetical example).
- Stop-Loss Placement –You place a stop-loss just below the recent swing low at 1.1180 to protect your capital.
- Trade Management – As each new Heiken Ashi candle forms, you monitor for any color change or a large upper wick that might signal weakening bullish momentum.
- Outcome – Over the next five hours, the candles remain bullish. Eventually, you see a candle form with a larger lower wick than usual and a slight color change from green to red. This occurs around 1.1240. You decide to exit your trade, locking in 40 pips of profit.
In this scenario, the Heiken Ashi chart helped you catch a chunk of the trend without getting shaken out by intraday volatility. Of course, if the candles had turned bearish sooner, you might have exited earlier or avoided entering altogether.
Risk Management with Heiken Ashi
Risk management remains crucial. While Heiken Ashi may help you stay in winners longer, no tool is foolproof. Here are some guidelines:
- Position Sizing – Always calculate how much of your account you are risking per trade. Many professional traders limit risk to 1-2% per position.
- Stop-Loss Placement – If you rely on Heiken Ashi signals alone for stops, you could place your stop at the level where the candle color last changed. Alternatively, use actual price action swing highs or lows on a standard candlestick chart for added precision.
- Trail Your Stop – Trailing stops can be especially powerful with Heiken Ashi. For instance, if you see each bullish candle forming a higher low, move your stop-loss just below each new low. This way, you lock in profits if the trend reverses.
- Avoid Over-Trading – One of Heiken Ashi’s advantages is that it encourages you to focus on major trends. Resist the urge to take every minor signal in a sideways market. Patience can improve your overall win rate.
- Have a Maximum Drawdown Policy- Decide in advance how many losing trades in a row or how much account drawdown you can tolerate before stepping away to reassess.
By combining proper risk management with the smoothing benefits of Heiken Ashi, you can avoid catastrophic losses and potentially let winners run.
Common Mistakes and How to Avoid Them

Even experienced traders can fall prey to errors, especially when adopting a new chart type like Heiken Ashi. Below are some common pitfalls:
Ignoring Real Price Data
- Mistake: Traders might rely solely on Heiken Ashi bars, forgetting that real-time price might differ.
- Solution: Double-check actual support/resistance levels or candle closes on a standard chart before making high-stakes decisions.
Exiting Too Late
- Mistake: Because of Heiken Ashi’s lag, a trader might hold onto a losing trade longer than they should, hoping the color will switch back to favorable.
- Solution: Use a stop-loss based on actual price action or integrate additional indicators to confirm reversal signs.
Not Adjusting to Market Conditions
- Mistake: Applying the same Heiken Ashi strategy in trending and ranging markets without adaptation.
- Solution: Recognize if the market is range-bound, and consider pivoting to a strategy more suitable for sideways movements or stand aside until a clear trend emerges.
Overcomplicating the Chart
- Mistake: Adding too many indicators alongside Heiken Ashi, leading to conflicting signals and confusion.
- Solution: Simplify. Stick to a couple of indicators that complement Heiken Ashi for confirmation.
Failing to Manage Risk
- Mistake: Placing wide stops or no stops at all because Heiken Ashi “seems” to show a strong trend.
- Solution: Always define your risk before entering a trade. Even the clearest Heiken Ashi trends can fail unexpectedly.
By being mindful of these mistakes, you ensure that you use Heiken Ashi in a disciplined, strategically sound manner.
- Read More About this Heiken Ashi Thunder Force MT4 Forex System FREE Download
Conclusion
Heiken Ashi is a valuable tool for Forex traders seeking clearer trends and fewer false signals. By smoothing out price noise, it helps you stay in trades longer and make more confident decisions. Just remember—it lags a bit, so pair it with good risk management and confirmation indicators.
Quick Takeaways:
- Clearer Trends: Filters out noise for easier trend spotting.
- Simple Signals: Consecutive same-color candles = momentum.
- Versatile Use: Works with various strategies and timeframes.
- Lag Aware: Use it alongside other tools to time entries/exits.
- Stay Disciplined: Don’t ignore price action or overcomplicate things.
Next Step: Test Heiken Ashi on a demo account and refine your strategy before going live. With practice, it can become a key part of your trading edge.