


Trading chart patterns is an essential skill for forex traders. Chart patterns are visual representations of price movements that help traders predict future price action based on historical data. Understanding and trading these patterns can significantly improve your trading strategy. Here’s a comprehensive guide on how to trade chart patterns in the forex market.
Understanding Chart Patterns
Chart patterns in forex are divided into two main categories: continuation patterns and reversal patterns.
Continuation Patterns
These patterns indicate that the current trend will likely continue once the pattern is complete. Common continuation patterns include:
Triangles:
There are many triangle patterns in trading, such as wedges, ascending triangles, and descending triangles. All of them show similar price action. For example, an ascending triangle has a top resistance and the price is squeezed by a rising support level. This means sellers are consistently selling at a certain price while buyers are becoming more aggressive, willing to buy at higher prices.
The same concept applies to other triangles: buyers and sellers compete. When the price breaks resistance, buyers win; if it breaks support, sellers win. By understanding the supply and demand in these patterns, you can predict price movements and trade more effectively.
Ascending Triangle:
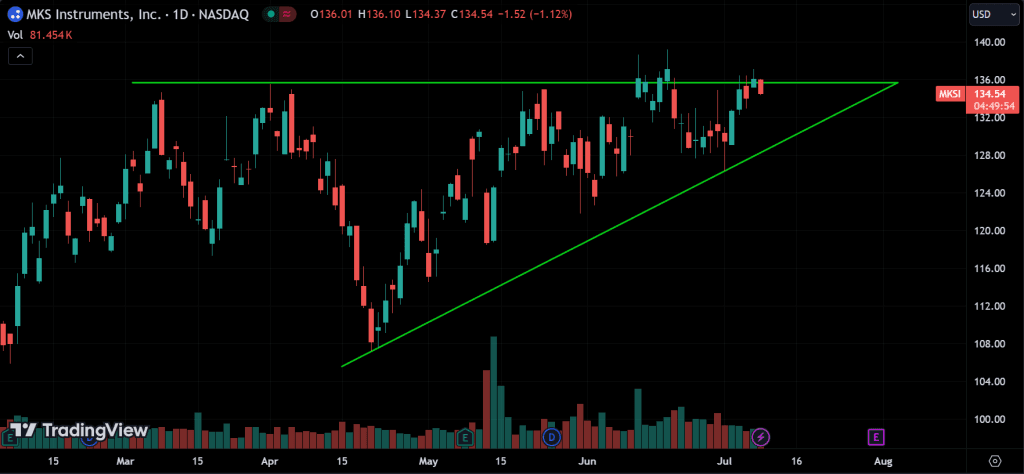
Characterized by a flat upper trendline and an ascending lower trendline. This pattern typically forms during an uptrend and signals a potential breakout to the upside.
Descending Triangle:
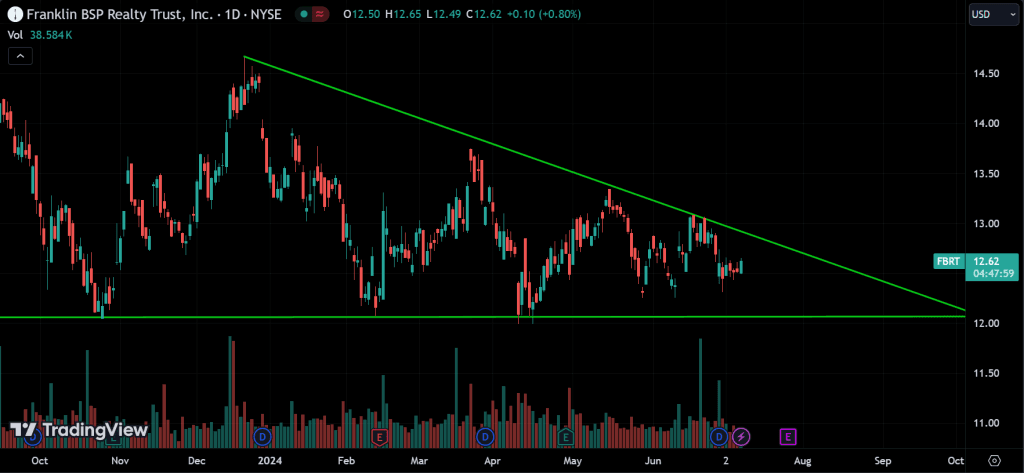
Features a flat lower trendline and a descending upper trendline. It usually forms during a downtrend and signals a potential breakout to the downside.
Symmetrical Triangle:
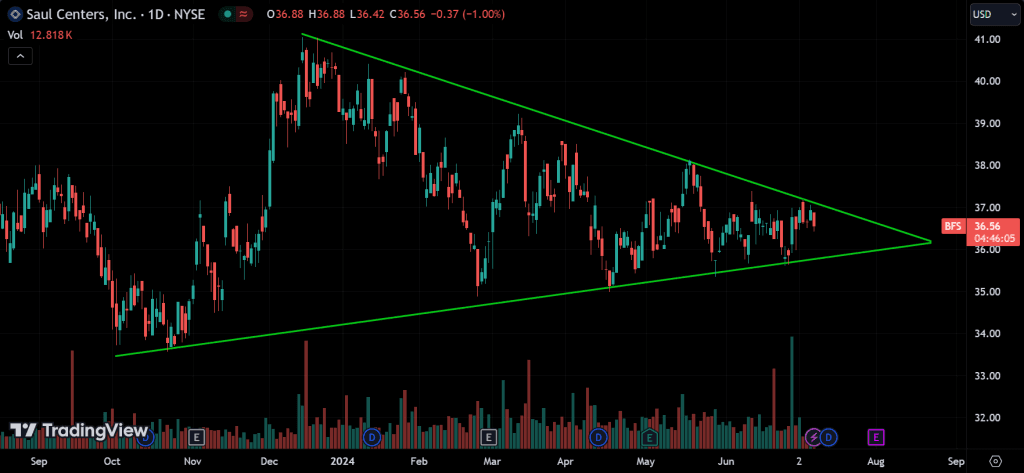
Formed by converging trendlines with similar slopes, indicating consolidation before a breakout. The direction of the breakout is usually in the direction of the prevailing trend.
Reversal Patterns
These patterns suggest that the current trend is about to reverse. Common reversal patterns include:
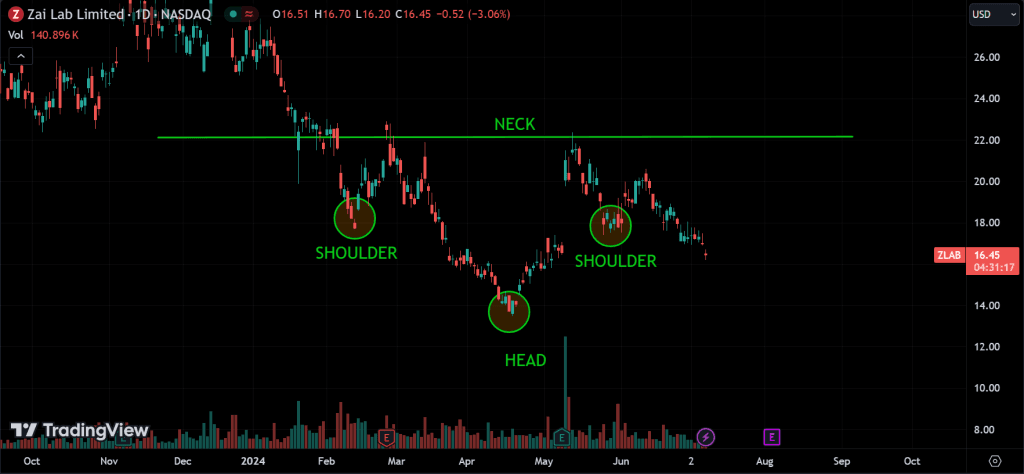
Head and Shoulders:
The price action of a head and shoulders pattern shows that buyers initially push the price up, but then sellers push it back down. Buyers make another attempt, pushing the price higher than before, but sellers again push it down. On the third attempt, buyers push the price up again, but sellers succeed in pushing it back down. This pattern indicates that sellers are stronger than buyers, meaning there is more supply than demand. When sellers finally push the price below a support level, it strongly indicates that sellers are in control, causing the price to fall.
The opposite is true for an inverse head and shoulders pattern. In this case, buyers are in control instead of sellers.
Head and Shoulders Top:
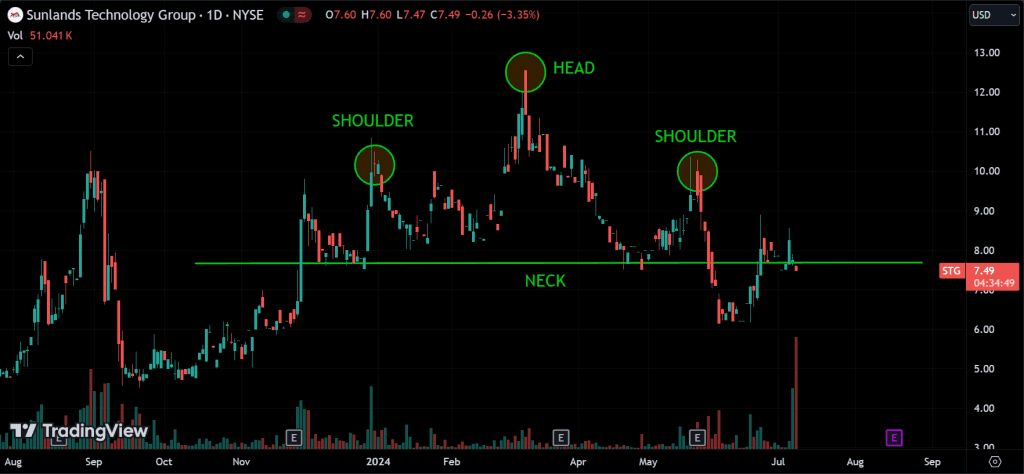
Indicates a reversal of an uptrend. It has three peaks: a higher middle peak (head) flanked by two lower peaks (shoulders). A break below the neckline confirms the pattern.
Inverse Head and Shoulders:
Indicates a reversal of a downtrend. It has three troughs: a lower middle trough (head) flanked by two higher troughs (shoulders). A break above the neckline confirms the pattern.
Double Tops and Bottoms:
In a double top pattern, buyers push the price up to a certain level, but sellers push it back down. Buyers try again, but sellers push the price down from the same high level. This shows there’s strong resistance at that price level, with more supply than demand, causing the price to fall. For a double bottom, it’s the opposite: instead of sellers, buyers are in control.
Double Top:
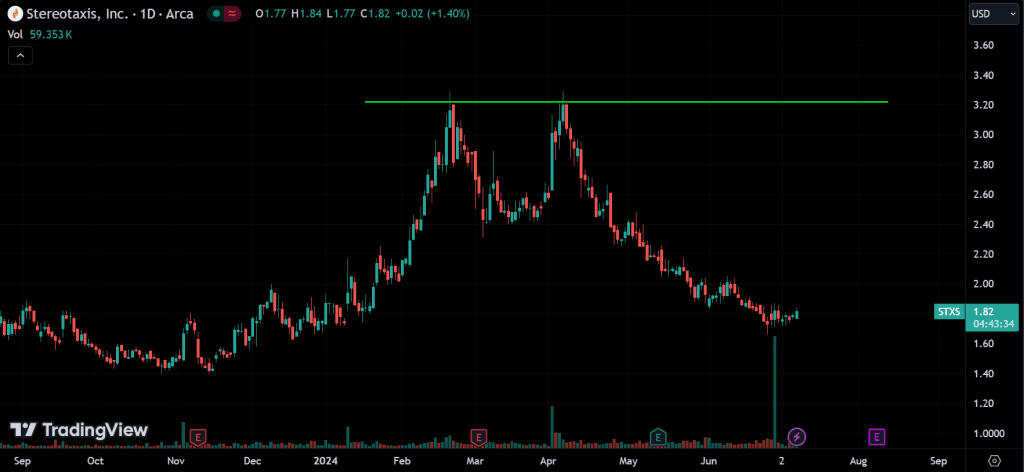
Forms after an uptrend and consists of two peaks at roughly the same level. A break below the intervening trough confirms the reversal.
Double Bottom:
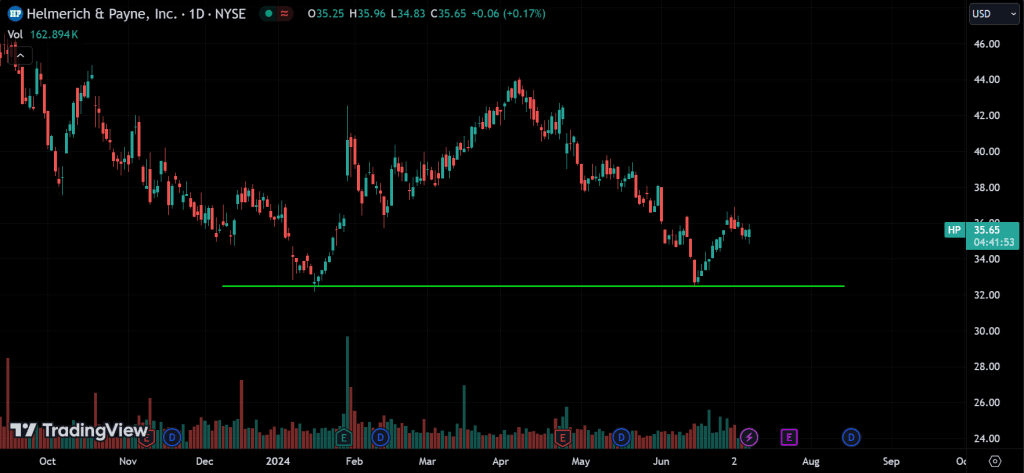
Forms after a downtrend and consists of two troughs at roughly the same level. A break above the intervening peak confirms the reversal.
Multiple Tops and Bottoms:
The price action of multiple tops is similar to a double top, but with more peaks. Buyers try to push the price above the same level several times and fail each time. This shows even stronger resistance or supply at that level. The more tops there are, the stronger the resistance becomes. For multiple bottoms, it’s the opposite: instead of resistance, there’s strong support from buyers.
Multiple Top:
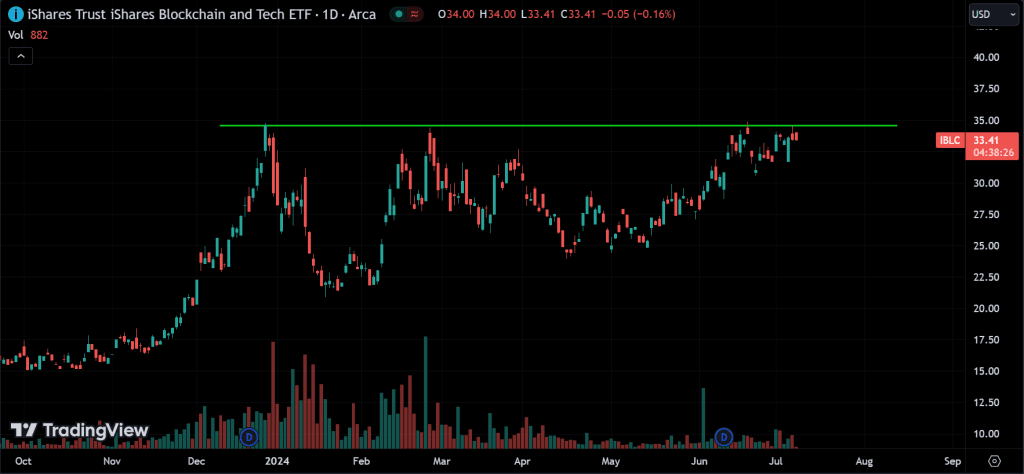
Similar to the double top but with three peaks or more, indicating a stronger reversal signal.
Multiple Bottom:
Similar to the double bottom but with three troughs or more, indicating a stronger reversal signal.
How to Trade Chart Patterns?
Step 1: Identify the Pattern
The first step in trading chart patterns is identifying them on your forex charts. Use a combination of trendlines, support and resistance levels, and technical indicators to help spot these patterns.
Step 2: Confirm the Pattern
Before making any trades, confirm the pattern. For continuation patterns, look for volume confirmation during the breakout. For reversal patterns, ensure the pattern has completed and the price has broken through key support or resistance levels.
Step 3: Determine Entry and Exit Points
Entry Points:
Enter the trade at the breakout point of the pattern. For continuation patterns, this is typically when the price breaks above the upper trendline for bullish patterns or below the lower trendline for bearish patterns. For reversal patterns, enter when the price breaks through the neckline or key support/resistance levels.
Exit Points:
Set profit targets based on the height of the pattern. For example, in a triangle pattern, measure the height of the base and project it from the breakout point to determine the profit target. Use stop-loss orders to limit losses if the trade moves against you.
Step 4: Manage Risk
Effective risk management is crucial in trading. Never risk more than a small percentage of your trading capital on a single trade. Use stop-loss orders to protect against significant losses and adjust your position size based on the volatility of the currency pair.
Step 5: Monitor and Adjust
Keep a close eye on your trades and be prepared to adjust your strategy as market conditions change. Patterns can evolve, and new information may require you to alter your entry or exit points.
Conclusion
You can learn and get familiar with price action trading by following our market analysis series. It’s difficult to cover every detail in one article, but with our weekly and daily analyses, you will become familiar with everything over time. I promise you that.
Trading chart patterns in forex requires practice and a keen eye for detail. By understanding continuation and reversal patterns, confirming them, and implementing a disciplined trading strategy, you can improve your chances of success in the forex market. Remember to always manage your risk and stay adaptable to changing market conditions. Happy trading!