
In the previous article, we talked about candlestick charts and learned that a candlestick chart gives us more details than a line chart, such as the high, low, open, and close prices of an asset during a specific period of time. In this article, we will discuss candlesticks in more detail, including what they mean and what they can tell us when they are put together as candlestick patterns.
Understanding Candlesticks
A candlestick chart is composed of multiple candlesticks, each representing a single time period (such as a day, an hour, or a minute). For example, if your chart time frame is 15M, then each candlestick represents 15 minutes.
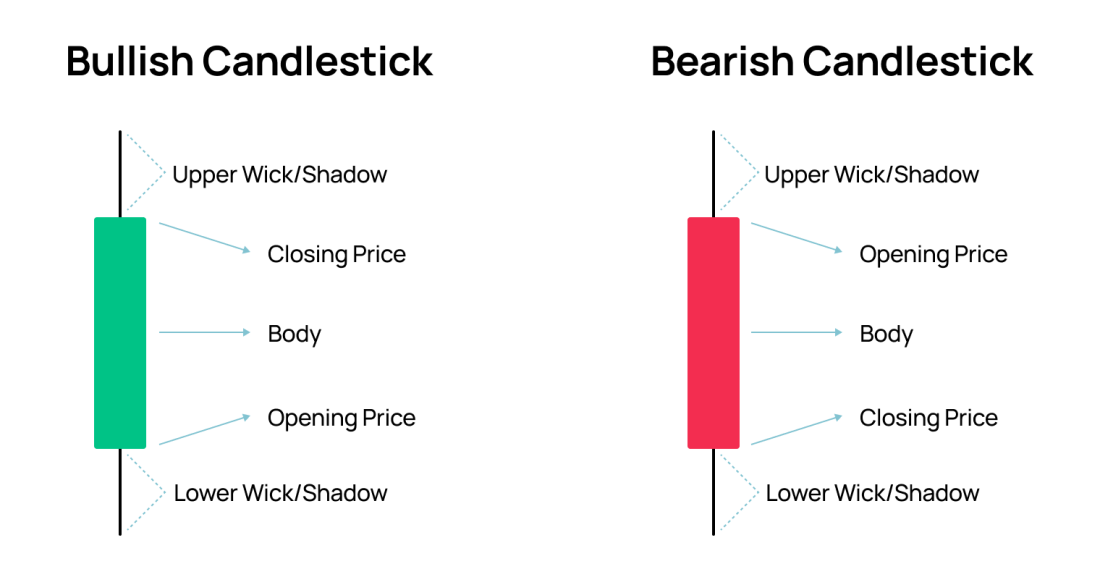
Each candlestick has four key components(OCHL):
- Open Price: The price at which the asset starts trading during the period.
- Close Price: The price at which the asset ends trading during the period.
- High Price: The highest price reached during the period.
- Low Price: The lowest price reached during the period.
The body of the candlestick represents the range between the open and close prices, while the wicks (or shadows) extend from the body to show the high and low prices. The color of the body indicates the direction of price movement: a filled or red candlestick means the close price is lower than the open price (a bearish candle), while a hollow or green candlestick means the close price is higher than the open price (a bullish candle).
Types of Candlestick Patterns
There are many types of candlestick patterns, but not all of them are useful. In trading, you want to focus on the most important patterns because those can potentially affect an asset’s supply and demand. If you are looking at a pattern that no one knows, it won’t work because you are the only one seeing it.
If your strategy tells you to take a position, candlestick patterns help you do so at the right time. The best way is to learn to interpret candlesticks rather than just studying their types. However, the easiest way to learn to interpret them is by understanding the types. A bit confusing, right? Hold tight with me until the end, and it will make sense.
Candlestick patterns can be classified into two main categories: single candlestick patterns and multiple candlestick patterns.
Single Candlestick Patterns
Doji:
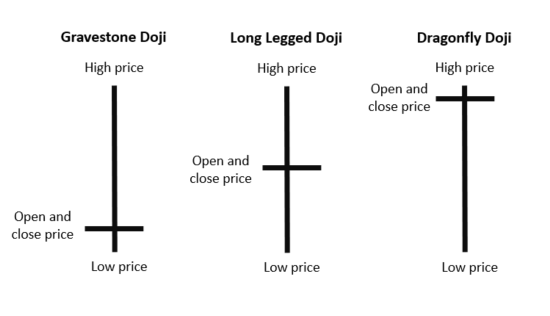
A Doji occurs when the open and close prices are very close or equal, resulting in a small or non-existent body. It indicates indecision in the market and can signal a potential reversal if found at the top or bottom of a trend.
Hammer and Hanging Man:
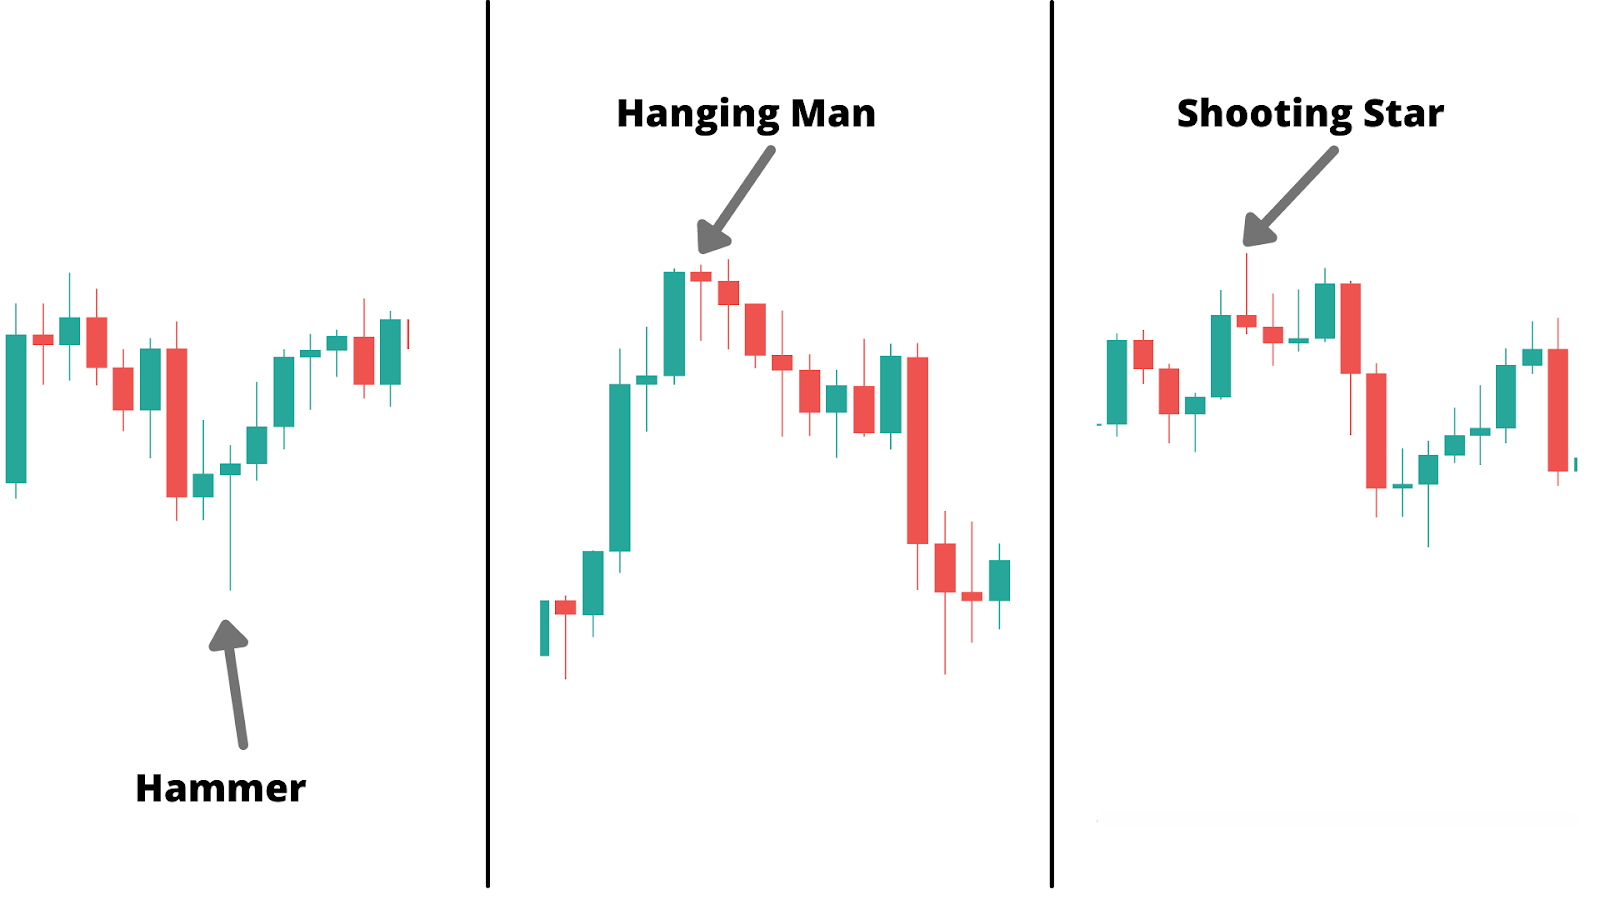
Both have small bodies and long lower wicks. A hammer appearing after a downtrend suggests a potential bullish reversal. A hanging man, appearing after an uptrend, suggests a potential bearish reversal.
Inverted Hammer and Shooting Star:
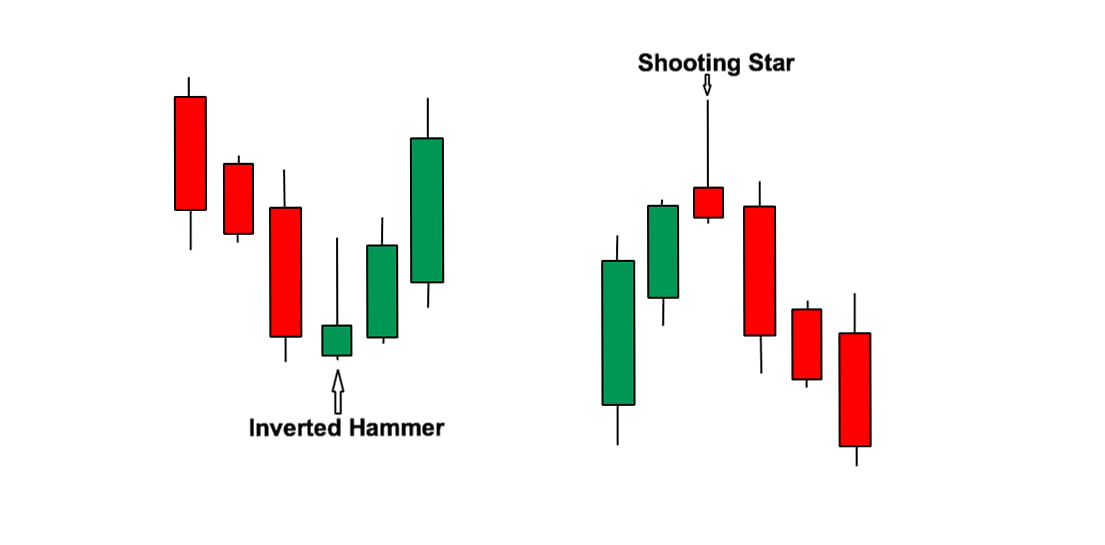
These have small bodies and long upper wicks. An inverted hammer, appearing after a downtrend, indicates a potential bullish reversal. A shooting star appearing after an uptrend suggests a potential bearish reversal.
You see, all of them are basically the same thing with different names. That’s why I don’t like to study the types. What they tell us is the supply and demand during that period of time.
For instance, consider this candle. At the beginning, the price starts. Sellers try to push the price down by selling, but they can’t push much because there aren’t many sellers left, and buyers are willing to buy more. Pushing the price back up to where it started. Eventually, it ends around that same range. This reflects the supply and demand of the buyers and sellers.
Similar dynamics apply to other candlestick patterns like the hammer, hanging man, or shooting star. It all boils down to supply and demand. By observing where the candle starts and where it moves during that time, we can tell who’s in control.
If it goes up, it suggests buyers were in charge for a while; if it goes down, sellers were dominating. If it closes lower than it opened, sellers win; if it closes higher, buyers win. However, if it moves up and down, ending around where it began, it signals indecision about the price direction. Usually, the candle following an indecisive one holds the most significance.
Multiple Candlestick Patterns
Engulfing Patterns:
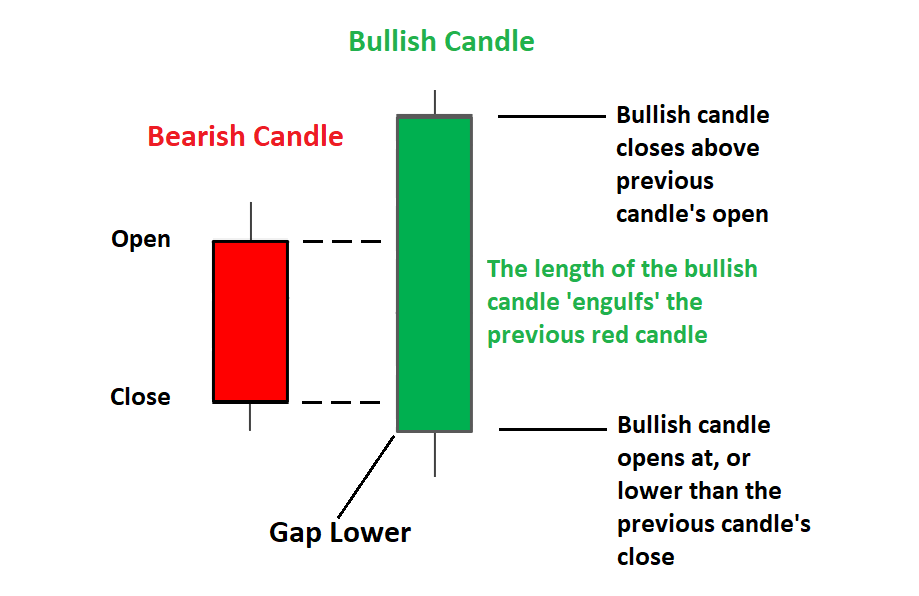
These consist of two candlesticks. A bullish engulfing pattern occurs when a small bearish candle is followed by a larger bullish candle that completely engulfs it, signaling a potential upward reversal. Conversely, a bearish engulfing pattern happens when a small bullish candle is followed by a larger bearish candle, indicating a potential downward reversal.
Once more, it’s all about supply and demand. A large green candle indicates that buyers were in control, with demand for the asset higher than its supply at that time.
Harami Patterns:
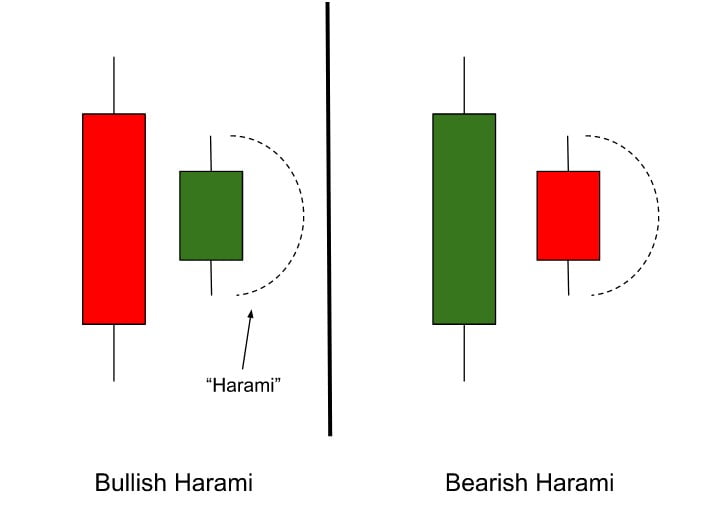
The harami pattern also consists of two candles. A bullish harami features a large bearish candle followed by a smaller bullish candle within its range, suggesting a potential bullish reversal. A bearish harami has a large bullish candle followed by a smaller bearish candle, indicating a possible bearish reversal.
Morning Star and Evening Star:
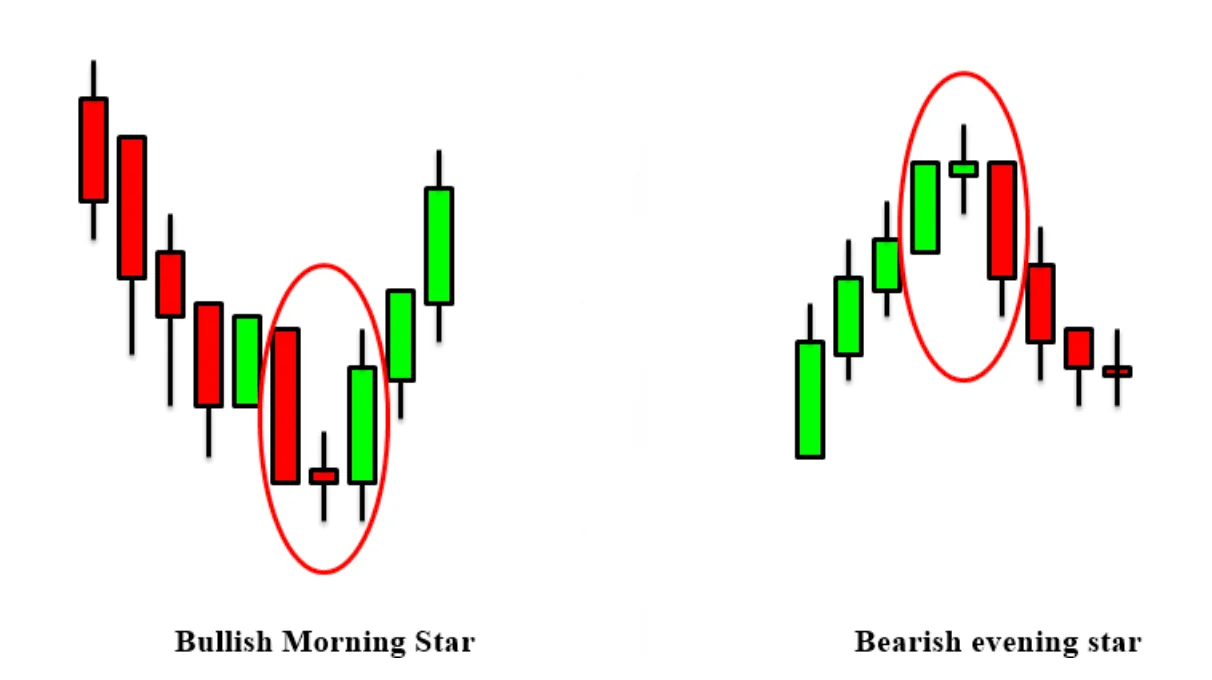
These are three-candle patterns. A morning star starts with a long bearish candle, followed by a small-bodied candle (indicating indecision), and then a long bullish candle, signaling a strong bullish reversal. An evening star is the opposite, beginning with a long bullish candle, followed by a small-bodied candle, and ending with a long bearish candle, indicating a strong bearish reversal.
Three Black Crows and Three White Soldiers:
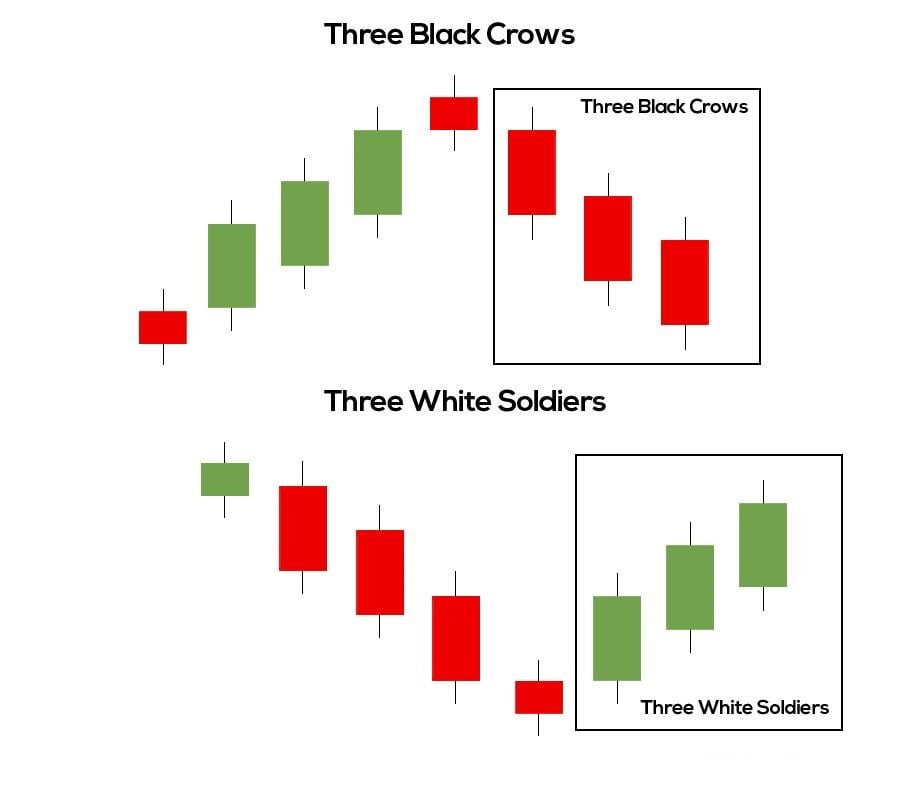
The three black crows pattern consists of three consecutive long bearish candles with short or no wicks, indicating strong bearish momentum. The three white soldiers pattern is the opposite, with three long bullish candles, signaling strong bullish momentum.
Tips for Using Candlestick Patterns
As mentioned earlier, basically all of them tell the same thing—supply and demand. If you can understand the supply and demand reflected on each candle, why bother memorizing these patterns and names? It’s useless. Try understanding the supply and demand and reading the chart instead of just finding patterns.
For example, in the “three black crows” and “three white soldiers” pattern, you can see three similar bullish or bearish candles in a row. This tells only one thing: for three consecutive times, only one party won, either buyers or sellers. So, for example, if it’s a “three black crow” pattern, it indicates that sellers are in control, so the asset is more likely to continue in that direction.
In my opinion, candlestick patterns serve only one purpose, and that is to time your position entries. If you want to buy something, candlestick patterns make it easy to buy at the right time.
Candlestick patterns are powerful tools for traders because they provide insights into market psychology and potential price movements. However, it’s important to consider the context in which these patterns appear.
- Trend Context: Always analyze patterns within the context of the existing trend. Patterns at the end of a long trend are more significant than those appearing in the middle of a range.
- Volume Confirmation: Higher trading volume during the formation of a candlestick pattern increases its reliability. Volume spikes often accompany significant price reversals or breakouts.
- Support and Resistance: Candlestick patterns occurring near key support or resistance levels are more likely to result in meaningful price movements.
- Multiple Time Frames: Analyzing patterns across different time frames can provide additional confirmation. For instance, a bullish pattern on a daily chart supported by a similar pattern on a weekly chart enhances the probability of a successful trade.
Conclusion
Candlestick patterns are a key part of technical analysis, giving traders helpful insights into market behavior and possible price changes. By understanding and correctly reading these patterns, traders can make better decisions and improve their chances of success in the financial markets. If your strategy tells you to take a position, candlestick patterns can help you do so at the right time. However, like any tool, candlestick patterns should be used along with other analysis methods and risk management strategies for the best results.