The Supply Demand Dashboard is a powerful trading tool based on the Supply and Demand Indicator. It is designed to work across multiple symbols and up to nine timeframes, offering traders an extensive market overview. With its advanced features and highly configurable settings, this dashboard enhances the trading experience by providing critical insights and alerts.
Key Features of the Supply Demand Dashboard
- Filtered Supply and Demand Values – Supply Demand dashboard shows filtered supply and demand values, including a zone strength rating. This feature helps traders identify the most significant zones with the highest probability of price movements.
- Pips Distances to and Within Zones – This provides the distance in pips to and within supply and demand zones. This information is crucial for planning entries and exits.
- Highlighted Nested Zone – The dashboard highlights nested zones, making it easier for traders to spot areas of confluence and potential reversal points.
- Zone Strength Rating – The dashboard includes a special zone strength rating, indicated by a yellow number if a minimum strength is reached.
- New or Tested Zones – An “N” is added to the price if the zone is still untested or new.
- Nested Zones – Background highlighting indicates if a zone is nested within a higher timeframe zone. Nested and new zones are displayed in bold.
- Multiple Alerts – The dashboard offers four types of alerts for chosen symbols across all nine timeframes:
- A new zone appeared.
- Price entered a zone.
- Price left the zone.
- The zone is broken.
Traders can filter these alerts for only nested zones, select specific timeframes to be alerted, and exclude symbols from alerts.
Supply and Demand Dashboard isn’t a standalone trading indicator System. Still, it can be very useful for your trading as an additional chart analysis, for finding trade exit positions (TP/SL), and more. While traders of all experience levels can use this system, practicing trading on an MT4 demo account can be beneficial until you become consistent and confident enough to go live. You can open a real or demo trading account with most Forex brokers.
This indicator works on all currency pairs and various other assets such as stocks, commodities, cryptocurrencies, precious metals, oil, and gas. It is compatible with all timeframes, making it a versatile tool for traders across different markets.
Use Any EA or Trading Robot | 35% Discount! |
Low Spreads | Free TradingView Premium* | |
Min Deposit of 50$ |
Download a Collection of Indicators, Courses, and EA for FREE
Visual Features on the Supply and Demand Dashboard
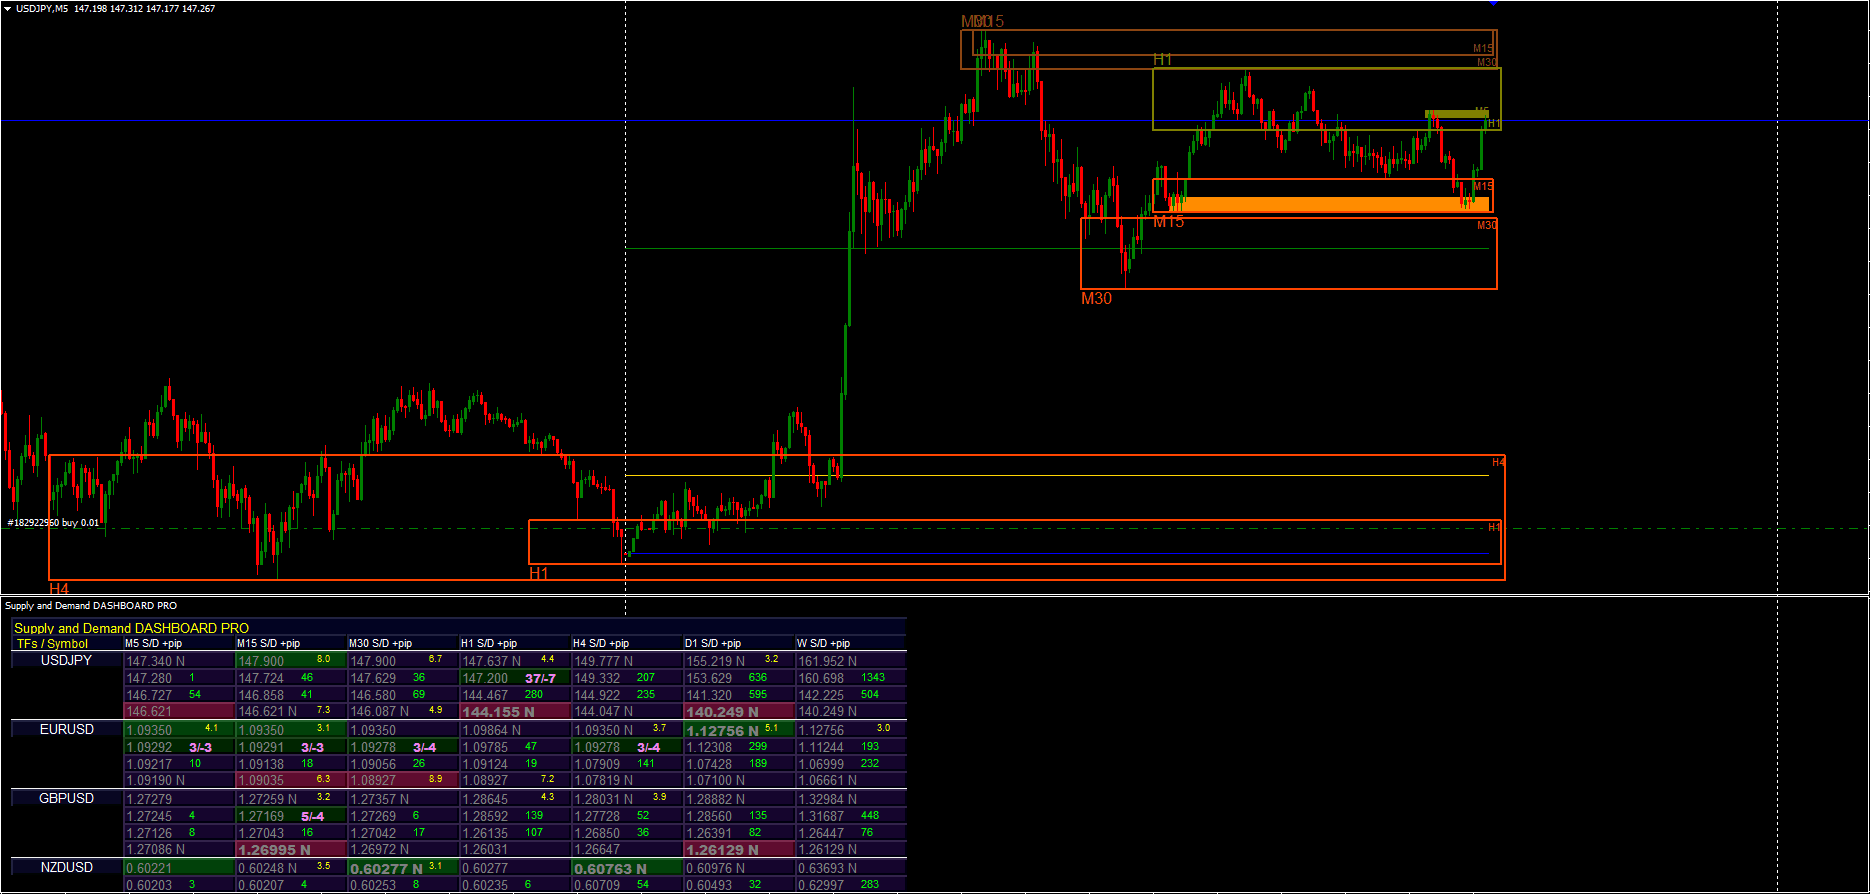
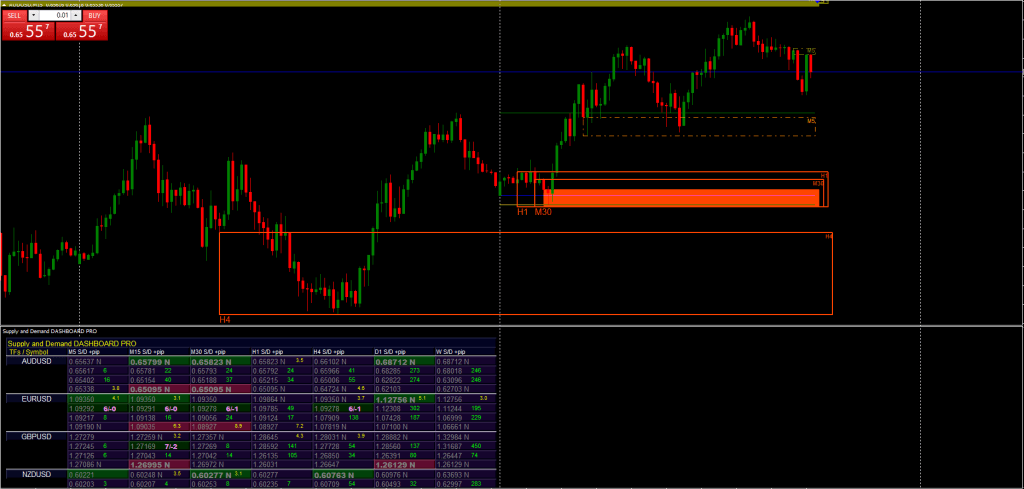
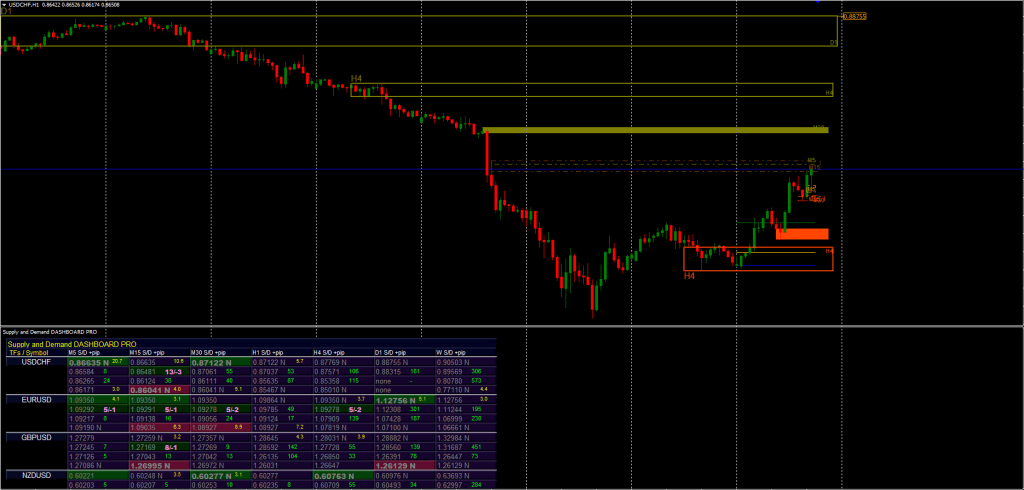
- Prices for Supply and Demand – Displayed from top to bottom (supply upper price, supply lower price, demand upper price, demand lower price).
- Pips Distances – Shown in green if the price is far from the zone, and in pink and bold if the price has entered the zone (pips to outer price, pips to inner price).
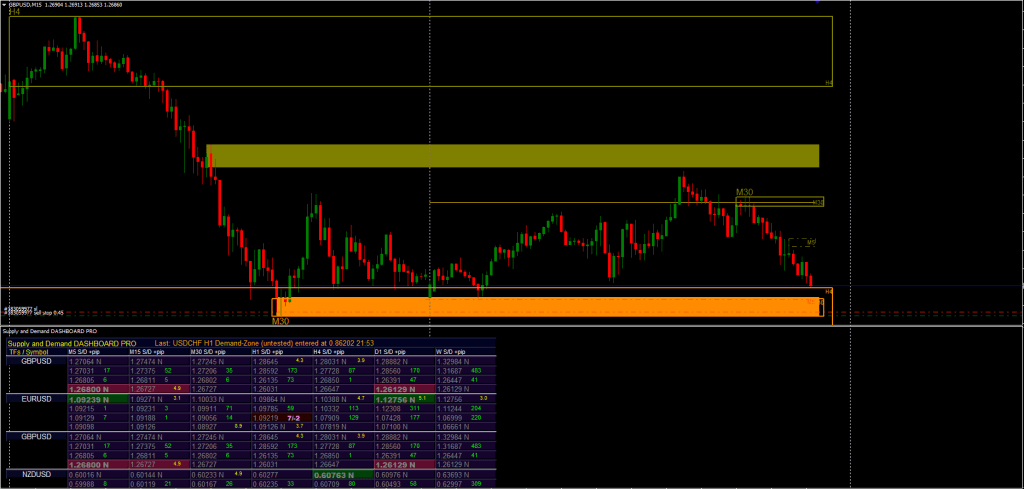
- Chart Integration – Drag the sub-window of the supply and demand dashboard down to see the actual chart. Click on symbol names to change the symbol. All timeframes shown in the dashboard are drawn on the chart. Lower timeframes appear as dashed squares, the actual timeframe as full squares, and higher timeframes as empty squares. The color code indicates if the zone is new or tested, and prices can be optionally displayed on the chart.
Benefits for Traders
- Optimal Entry Levels – For the best chance of success and favorable risk/reward ratios, enter trades within or near strong supply/demand zones.
- Strategic Stop Loss Placement – Place stop losses below or above strong supply/demand zones to maximize safety.
- Effective Profit Targets – Set profit targets using higher-timeframe supply and demand zones. For buy trades, target the next supply zone; for sell trades, target the next demand zone. This strategy ensures sufficient profit margins and increases overall profitability.
Conclusion
The Supply Demand Dashboard is a robust tool offering traders a comprehensive market overview. By leveraging its advanced features, traders can make more informed decisions, optimize their entry and exit points, and enhance their overall trading strategy. Highly configurable and versatile, this dashboard is essential to any trader’s toolkit.
I would love to test this indicator
How to work it
can you arrange the latest version of this indicator 2.8