

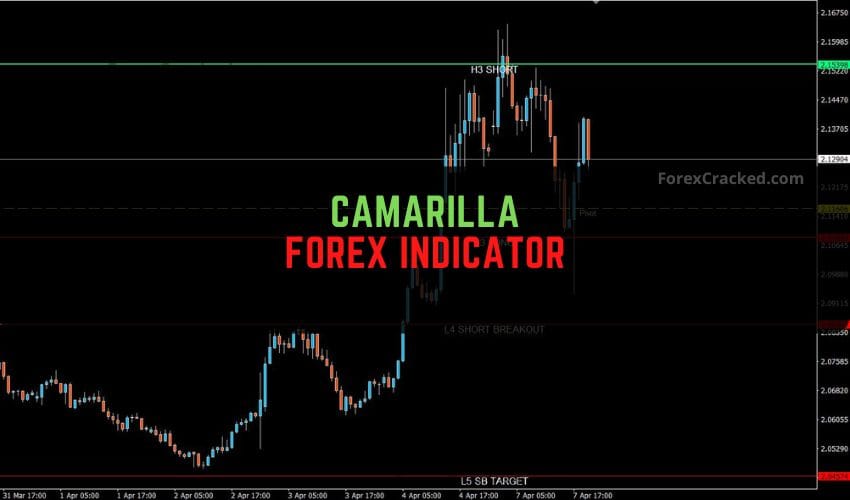
The Camarilla Forex Indicator for MT4 is a easy to use indicator that show you pivot points, entry, and exit levels. Whether you’re a new or a seasoned forex trader, this forex indicator will benifit you.
Why Use the Camarilla Forex Indicator?
Pivot points are a go-to for many traders because they help identify potential support and resistance levels. The Camarilla Forex Indicator steps it up by automatically plotting Camarilla pivot points, standard pivot points, and mid-pivot points directly on your MT4 chart. You also have the option to enable Fibo lines, which adds another layer of technical analysis.
The beauty of this Forex indicator is its ability to identify precise entry and exit points. It helps with range-bound trading and gives breakout traders a solid edge. Plus, because it calculates pivot values based on the previous day’s data, it works perfectly on all timeframes—whether you’re into scalping, day trading, or holding longer positions.
How Does the Camarilla Forex Indicator Work?
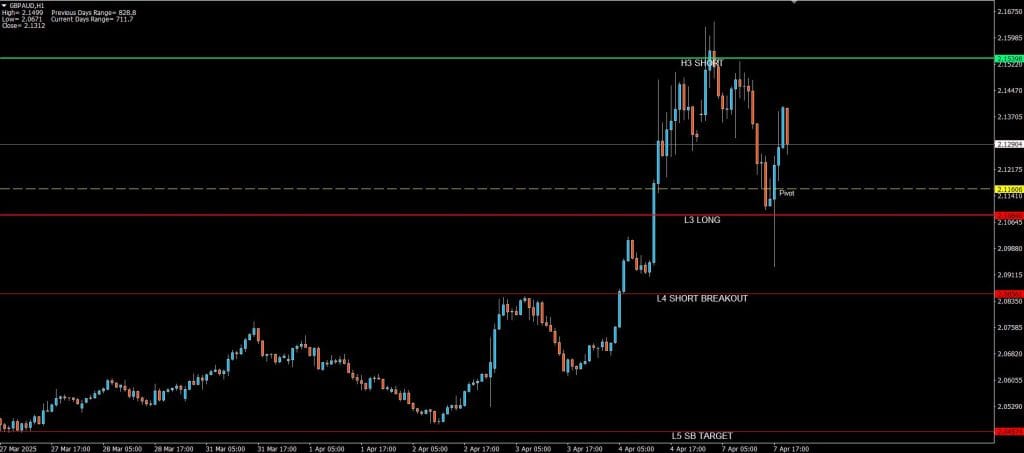
The indicator plots lines that act as support and resistance levels. Here’s the color breakdown:
- Green Lines: Indicate resistance levels.
- Red Lines: Show support levels.
- Buy Line: Marks the point where a long position is considered.
- Short Line: Marks the entry point for a short position.
- LONG BREAKOUT Line (LB): If the price breaks above this line, it signals a bullish trend continuation.
- SHORT BREAKOUT Line (SB): If the price breaks below this line, expect the bearish trend to continue.
- LB TARGET / SB TARGET: The expected target after a breakout.
This straightforward setup makes it easy to spot trading opportunities without cluttering your chart.
How to Trade Using the Camarilla Forex Indicator
Buying with the Camarilla Forex Indicator:
- Look for Price at the Buy Line: If the Price hits the BUY line, that’s your signal to go long.
- Stop-Loss Placement: Set your stop-loss below the nearest support line to protect your position.
- Target Setting: Aim for the next resistance level or the LB TARGET line if the Price breaks out.
- Breakout Confirmation: If the price moves above the LONG BREAKOUT line, it’s a sign that the bullish trend will likely continue.
Selling with the Camarilla Forex Indicator:
- Price Hits the Short Line: Consider entering a sell position if the price reaches the SHORT line.
- Stop-Loss Placement: Set your stop just above the closest resistance line.
- Take Profit: Target the next support level or the SB TARGET line if the trend continues downward.
- Bearish Continuation: A move below the SHORT BREAKOUT line suggests the downtrend is strong and might hit the SB TARGET.
Download a Collection of Indicators, Courses, and EA for FREE
Breakout Trading with the Camarilla Forex Indicator
Breakouts are where this indicator shines. If the Price breaks through either the LONG BREAKOUT or SHORT BREAKOUT line, it signals a potential continuation of the trend. You can enter a trade toward the breakout and target the corresponding LB TARGET or SB TARGET.
Example:
- Bullish Breakout: Price breaks above the LONG BREAKOUT line—place a buy order and set your take-profit at the LB TARGET.
- Bearish Breakout: Price breaks below the SHORT BREAKOUT line—enter a sell position and target the SB TARGET.
Always keep your stop-loss tight, ideally just inside the breakout line, in case of a false breakout.
Tips for Using the Camarilla Indicator Effectively
- Combine with Other Indicators: Use it alongside momentum indicators like RSI or MACD for better confirmation.
- Focus on High-Volume Sessions: The indicator tends to be more reliable during high-volume trading hours, like the London and New York sessions.
- Avoid Ranging Markets: Breakouts work best in trending environments, so watch out for consolidating markets where the indicator might give mixed signals.
- Backtest Before Trading: Test the indicator on historical data to see how it performs with your chosen currency pairs and timeframes.
Why the Camarilla Indicator is a Game-Changer:
What I love about the Camarilla Forex Indicator is how it takes complex pivot calculations and simplifies them into clear, actionable signals. You don’t have to be a math wizard to use it effectively. It’s particularly handy for those who like to keep our trading plans straightforward.
I’ve found that using it on the H1 or H4 charts gives me enough clarity while still allowing for flexible entry and exit. It’s a solid addition to any trading strategy, especially if you’re a support and resistance trading fan.
Free Download Camarilla Indicator
Read More Price Action Candlestick Patterns Indicator FREE Download
Final Thoughts:
The Camarilla Indicator for MT4 is an indispensable tool for pivot traders who need a no-fuss way to plot key levels. It’s great for beginners looking to understand the market structure and pros who need a quick way to spot breakouts and trend continuations.
If you’re looking to sharpen your trading game, try the Camarilla Indicator. Download it, load it on your MT4, and explore how it can help you find better entries and exits. Trust me, once you get the hang of it, you’ll wonder how you traded without it!