FX Profitude Forex Indicator is a NON-Repaint(arrows) easy-to-use buy/sell signal. This system is based on four different indicators. The Forex Profitude system is a trend-following system. The system itself is quick to learn and extremely easy to implement. Even if you are completely new to trading.
FX Profitude Trading System can give you trading signals you can take as they are or add your additional chart analysis to filter the signals further, which is recommended. While traders of all experience levels can use this system, it can be beneficial to practice trading on an MT4 demo account until you become consistent and confident enough to go live.
Indicators Used in the FX Profitude Indicator
The FX Profitude Indicator System uses four custom-made indicators:
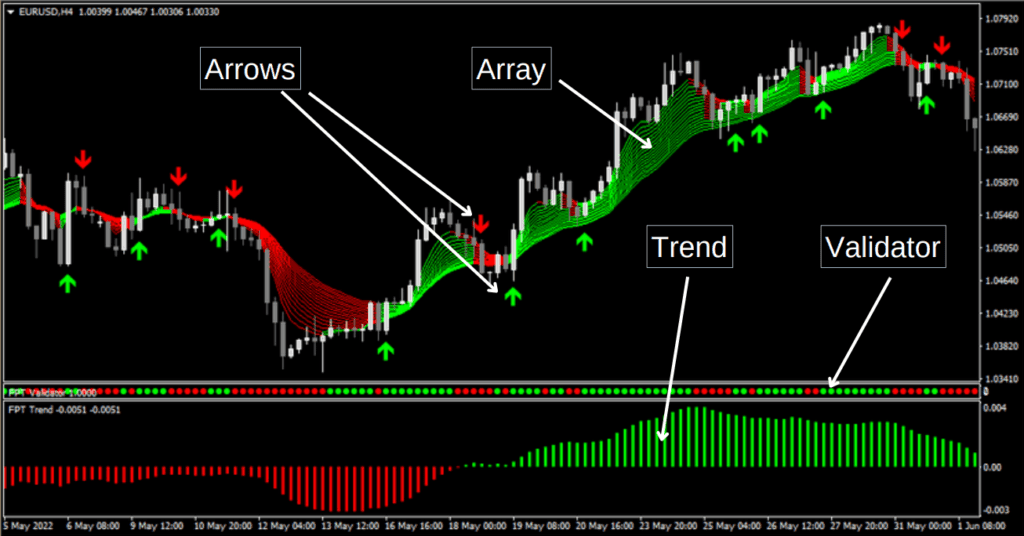
- The Array
- The Arrows
- The Validator
- The Trend
The Array
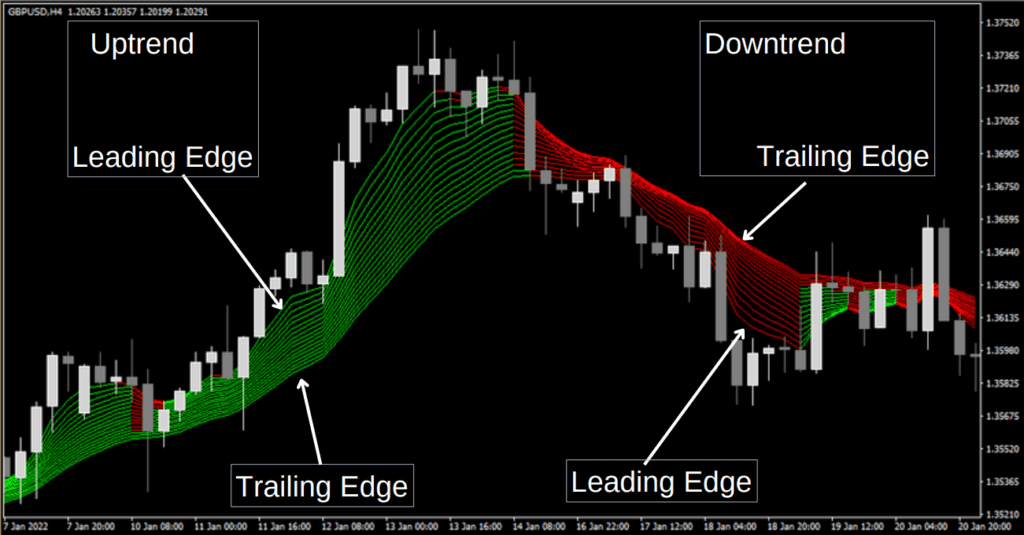
The Array is the main indicator of the FX Profitude System. The Array will give us a trend direction and signals to buy or sell.
The Array has two edges to it:
- The leading edge. This is the edge that is generally closest to the price.
- The trailing edge. This is the edge that is generally farthest from the price.
Uptrend:
The Array will be green in an uptrend, and the leading edge will be above the trailing edge. The price will pull into the Array, and several lines will turn red, but as long as the trailing edge is green and the leading edge is above the trailing edge, the trend is up.
Downtrend:
The Array will be red in a downtrend, and the leading edge will be below the trailing edge. The price will pull into the Array, and several lines will turn green, but as long as the trailing edge is red and the leading edge is below the trailing edge, the trend is down.
The Array Phases
The Array has 2 phases to it. When the colors of the array are all the same, we are in the first phase; then, when the colors of the array start to switch, we have a second phase.
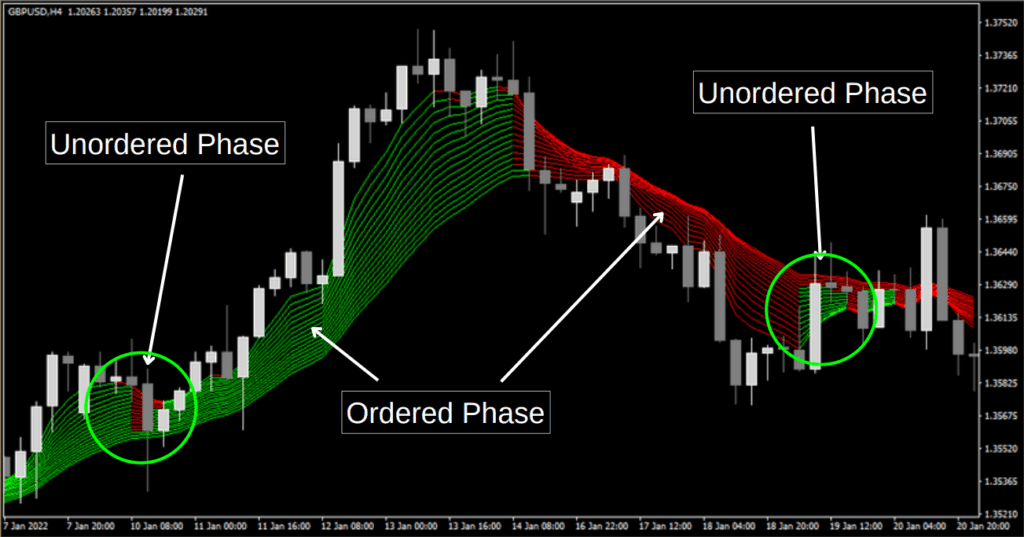
The Array has 2 phases to it:
- The Ordered Phase.
- The Unordered Phase.
Ordered Phase:
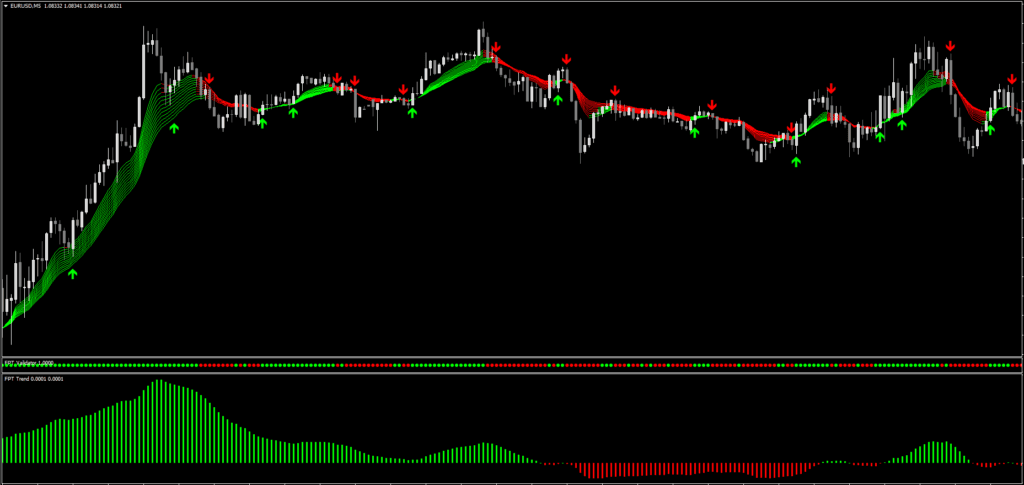
The ordered phase is when all the lines of the Array are the same color. We will have a green Array or an all-red Array. Although this is what we need to see when there is a signal, the Array can last in this ordered phase for more than just one candle.
Unordered Phase:
The unordered phase is when one or more lines in the Array are not the same color as the rest of the Array. We can have just one line with a different color, or we can have all but one line with a different color (and anything in between). This is important during the setup of the trades.
The Arrows
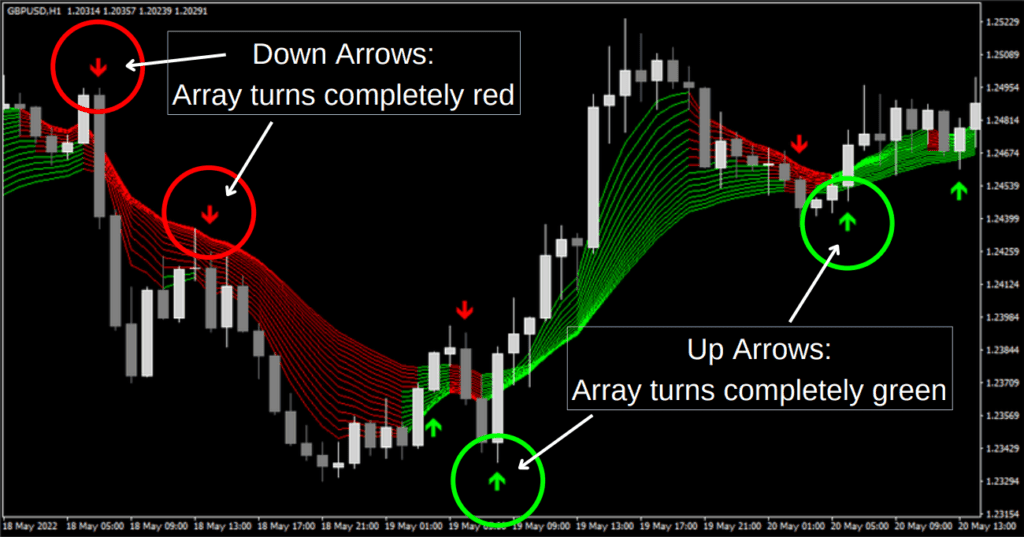
Technically, the Arrows are part of the Array, but they provide different information. They will be part of generating a signal, but that’s not what they are showing us.
Up Arrow (green and under the price):
When the entire Array turns green, we will get a green Arrow that appears under the price. This can happen as a result of a reversal or simply a pullback.
Down Arrow (red and above the price):
When the entire Array turns red, we will get a red arrow that appears above the price. This can happen as a result of a reversal or simply a pullback.
The Arrows will serve as an entry signal, provided the other indicators agree.
The Validator
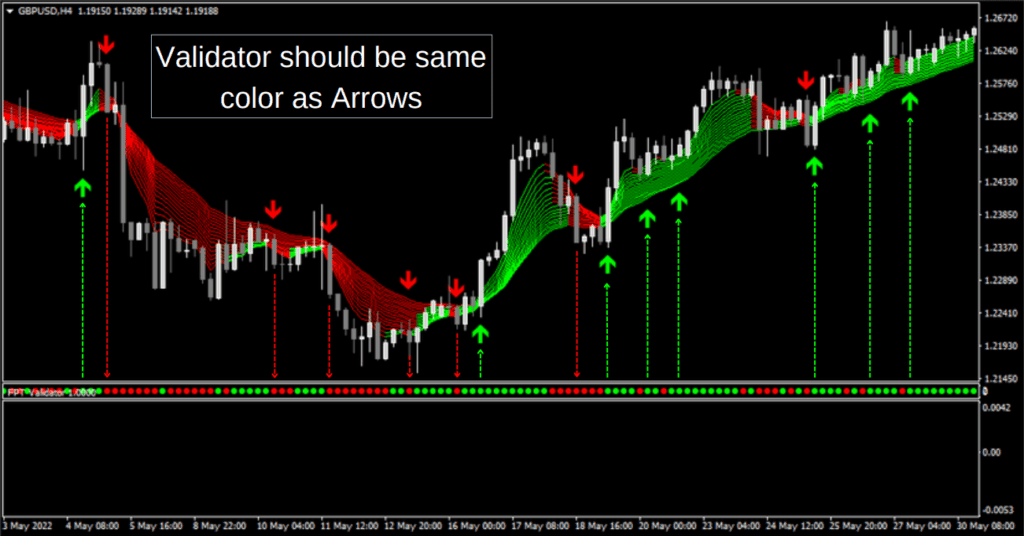
The Validator is a very short-term trend indicator. It gives us an alternative picture to the Array indicator. With the Validator, we can see precisely if the market is up or down candle by candle.
Bullish Trend:
When the green Arrow appears on the chart, the Validator should also be
green at the time of the signal.
Bearish Trend:
When the red arrow appears on the chart, the Validator should also be red at the time of the signal.
The Trend
The Trend indicator is how we know what direction to trade. This indicator will guide the way. The Trend indicator is the first indicator we should be looking at, as all the other indicators will need to be considered ONLY in the direction of the trend.
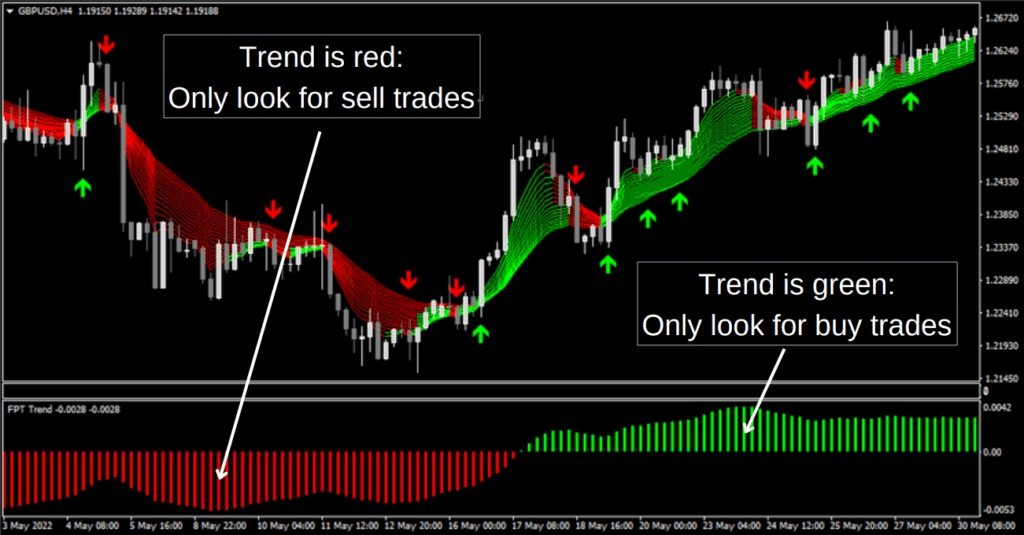
The Trend indicator is what we would consider a medium-term trend. and the best opportunities will come when we pair the Trend indicator with the Array indicator.
Bullish Trend:
When the Trend indicator is green, we will only look for buy trades.
The other indicators will only be recognized in that direction.
Bearish Trend:
When the Trend indicator is red, we will only look for sell trades.
We want to use this indicator hand-in-hand with the other indicators.
Download a Collection of Indicators, Courses, and EA for FREE
You can set the Forex Profitude Indicator for MT4 to send you a signal alert via Mobile Notification, E-mail, and platform pop-ups. This is helpful as it means you do not need to stare at the charts all day, waiting for signals to appear, and you can monitor multiple charts simultaneously.
This Profitude Indicator can be used on any Forex currency pair and other assets such as stocks, commodities, cryptos, precious metals, oil, gas, etc.
Trading rules for FXProfitude Indicator
As always, to achieve good results, remember about proper money management. To be a profitable trader, you must master discipline, emotions, and psychology. It is crucial to know when and when not to trade. Avoid trading during unfavorable times and market conditions like low volume/volatility conditions, beyond major sessions, exotic currency pairs, wider spread, etc.
Like most systems, Profitude will work on virtually every pair you are comfortable trading. You want to stick mainly to the higher timeframes like the 1-hour, 4-hour, and Daily if you don’t have a regular trading schedule. If you can spare a few hours to trade during the London session, you can trade this system on the lower timeframes like the 5-minute and the 15-minute. These are great timeframes for the scalping, but you want to trade these during the London session. Outside of the London session is when the market starts to wander, become directionless, and move very little.
Again, like with any system, red-flagged news events that have the potential to move the market should be taken into account before placing any trade. You can find the time and dates of these events on several online Forex calendars. Forex Factory has an excellent one that I personally use.
Buy Entry
- Identify an Uptrend
The Trend indicator will be green.
The Array indicator will turn all green.
The leading edge of the Array will be above the trailing edge. - Look for a pullback
The price drops below the leading edge of the Array, and the Array is no longer completely green. The leading edge (and possibly more lines of the Array) will turn red. - Signal
A candle will close above the Array, and the Array will turn all green.
A green Arrow will appear under the price / Array.
The Validator Dots will be green. - Entry
Entry will be at the close of the candle, which meets all the requirements.
Green Trend / Green Array / Green Arrow / Green Validator Dot. - Stop Loss
Place the stop loss just below the market’s most recent swing low. - Target
Target 1:1 (target is the same number of pips as the stop loss). - Trade management
Once a candle closes above the entry price (in profit), trail the stop loss along the trailing edge of the Array indicator. As each new candle closes, the stop loss will be placed below the tailing edge of the Array indicator of that candle.
Sell Entry
- Identify a Downtrend
The Trend indicator will be red.
The Array indicator will turn all red.
The leading edge of the Array will be below the trailing edge. - Look for a pullback
The price moves above the leading edge of the Array, and the Array is no longer completely red. The leading edge (and possibly more lines of the Array) will turn green. - Signal
A candle will close below the Array, and the Array will turn all red.
A red Arrow will appear above the price / Array.
The Validator Dots will be red. - Entry
Entry will be at the close of the candle, which meets all the requirements.
Red Trend / Red Array / Red Arrow / Red Validator Dot. - Stop Loss
Place the stop loss just above the market’s most recent swing high. - Target
Target 1:1 (same number of pips as the stop loss) - Trade management
Once a candle closes below the entry price (in profit), trail the stop loss along the trailing edge of the Array indicator. As each new candle closes, the stop loss will be placed above the tailing edge of the Array indicator of that candle.
- Read More High Gain Robot v3 For Free Download



Thank you so much admin for this indicator.
I don’t see where you can setup notifications
Many Many Many thanks Admin.
repaint