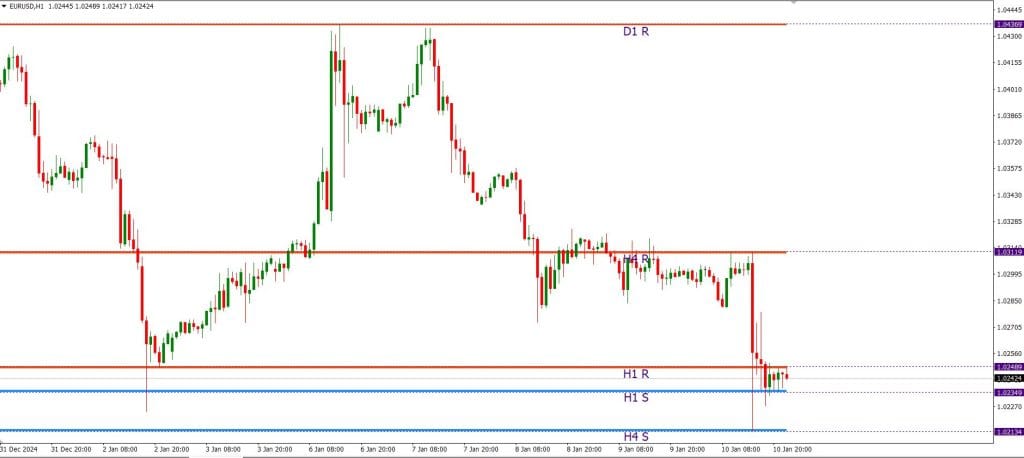
Navigating the forex market can feel like solving a giant puzzle. As a trader, you constantly search for key levels defining potential reversals or breakouts. Enter the Givonly SnR SnD R2 Indicator for MT4—a game-changing tool that automatically draws hourly, daily, and weekly support and resistance levels, saving you time and helping your trading strategy.
Why the Givonly SnR SnD R2 Indicator Stands Out
The Givonly SnR SnD R2 isn’t just another indicator. It blends Support and Resistance (SnR) with Supply and Demand (SnD) areas, showing you clear and actionable insights into Forex market behavior.

Here’s why this Forex indicator is a must-have:
- Automatic Drawing of Levels: The indicator identifies and shows support (blue) and resistance (red) lines across multiple timeframes.
- Higher Timeframe Context on Lower Charts: Whether you’re analyzing a 15-minute or 1-hour chart, you’ll have a clear view of support and resistance levels from daily, weekly, and even hourly charts.
- Supply and Demand Zones: It highlights these critical zones, often considered prime reversal points, helping you pinpoint high-reward, low-risk trade opportunities.
- Simplicity for Beginners: If you’re new to trading, this Forex indicator simplifies the process of identifying key levels, allowing you to focus on entering trades.
- Advanced Strategies for Pros: For Pro traders, this works as an important, combining with Fibonacci levels, breakouts, or divergence strategies to confirm market setups.
How to Trade with Givonly SnR SnD R2
BUY Setup
- Identify Support: Look for a blue support line on your chart. If it aligns with a supply zone or Fibonacci retracement, even better.
- Enter: Place a buy order as the price tests or bounces off the support level.
- Stop-Loss: Position your stop-loss just below the most recent swing low.
- Take-Profit: Aim for the next resistance level (red line) or set a custom risk-reward ratio (e.g., 1:2).
SELL Setup
- Spot Resistance: Watch for the red resistance line on your chart. If it overlaps with a demand zone or Fibonacci extension, it’s a stronger signal.
- Enter: Place a sell order when the price approaches or rejects the resistance level.
- Stop-Loss: Set your stop-loss just above the recent swing high.
- Take-Profit: Target the nearest support level (blue line).
Download a Collection of Indicators, Courses, and EA for FREE
Pro Tips for Maximizing the Givonly SnR SnD R2 Indicator
- Combine with Fibonacci Levels: Aligning Fibonacci retracements with plotted support/resistance strengthens trade setups.
- Monitor Confluence: When two-timeframe support or resistance levels coincide, they form stronger zones, boosting trade reliability.
- Pair with Indicators: Use the Givonly SnR SnD R2 alongside oscillators (RSI or MACD) to confirm overbought/oversold conditions near key levels.
- Breakout Opportunities: Look for price breaking through resistance or support and use the indicator to assess potential new levels.
Why Traders Love Givonly SnR SnD R2
This indicator works across all mt4 charts —forex, stocks, and crypto—and fits seamlessly into daily, weekly, or monthly trading setups. The automatic plotting of levels means less time fiddling with charts and more time focusing on executing profitable trades.
Free Download Givonly SnR SnD R2 Forex Indicator
Read More FXMAX Scalping Indicator FREE Download
Conclusion
The Givonly SnR SnD R2 Indicator for MT4 is a trader’s dream come true. By automating the tedious task of identifying support and resistance levels and highlighting supply and demand zones, this tool empowers traders to make smarter, quicker decisions. Whether you’re a beginner looking to simplify your strategy or a pro seeking precision, this indicator has you covered.
Download the Givonly SnR SnD R2 Indicator today and elevate your trading game. It’s free, easy to install, and packed with features designed to help you master the art of support and resistance trading.


