The Price Action Patterns Indicator is a trading tool designed for MetaTrader platforms. It automatically scans all currency pairs and time frames for candlestick patterns, aiming to simplify technical analysis for traders.
The indicator searches for over 30 different candlestick patterns. These include reversal patterns, continuation patterns, and those that often signal trend exhaustion. Examples include single-candle setups like the Hammer or Marubozu and more complex patterns like Morning Stars or Three Black Crows.
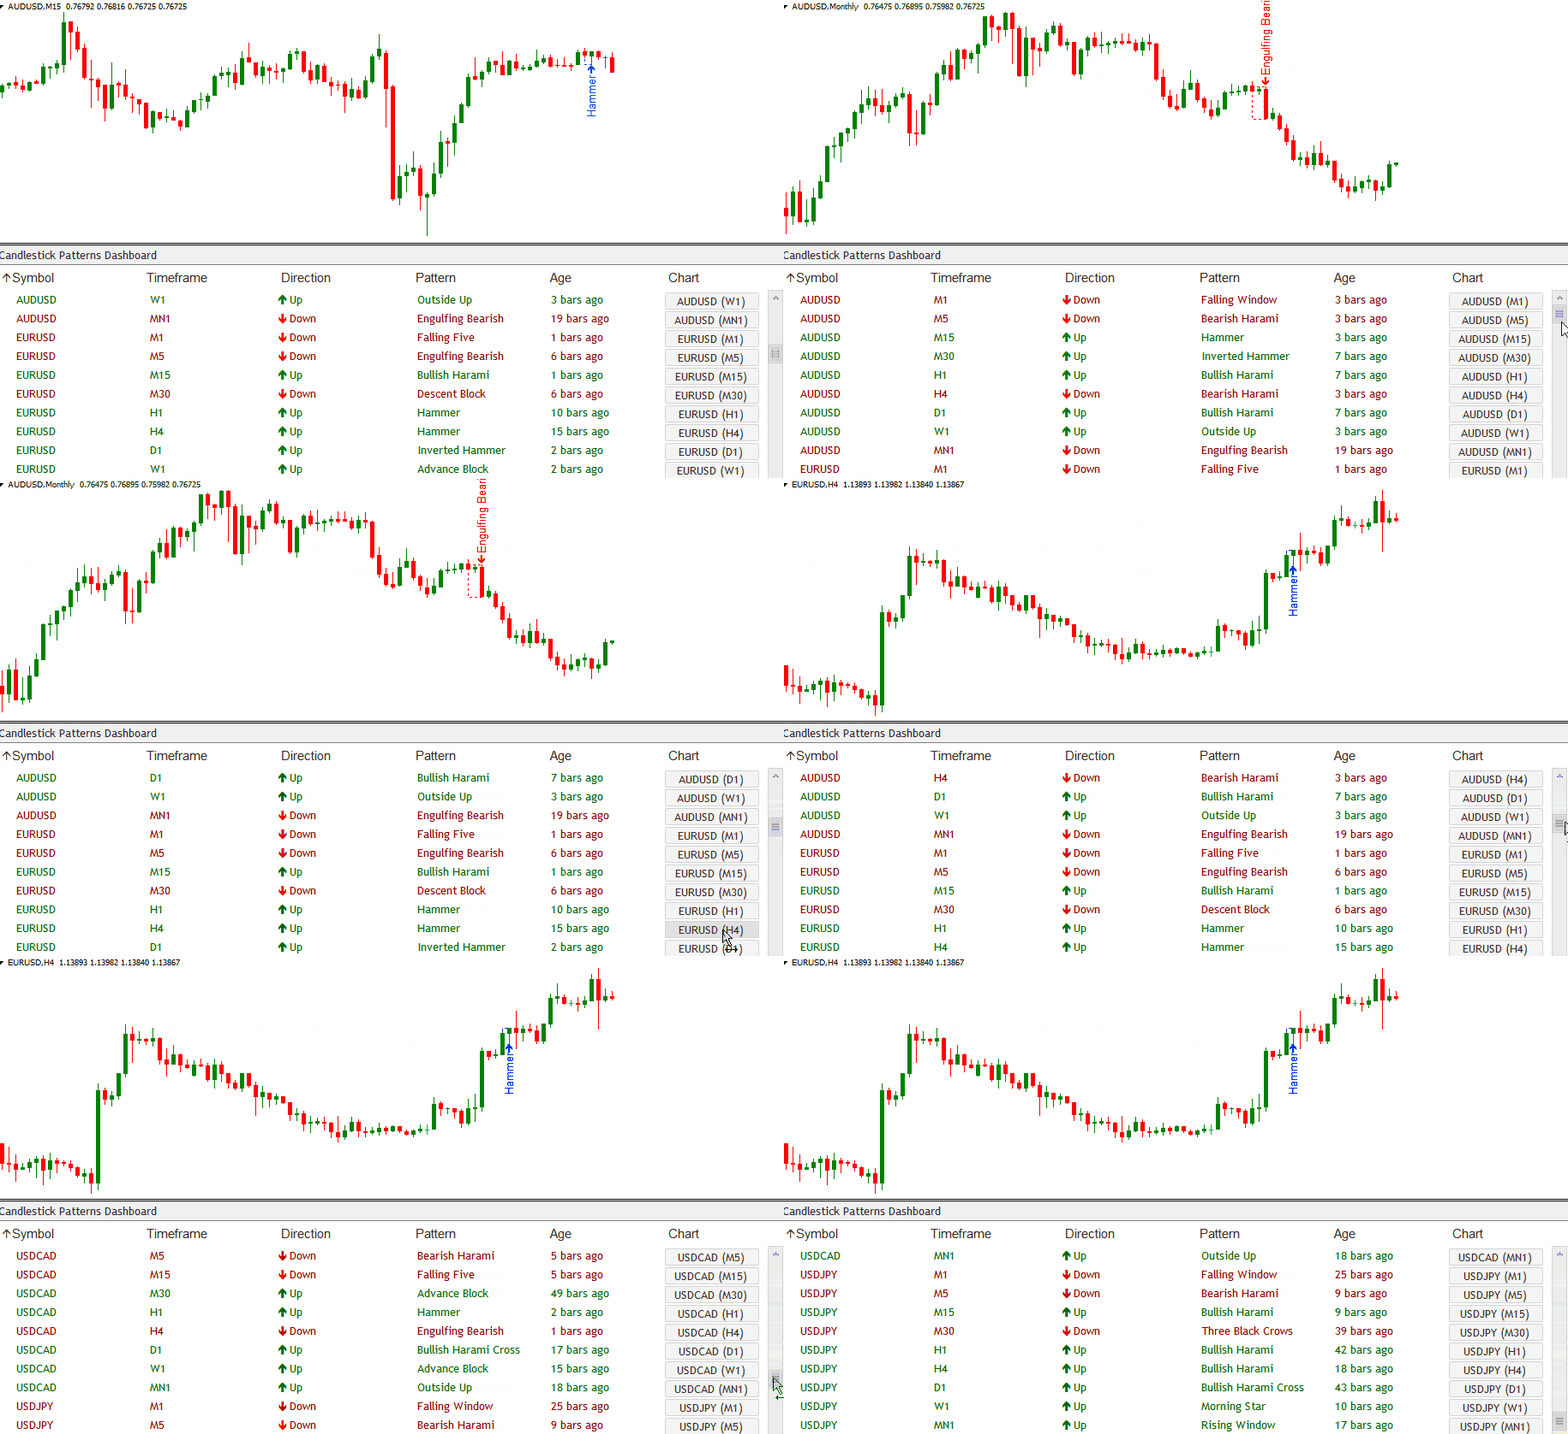
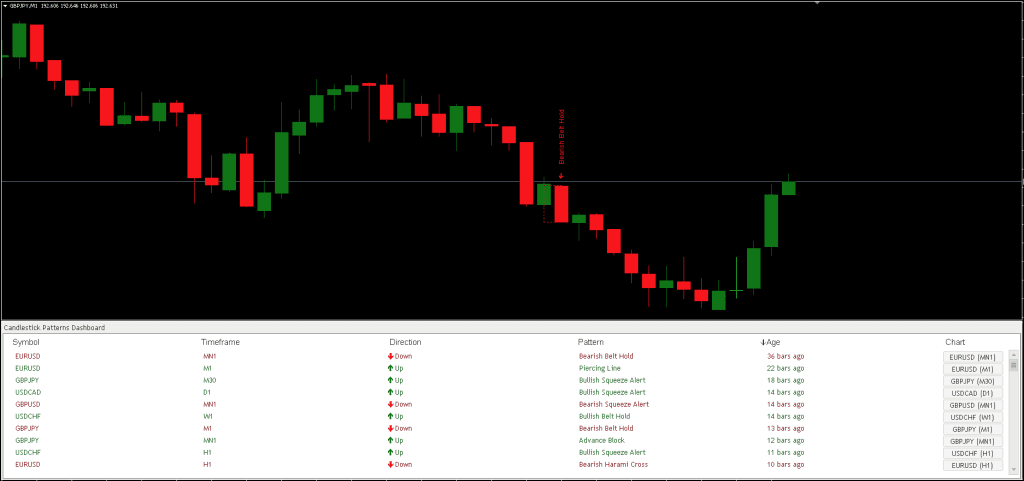
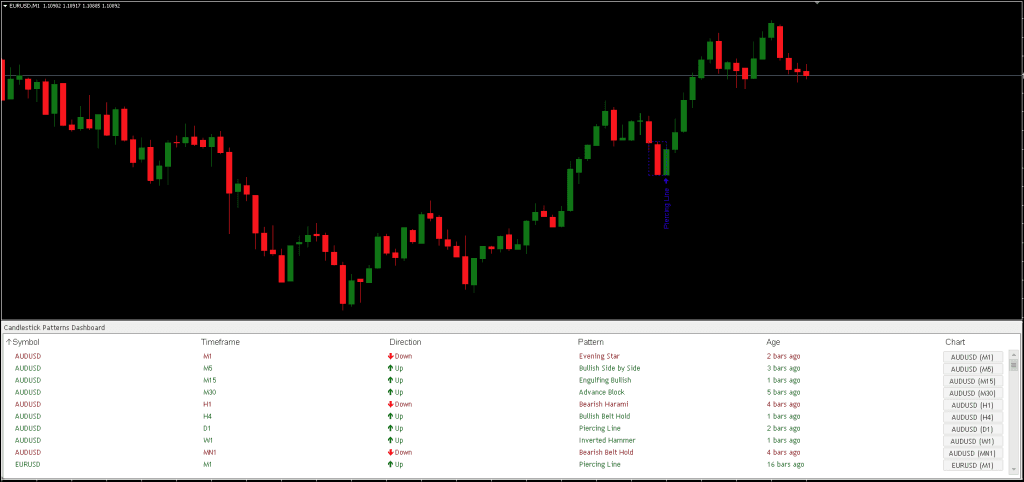
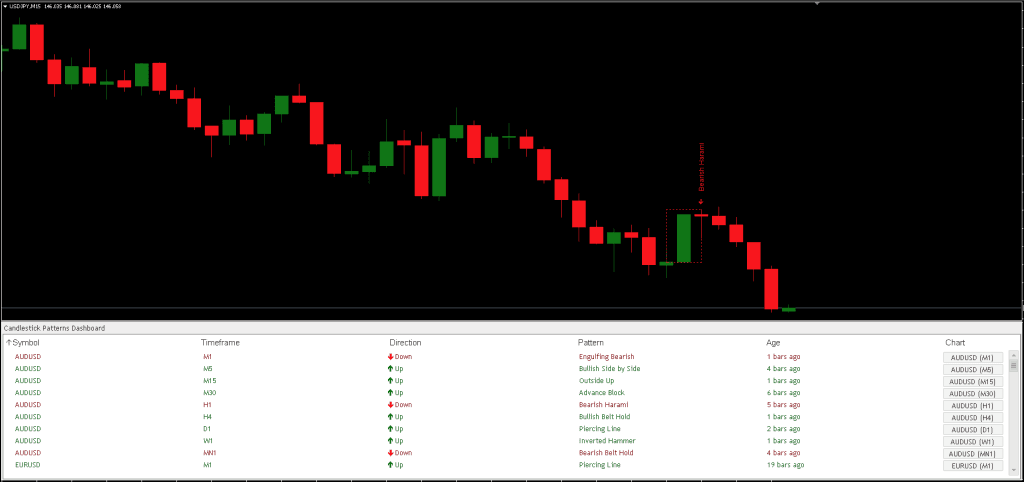
All detected patterns across all selected symbols and timeframes are displayed in one central location, a dashboard. Traders no longer need to check charts manually one by one. Instead, the dashboard provides a snapshot of where these patterns are appearing and their potential direction (bullish or bearish).
Price Action Patterns Indicator Features
The interface allows sorting by symbol, time-frame, direction, pattern, or how long ago the pattern appeared. Clicking a symbol on the Price Action Patterns dashboard will take the trader directly to that specific chart, where the pattern is highlighted.
Users can also choose which instruments and timeframes they want the indicator to scan. It doesn’t have to be limited to currency pairs; it also works on indices, metals like gold, futures, and even stocks depending on what the broker offers through MetaTrader.
The scanning process is performed quickly, and results appear almost immediately after the market data is processed.
This Candlestick Patterns Indicator isn’t a standalone trading indicator System. Still, it can be very useful for your trading as additional chart analysis, to find trade exit position(TP/SL), and more. While traders of all experience levels can use this system, practicing trading on an MT4 demo account can be beneficial until you become consistent and confident enough to go live. You can open a real or demo trading account with most Forex brokers.
The Price Action Patterns Indicator is straightforward. Even a complete beginner can start trading and making profits with this system. You can set it to send you a signal alert via mobile notification, platform pop-ups, and email. This is helpful because it means you do not need to stare at the charts all day, waiting for signals to appear, and you can monitor multiple charts simultaneously.
How the Dashboard Indicator Works
- Chart Navigation – By clicking a symbol on the dashboard, traders can open the respective chart where the detected pattern is highlighted, making analysis easier and quicker.
- Scanning for Patterns – The Dashboard Indicator continuously scans all selected currency pairs and timeframes for breakout patterns.
- Displaying the Dashboard – Once a pattern is detected, it is displayed along with key details on the dashboard.
- Sorting and Filtering Options – Traders can sort the detected patterns based on Symbol, Timeframe, Direction, Pattern Type, or Age.
- Read More – What are Candlestick Patterns?
Download a Collection of Indicators, Courses, and EA for FREE
Types of Candlestick Patterns It Recognizes
The Candlestick Patterns Dashboard indicator includes patterns classified by market researchers like Thomas Bulkowski in works such as The Encyclopedia of Candlestick Charts. Some of the more well-known patterns the Price Action Patterns Indicator can detect are:
- Reversal Patterns – Morning Star, Evening Star, Engulfing patterns, Harami, Piercing Line, Dark Cloud Cover, Three Black Crows, Three White Soldiers
- Continuation Patterns – Tasuki Gap, Rising Three, Falling Three
- Trend Exhaustion Patterns – Deliberation and Advance Block, Breakaway patterns
- Single Candle Patterns – Hammer, Shooting Star, Doji, Marubozu
- Others – Kicker pattern, Inside bars, Belt Hold, Fakey, Squeeze Alert
Each pattern is tagged with its direction (bullish or bearish) and how recently it occurred, which helps traders gauge its relevance in current market conditions.
- Read More – SWmax EA GOLD FREE Download
Conclusion
This Price Action Candlestick Patterns Dashboard Indicator automates a portion of technical analysis by identifying candlestick patterns across multiple assets and timeframes. It aims to give a clearer view of where these price action signals are happening without requiring traders to sift through each chart manually.
While the Price Action Patterns Dashboard can provide useful information and save time, trading decisions still depend on the trader’s overall strategy, risk management, and interpretation of what the patterns imply about market behavior. Like any tool, it can work as part of a broader trading approach.

