Renko Street Indicator is an indicator system that gives easy-to-use buy/sell signals on Renko charts. It is a trading system based on the Renko chart with the purpose of filtering all market noise (Manipulations and spikes).
About Renko
Renko charts are based on PRICE, not on TIME. Renko charts update dynamically tick by tick. Renko charting is considered to be best in predicting the change in the market sentiment that precedes a new trend. Trend reversals are signaled by the emergence of a different color candle. An easy system to follow is to trade in the direction of the trend, and exit when it reverses. Support and resistance levels are easily seen on Renko charts.
Renko Indicator charts smooth out market noise, clearly show the trend, and detect reversals. Renko charts are very effective for traders to identify key support and resistance levels. Buy/sell signals are generated when the direction of the trend & color of the candles changes. Actual volume values are displayed for each Renko candle.
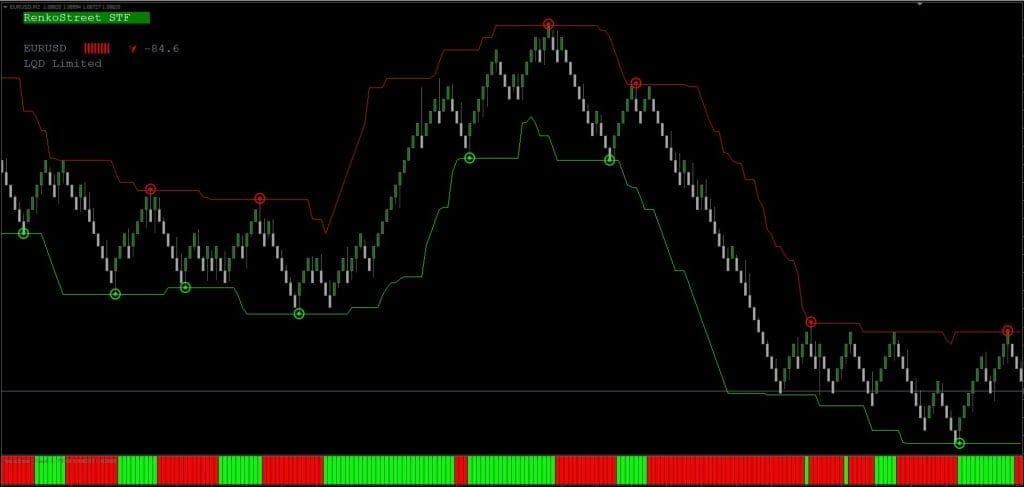
This Renko indicator system can give you trading signals you can take as they are or add your additional chart analysis to filter the signals further, which is recommended. While traders of all experience levels can use this system, it can be beneficial to practice trading on an MT4 demo account until you become consistent and confident enough to go live.
You can set the Renko Street Indicator to send you a signal alert via Mobile Notification, or platform pop-ups. This is helpful as it means you do not need to stare at the charts all day waiting for signals to appear, and you can monitor multiple charts all at once.
Download a Collection of Indicators, Courses, and EA for FREE
Renko Street Indicator can be used on any Forex currency pair and other assets such as stocks, commodities, cryptos, precious metals, oil, gas, etc.
How to Install (Important)
- Copy all the files to the according folders
- Restart your Metatrader 4
- Open your preferred Pair e.g: EURUSD, GBPUSD, etc, and select Time Frame M1. Zoom out to the smallest chart then press the HOME key on the keyboard several times. (We do this step to get history data a minimum of 1 to 2 months ago).
- Click Tools>Options
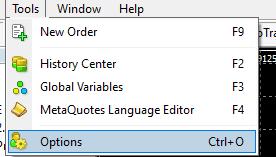
- Click on the Charts tab and check all boxes, Insert 9999999999999 to field Max bars in history and Max bars in the chart.
- Attach “RenkoStreet Chart Maker” EA to your chart. Default Settings or feel free to experiment.
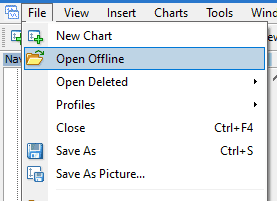
- Click Tab File ➔ Open offline
- If you previously Attach the EA to the EURUSD pair, you can find EURUSD M2 (if you can’t you may need to restart the MT4). Click Open it.
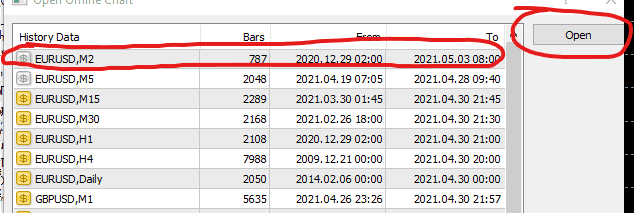
- In the last step attach one of the “RenkoStreetV2” templates to your new chart.
How to Use (Strategy)
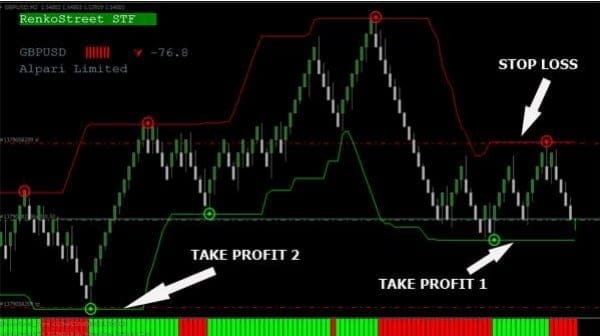
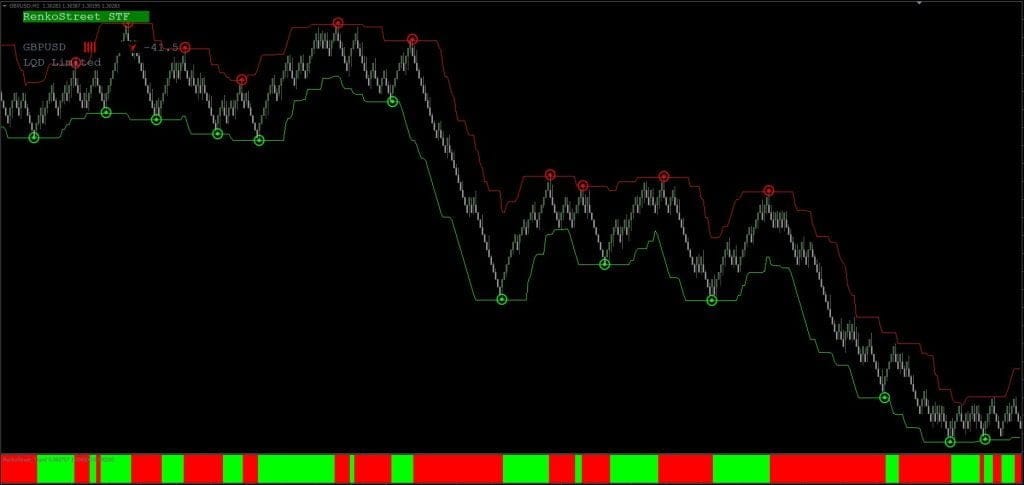
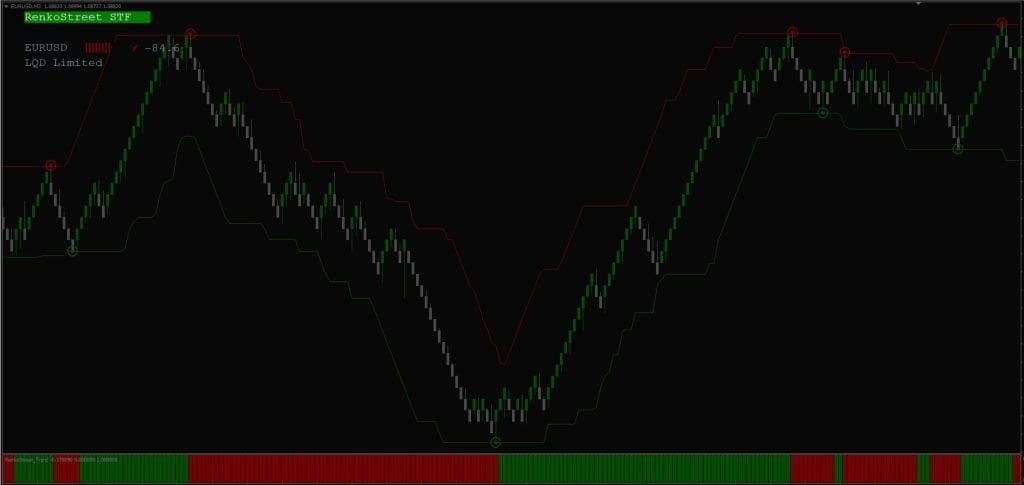
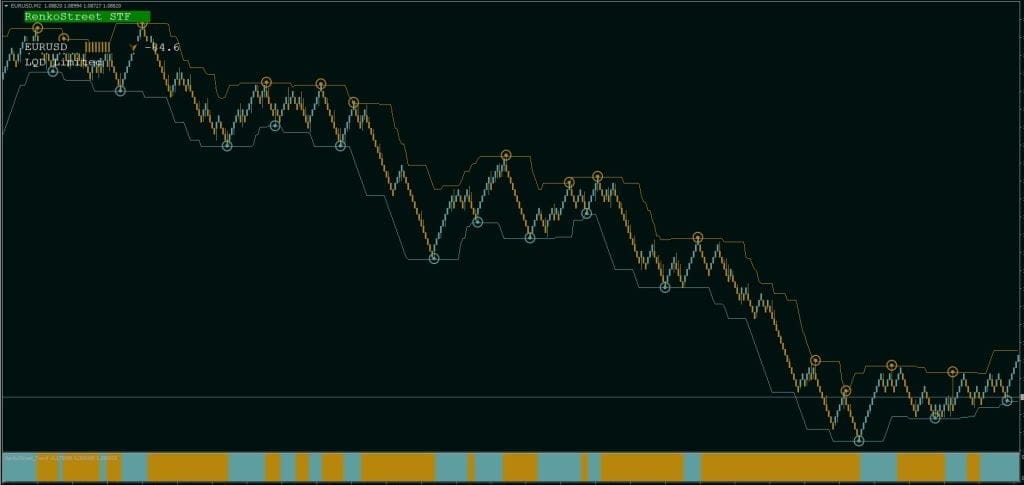
It draws lines and dot circles. In this indicator, you will see that dot circles do repaint. But don’t worry, we only need to enter a trade when 3 indicators have been confirmed with each other.
By this indicator, I usually define SL and TP. See horizontal lines: red and lime. I use the red line as a Resistant and Lime is Support.
In the case above you can also place Take Profit 2 at 10-15 pips above the horizontal line.
BUY
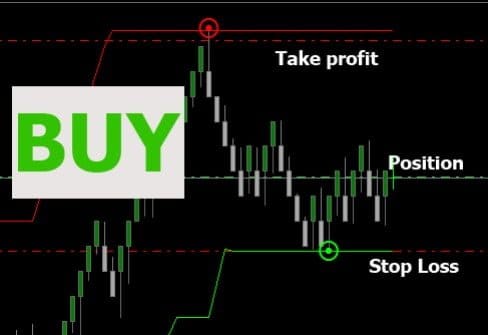
- Enter trade BUY when you get the alert “ BUY” and,
- RenkoStreet STF=Green
- RenkoStreet_Channel=Green
- RenkoStreet_Trend=Green
- Take profit on the horizontal line above your position. Or 10-15 pips before the horizontal line above your position.
- Stop Loss on the Horizontal Line below your posistion.
SELL
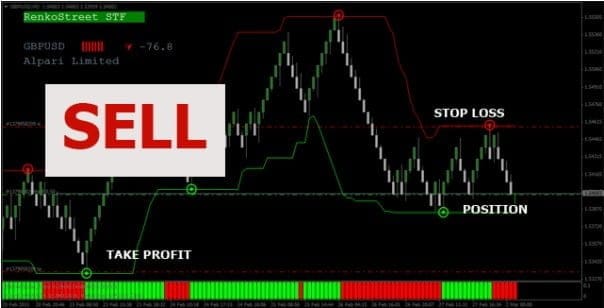
- Enter trade Sell when you get the alert “ SELL” and,
- RenkoStreet STF=Red
- RenkoStreet_Channel=Red
- RenkoStreet_Trend=Red
- Take Profit on the horizontal line below your position. Or 10-15 pips before the horizontal line below your position
- Stop loss on the horizontal line above your position




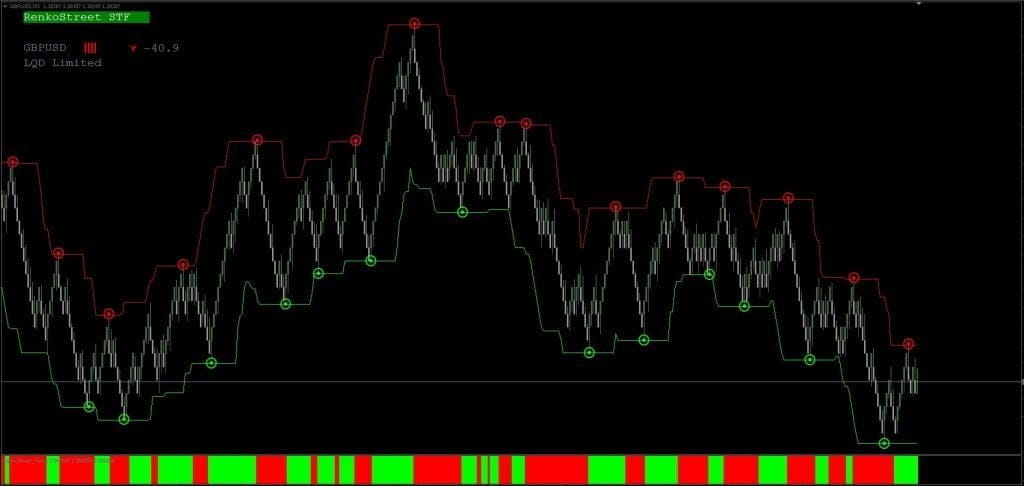
this is good, but the renko i replace it with heiken ashi 🙂
are you using it now? what about results ?
Hi, Is there a version available for metastock?
repaints
Try to analyze your parameters based on your strategy and normalize over trading and trade during session only….
Is it fine for you to post the mql4 file of the renko street channel indicator. I would love to try and figure out how to use them in a program. Thanks