The Squeeze Break Forex Indicator for MetaTrader 4 (MT4) and MetaTrader 5 (MT5) is a powerful technical tool designed to help traders capitalize on market trends by identifying key moments when volatility changes. The indicator is based on the strategy first introduced in John Carter’s book Mastering the Trade, which aims to trade based on a market’s changing volatility.
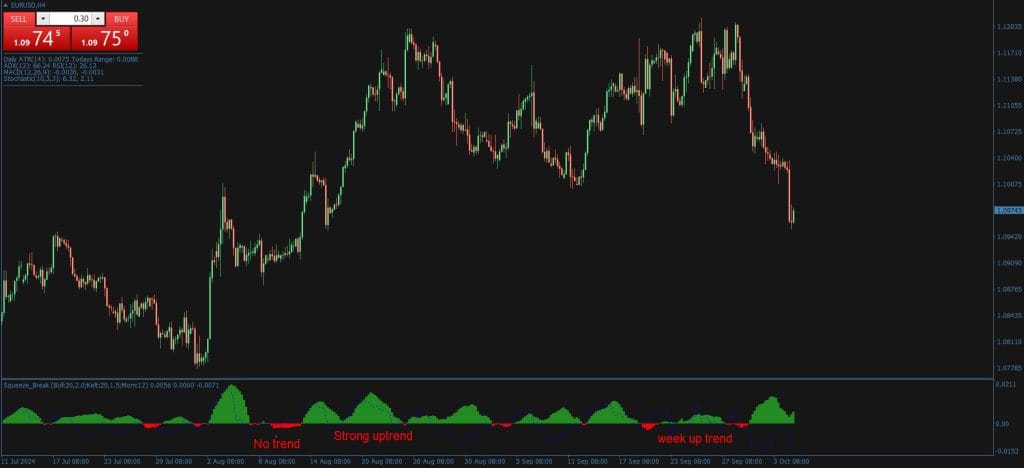
This indicator helps traders determine when a trend is starting, ending, or when the market is in a flat phase, giving you a reliable way to trade the beginning of bullish or bearish trends. The Squeeze Break Indicator displays this information using a red-green histogram and a blue oscillator line in a separate window below the price chart.

Key Features of the Squeeze Break Forex Indicator
- Histogram for Trend Detection: The histogram shows whether or not the market is in a trend.
- Green Histogram: Indicates the presence of a trend. The larger the bars, the stronger the trend.
- Red Histogram: Indicates a flat or non-trending market.
- Blue Oscillator Line for Trend Direction:
- If the blue line is above zero, the trend is bullish.
- If the blue line is below zero, the trend is bearish.
The histogram’s size and color help you determine the trend’s strength, while the blue line points out the direction.
How the Squeeze Break Forex Indicator is Calculated
To understand how the Squeeze Break Indicator works, it combines two technical indicators:
- Bollinger Bands (green lines on the price chart)
- Keltner Channel (red lines on the price chart)
The difference in sensitivity between the Bollinger Bands and Keltner Channel to changes in market volatility is the key to the Squeeze Break Indicator’s functionality.
- When Bollinger Bands are inside the Keltner Channels, the histogram shows red bars, signaling no trend.
- When Bollinger Bands expand outside the Keltner Channel, the histogram shows green bars, signaling the start of a trend.
The greater the distance between the Bollinger Bands and Keltner Channel, the larger the histogram bars. The trend direction blue line is based on the Momentum indicator, a classic technical analysis tool.
How to Trade with the Squeeze Break Forex Indicator

Buy Signals:
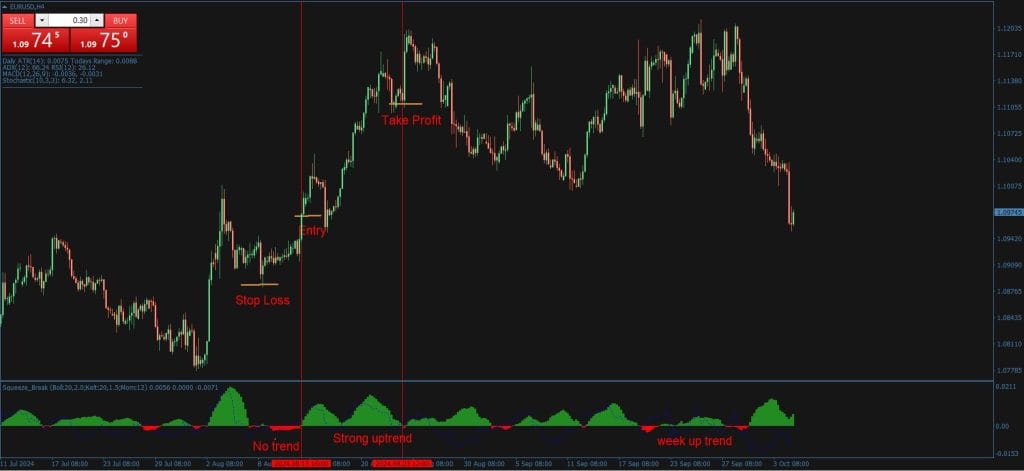
- When the histogram turns green, and the blue line is above zero and pointing upwards, this is a buy signal.
- Traders can hold the buy position if the blue line remains above zero and the histogram stays green.
- Sometimes, you might exit early when the histogram and blue line peak, ensuring you lock in profits before momentum fades.
Sell Signals:
- When the histogram remains green, and the blue line is below zero, this is a sell signal.
- Traders should maintain their sell position while the blue line remains below zero and the histogram stays green.
- Closing the position as signs of a weakening trend emerge is also a valid approach to protect profits.
Customization and Notifications
The Squeeze Break Forex Indicator offers several customization features:
- Change the settings of the Bollinger Bands, Keltner Channel, and Momentum to fine-tune your strategy.
- Customize additional information displayed on the indicator window.
- Set up alerts and notifications to get signals in real time.
Free Download Squeeze Break Forex Indicator MT4/MT5
Read More LOTO USDJPY Forex Robot EA FREE Download
Conclusion
The Squeeze Break Forex Indicator for MetaTrader is an excellent tool for traders seeking to capitalize on market trends. It signals when a trend is starting, its direction (bullish or bearish), and when it might weaken. While the indicator sometimes lags and may send false signals, combining it with other technical analysis tools like support and resistance levels or confirming signals on daily and intraday charts can greatly improve its accuracy.
You can download the Squeeze Break Forex Indicator for free and integrate it into your trading strategy to identify profitable trends today!


