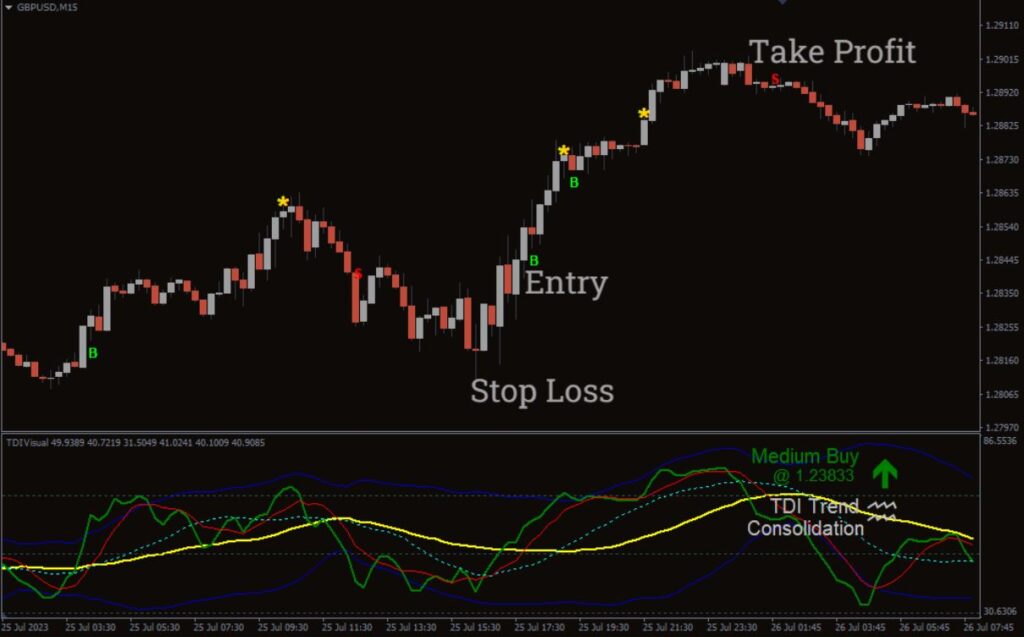
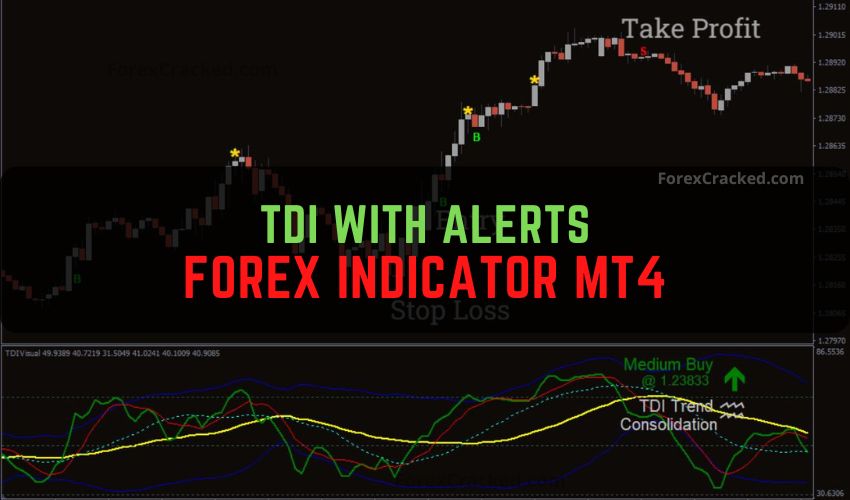
In forex trading, having the right tools can make all the difference in seizing profitable opportunities. One such powerful tool is the TDI With Alerts Forex Indicator for MT4. Built on the foundation of the RSI indicator, Bollinger bands, and moving averages, this indicator offers traders a comprehensive view of market trends and intensity fluctuations, making it an invaluable asset in their trading arsenal.
Understanding the TDI With Alerts Indicator:
At its core, the TDI (Traders Dynamic Index) With Alerts indicator merges the fundamental RSI indicator with Bollinger bands and moving averages. This integrated approach transforms it into a complete trading system. The indicator is designed to help traders pinpoint the ideal entry points by simultaneously displaying the direction and pace of the current trend.
Components of the TDI With Alerts Indicator:
- Green Line (RSI):
- The green line, akin to the RSI in color, mirrors the market sentiment. It illustrates how the market reacts to both optimistic and pessimistic expectations.
- Red Line (Crossing Indicator):
- The red line intersects with the green line at its junction, providing crucial signals for entering and exiting the market.
- Yellow Line (Market State):
- The yellow line acts as the linchpin, connecting all other components. It offers insight into the broader market trend, and deviations from its usual behavior can signal potential trend shifts.
- Blue Lines (Bollinger Bands):
- Two blue lines, one above and one below, represent market turbulence akin to the Bollinger Bands. Their enlargement indicates increased volatility, while a narrowing suggests a reduction in volatility.
How to Use the TDI With Alerts Indicator:
- Identifying Trends:
- The short-term trend shifts from downward to upward when the green line crosses above the red line. Conversely, a crossing of the green line below the red indicates a downturn in the short-term trend.
- Utilizing the Yellow Line:
- The yellow line plays a pivotal role in determining long-term trends. Deviations from its usual behavior signal potential trend shifts.
- Assessing Market Strength:
- The slope of the green line reflects market strength. A steeper slope suggests strong market participation, while a horizontal movement indicates a sluggish market.
- Interpreting Bollinger Bands:
- Enlarged Bollinger Bands denote increased volatility, while a narrowing suggests reduced volatility. Traders should exercise caution during significant narrowing, especially before major market-affecting news.
Trading Signals and Strategy:
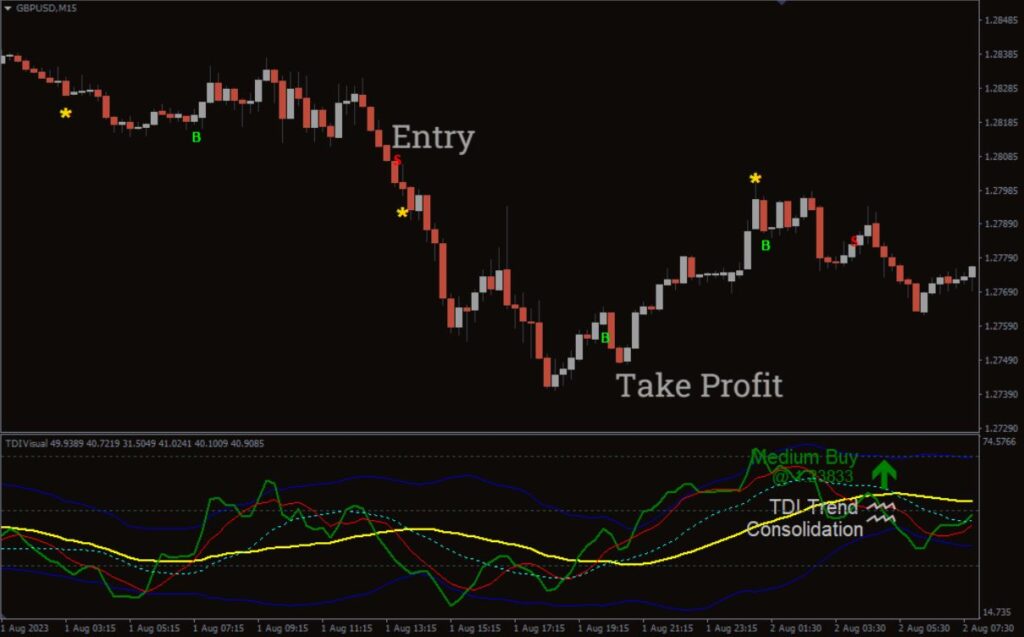
- Buy Signal:
- Confirm the buy signal when the green line exceeds the yellow and red lines. A green ‘B’ will appear on the chart. Set a stop loss at the previous low and exit when the green line drops below the red line.

- Sell Signal:
- Validate the sell signal when the red line exceeds the yellow and green lines. A red ‘S’ will appear on the chart. Place a stop loss at the previous high and exit when the red line falls below the green line.

TDI With Alerts Forex Indicator MT4 Free Download
Read More SMART MACHINE Best Forex EA FREE Download [Update]
Conclusion:
The TDI With Alerts indicator for MT4 combines moving averages and Bollinger bands to provide a nuanced understanding of market trends and strength. Its clear entry signals, displayed on the chart, empower traders to make informed decisions and confidently navigate the complexities of the forex market. With its integrated approach, the TDI With Alerts indicator is a valuable ally for traders seeking to master market trends and optimize their trading strategies.


Sell Signal:
“Validate the sell signal when the red line exceeds the yellow and green lines.”
Wouldn’t it be GREEN line exceeds yellow and red lines?