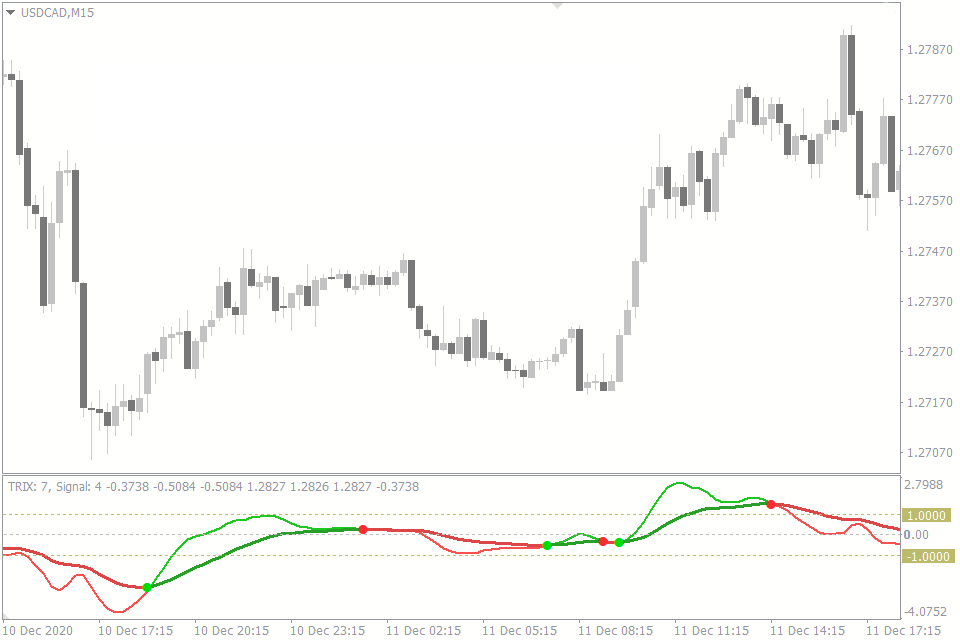
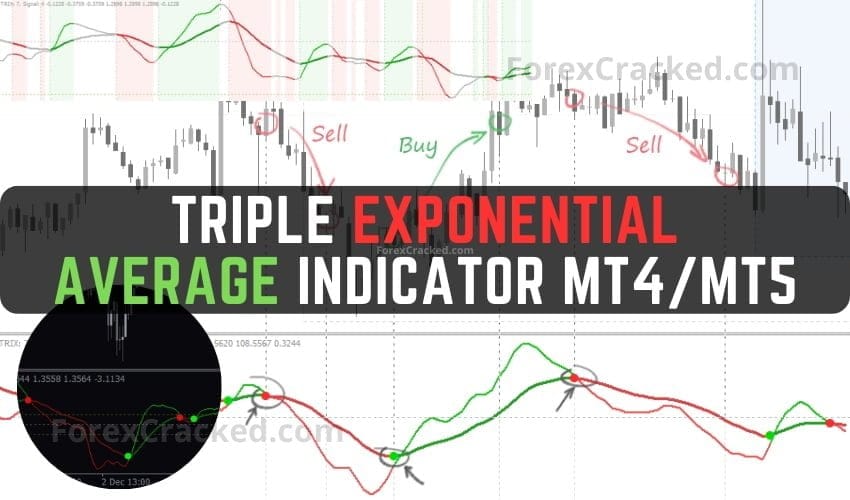
Trix Crossover Indicator is an MT4/MT5 indicator designed around the nearly classic technical analysis tool, Trix. As a triple exponential moving average Indicator (TEMA), the TRIX Indicator offers a unique advantage over traditional moving averages (MAs). Rather than appearing directly on a candlestick chart, the TRIX is an oscillator, with its line displayed in a separate window. This distinct presentation highlights the rate of change of the indicator through repeated fluctuations.
The TRIX offers traders an accurate and reliable perspective by relying solely on price data. The indicator does not repaint, making it an ideal choice for intraday trading and scalping in the Forex market. For optimal performance, traders should focus on timeframes between M1 and M30, ensuring efficient and effective market analysis.
Table of Contents
This TEMA MT4 can be used on any Forex currency pair and other assets such as commodities, Cryptos, Binary Options, Stock markets, Indices, etc. You can also use it on any time frame that suits you best, from the 1-minutes to the Month charts. For optimal use, it is recommended to work with timeframes ranging from M1 to M30.
This is an entirely free Indicator without any restrictions made by the fxssi.com website. There are more useful free and paid indicators on this website. So check out their other indicators and show some love for the FXSSI Indicators.
What is Triple Exponential Moving Average
The Triple Exponential Moving Average (TEMA) is a technical indicator used in financial analysis to smooth out price movements and identify trends. It is a variation of the traditional Exponential Moving Average (EMA), a moving average that places greater weight on more recent data points.
The TEMA goes a step further by applying three separate EMAs to the price data, with each EMA providing a greater weight to more recent price data. This triple smoothing results in a more responsive indicator that can better track short-term price movements while remaining robust to longer-term trends.
You first calculate the single EMA for the period in question to calculate the TEMA. You then take the difference between this EMA and a second EMA calculated over twice the period length. Finally, you accept the difference between these two EMAs and add it to a third EMA calculated over three times the original period length. The resulting value is the TEMA.
The TEMA can be used in various ways, such as identifying potential trend changes, as a signal for entering or exiting trades, or as a filter for other technical indicators. However, as with any technical indicator, it is essential to use the TEMA in conjunction with other analysis forms and manage risk carefully.
How is the TEMA Indicator used in Forex Trading
TEMA can be used in forex trading in several ways. Here are a few examples:
- Identifying Trends: TEMA Indicator can be used to identify the direction of a trend. When the TEMA rises, it indicates a bullish trend, while a falling TEMA indicates a bearish trend. Forex traders can use this information to enter trades in the direction of the trend.
- Trading Signals: TEMA can generate trading signals when it crosses over or under the price. For example, when the TEMA crosses above the price, it is a bullish signal, indicating that traders should consider entering a long position. Conversely, when the TEMA crosses below the price, it is a bearish signal, indicating that traders should consider entering a short position.
- Confirmation: TEMA can be used to confirm other technical indicators. For example, if a forex trader uses a stochastic oscillator to identify overbought or oversold conditions, they can use the TEMA to confirm these signals. If the stochastic oscillator generates a buy signal, but the TEMA is still falling, it may indicate that the overall trend is still bearish, and the trader should be cautious.
- Stop Losses: Forex traders can also use TEMA to set stop-loss orders. If the TEMA rises, traders can place their stop-loss orders below the TEMA to protect their profits. Conversely, if the TEMA falls, traders can set their stop-loss orders above the TEMA to limit their losses.
It is important to note that Trix Indicator, like any other technical indicator, is not foolproof and can generate false signals. Therefore, forex traders should use TEMA in conjunction with other forms of analysis and carefully manage their risks.
Features of the TRIX Crossover Indicator
The benefits of TRIX Indicator compared to others include the following aspects:
- The Trix lines, fast and slow, each possess unique periods and are computed separately.
- This 3-in-1 indicator encompasses three distinct techniques for signal analysis.
- Supplementary levels and the Trix histogram enhance precision in monitoring the indicator’s fluctuations.
- The indicator is not restricted to just the exponential moving average; alternative moving average types are also applicable. Additionally, the parameters of bars or candlesticks used in calculations can be adjusted.
Download a Collection of Indicators, Courses, and EA for FREE
How TRIX Indicator works
Through triple smoothing, minor variations in the price chart are eliminated, ensuring that signals are generated only when a consistent trend is present.
A shorter moving average period increases the sensitivity of the Trix, leading to more frequent signal generation.
The TEMA MT5 indicator utilizes two Trix lines – the fast (signal) line and the slow (main) line.
Triple Exponential Moving Average Indicator generates three types of signals
- Crossover of the fast and the slow Trix lines (reversal signal).
- Crossover of the Trix and the zero line (trend signal).
- Both these lines move in the same direction.
The Trix is a momentum indicator by nature, but it also gives trend signals in addition to the reversal ones.
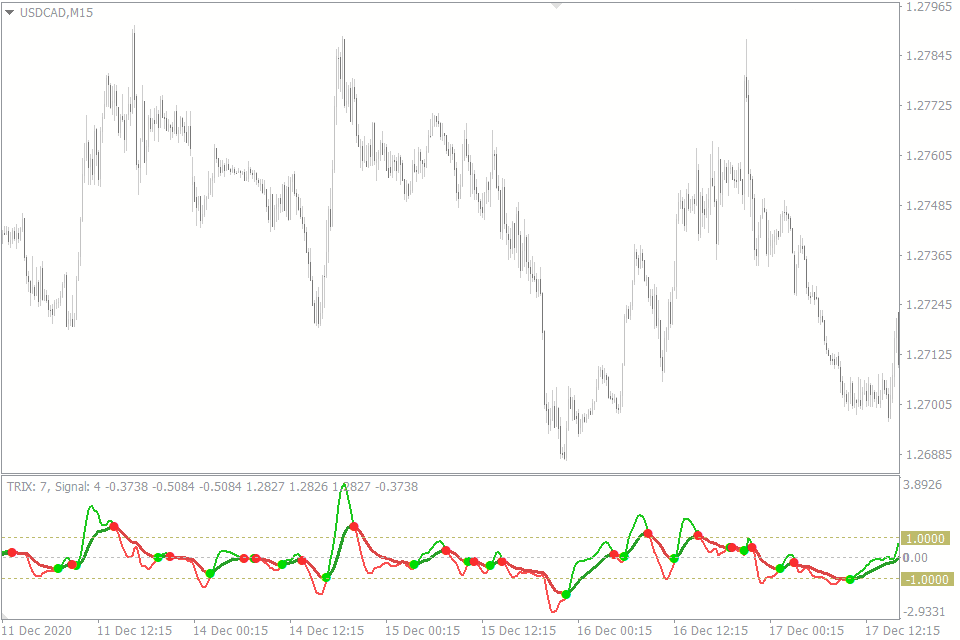
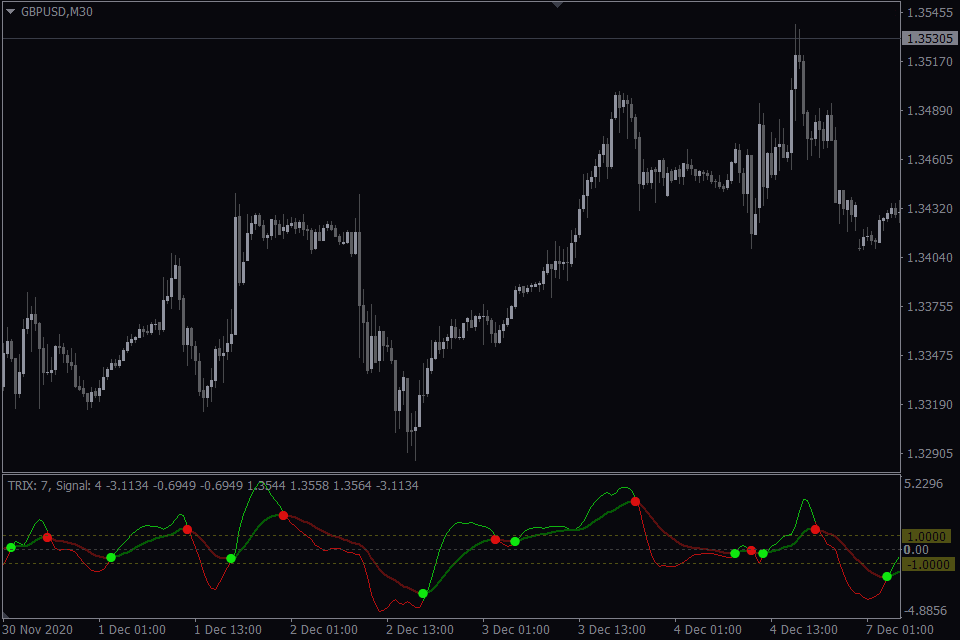
Crossover of the Trix and the signal line
When the Trix line resides above the zero line, it indicates an overbought condition; inversely, when the Trix is beneath the zero line, it suggests an oversold situation.
To accurately identify the reversal timing, the crossover of the Trix and the signal line should be observed:
- A Buy signal emerges when the signal line surpasses the Trix.
- A Sell signal arises when the signal line falls below the Trix.
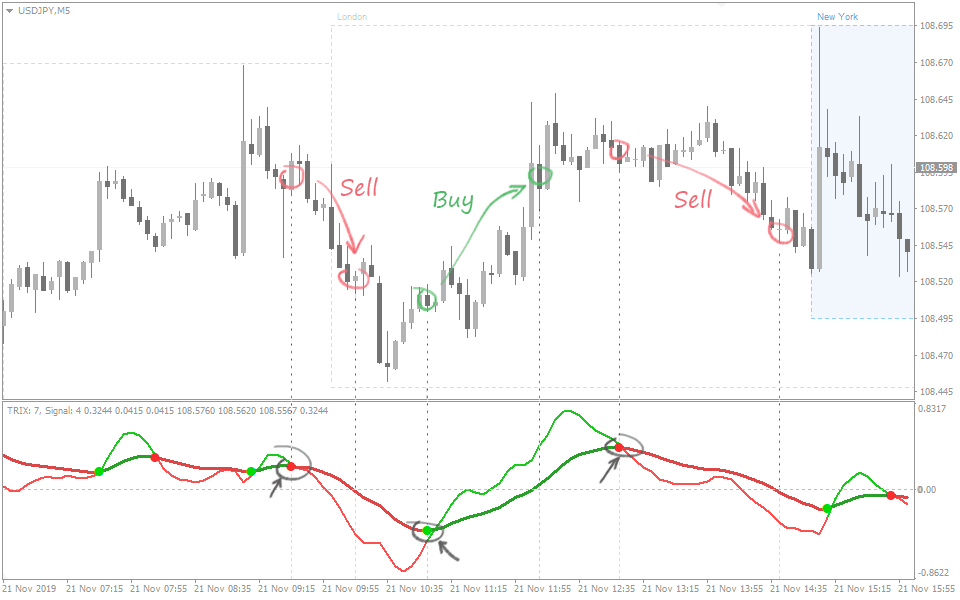
It is advisable to close a trade without waiting for a counter signal. You can establish a fixed Take Profit size or exit the trade when the Trix line, for instance, intersects the zero line.
In such cases, the zero line signifies the end of the reversal momentum, making way for the upcoming trend phase. Consequently, if the trend’s direction is unclear, it is preferable to exit the trade.
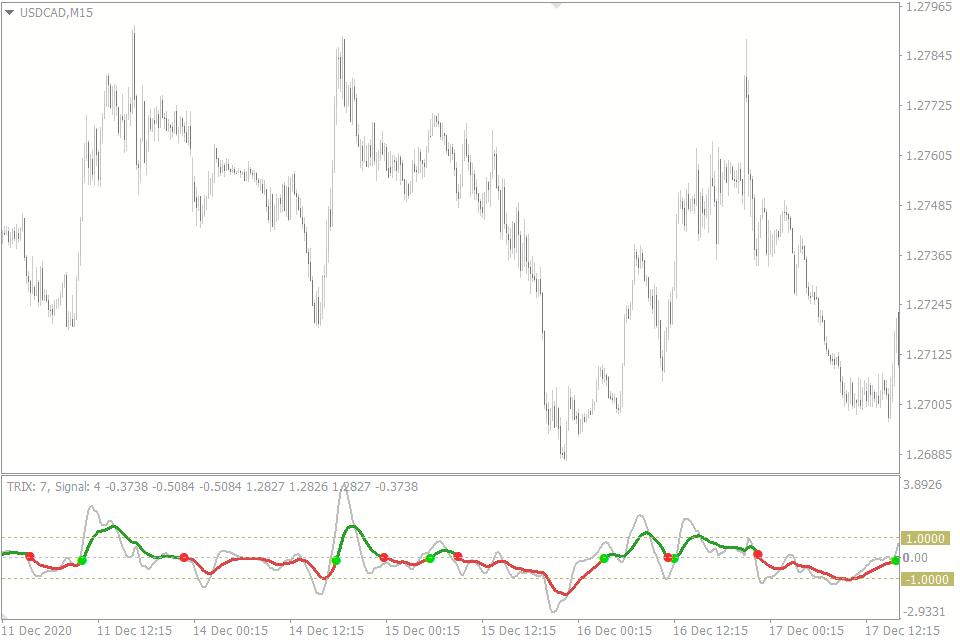
Crossover of the Trix and the zero line
The given type of signal by the Triple Exponential Moving Average Indicator is more suited to trend trading.
The signal is usually generated when the price leaves the flat zone, and there is a chance of the beginning of a new trend:
- The Trix is above the zero line – Buy.
- The Trix is below the zero line – Sell.
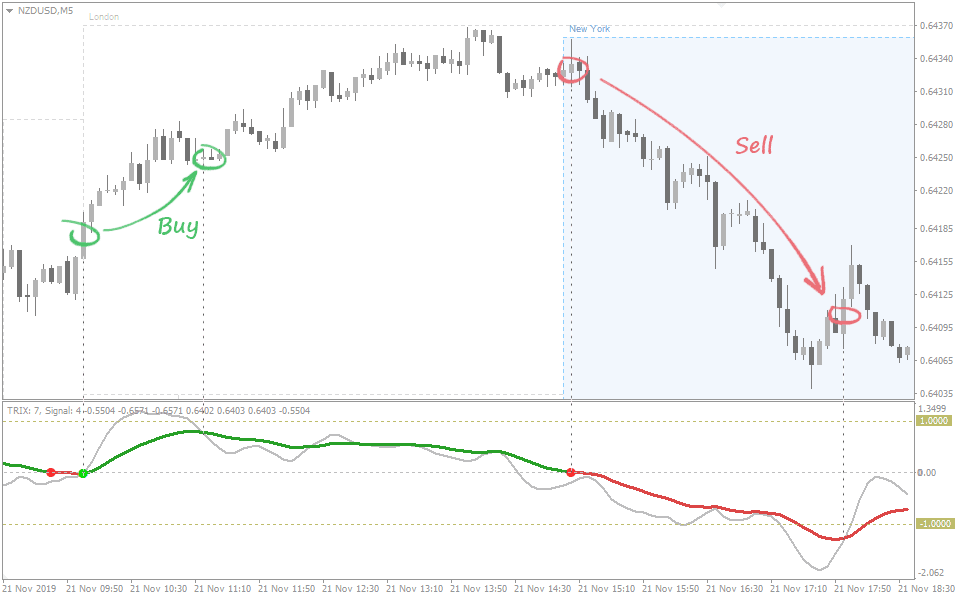
As in the previous case, a trade should be closed without waiting for the momentum to fade and the opposite signal to occur.
Both lines move in the same direction
In this instance, the focus is on identifying the concurrence of long-term and short-term trends.
The rationale is straightforward and mirrors the widely-referenced “Elder’s Triple Screen” strategy: a trend is more likely to persist if signals align across various timeframes (time periods).
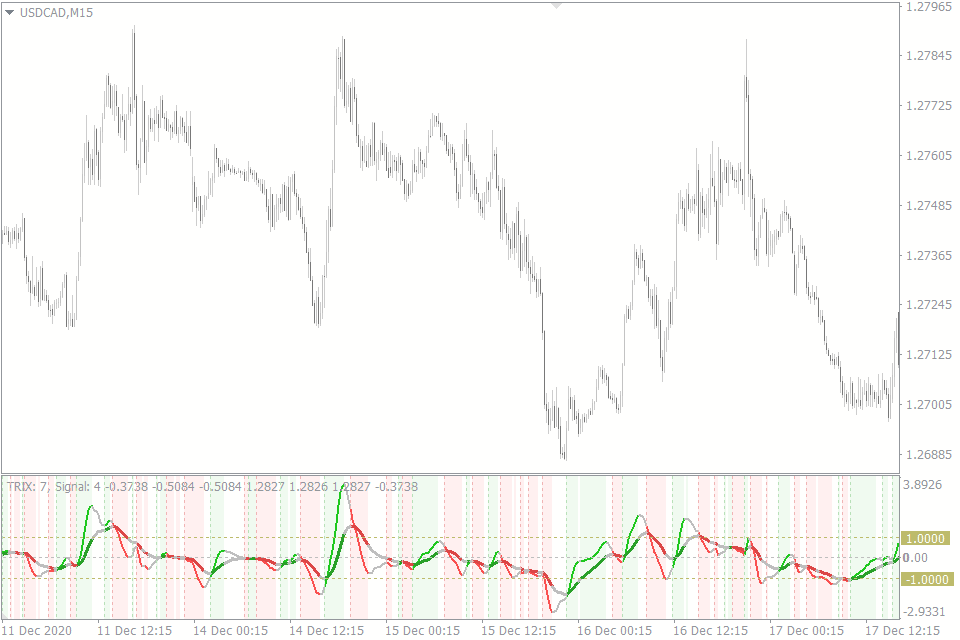
A signal arises when the Trix and the signal line travel in the same direction:
- When both lines ascend – a Buy signal is generated.
- When both lines descend – a Sell signal is produced.
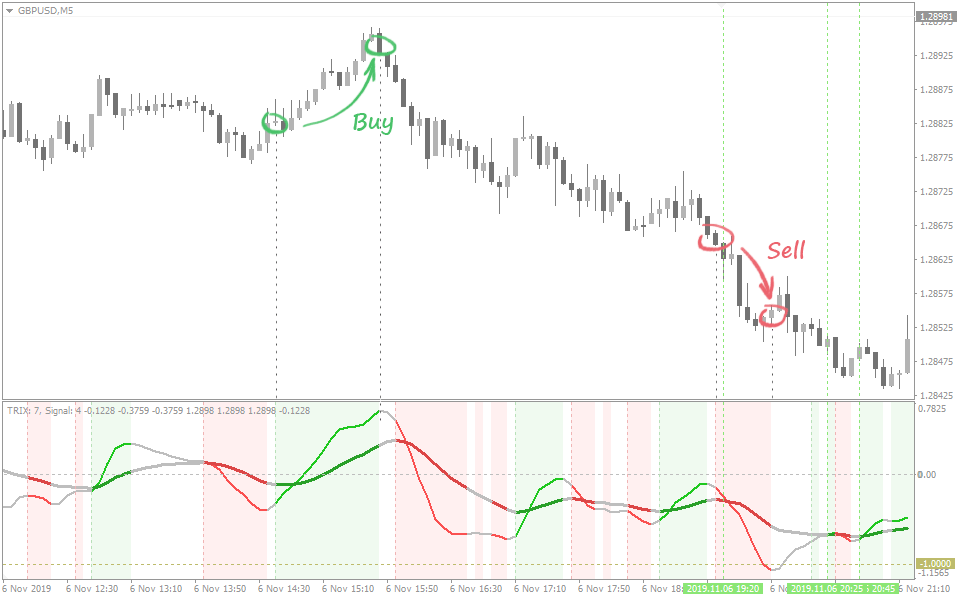
This method effectively pinpoints exit points. As demonstrated in the image, the indicator timely switched to a neutral signal, aligning with the price reversal.
Therefore, a trade should be closed when the lines lose synchronization and begin moving in opposing directions.
TEMA MT4 Input Parameters
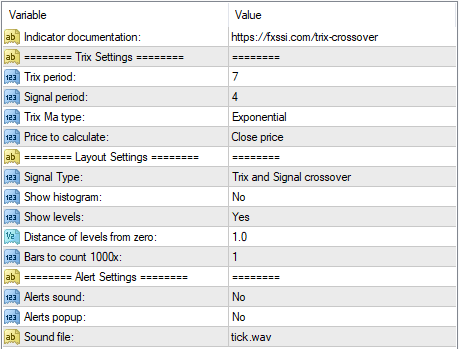
- Trix Period. Determines the number of candlesticks to be used to calculate the Trix indicator (main line).
- Signal period. Determines the number of candlesticks to be used to calculate the signal line.
- Trix MA type. This parameter determines the moving average. The available parameters are as follows: Simple, Exponential, Smoothed, and Linear weighted. It is applied both for the Trix line and the signal line.
- Price to calculate. Determines which candlestick’s parameters (OHLC) should be used in the TEMA Indicator calculation.
- Signal Type:
- Trix and signal crossover – crossover of the Trix and the signal line.
- Trix crossing zero point – the Trix crosses the zero line.
- Trix and signal moving in one direction – both lines move in the same direction.
- Show histogram. The histogram that shows the difference between the Trix and the signal line.
- Show levels. Shows horizontal levels.
- Distance of levels from zero. The distance between the auxiliary levels and the zero line.
- Bars to count. The number of bars or candlesticks to be used in the calculation.
- Alerts. Customizes a sound signal or Pop-up window.
- More Free Indicators by this Developer FXSSI
Conclusion
In conclusion, the Trix Crossover Indicator for MT4/MT5 offers a unique edge over traditional moving averages. As a TEMA oscillator, it provides invaluable insights for market analysis, making it ideal for intraday trading and scalping in the Forex market. Focusing on M1 to M30 timeframes ensures efficient market analysis.
Key advantages include separate computation of fast and slow Trix lines, diverse signal analysis techniques, supplementary levels, and histograms for increased precision, and adaptability to alternative moving averages and adjustable parameters. By embracing the TRIX Indicator’s features, traders can enhance their performance and decision-making in a dynamic trading environment.



isnt this just macd ?
yeah this is good if you guys wonder.
combine with ema 200
use trix crossing zero point option
happy trend trading 🙂
[…] Oscillator: The Triple Exponential Moving Average (TRIX) is a powerful technical analysis tool designed to help traders determine the momentum of a […]
[…] with complementary indicators can amplify its effectiveness. For example, pairing it with a moving average can validate trend […]