


In the fast-paced world of forex trading, making informed decisions is crucial for success. One of the most effective ways to analyze the market and predict future price movements is through the use of technical indicators. These tools are indispensable for traders, offering insights into market trends, momentum, volatility, and potential turning points. This article will delve into what are technical indicators, the different types available, how they work, and how to use them effectively in forex trading.
What Are Technical Indicators?
Technical indicators are mathematical calculations based on historical price data, such as closing prices, volume, or open interest. These indicators are plotted as charts and graphs, providing visual signals that help traders identify market trends, entry and exit points, and potential reversals. Unlike fundamental analysis, which focuses on the economic factors driving currency prices, technical analysis relies on patterns and statistical data.
Types of Technical Indicators
Technical indicators can be classified into several categories, each serving a specific purpose in market analysis:
Trend Indicators
Trend indicators help traders identify the direction of the market. They are crucial for understanding whether a currency pair is trending upward, downward, or moving sideways. Some of the most popular trend indicators include:
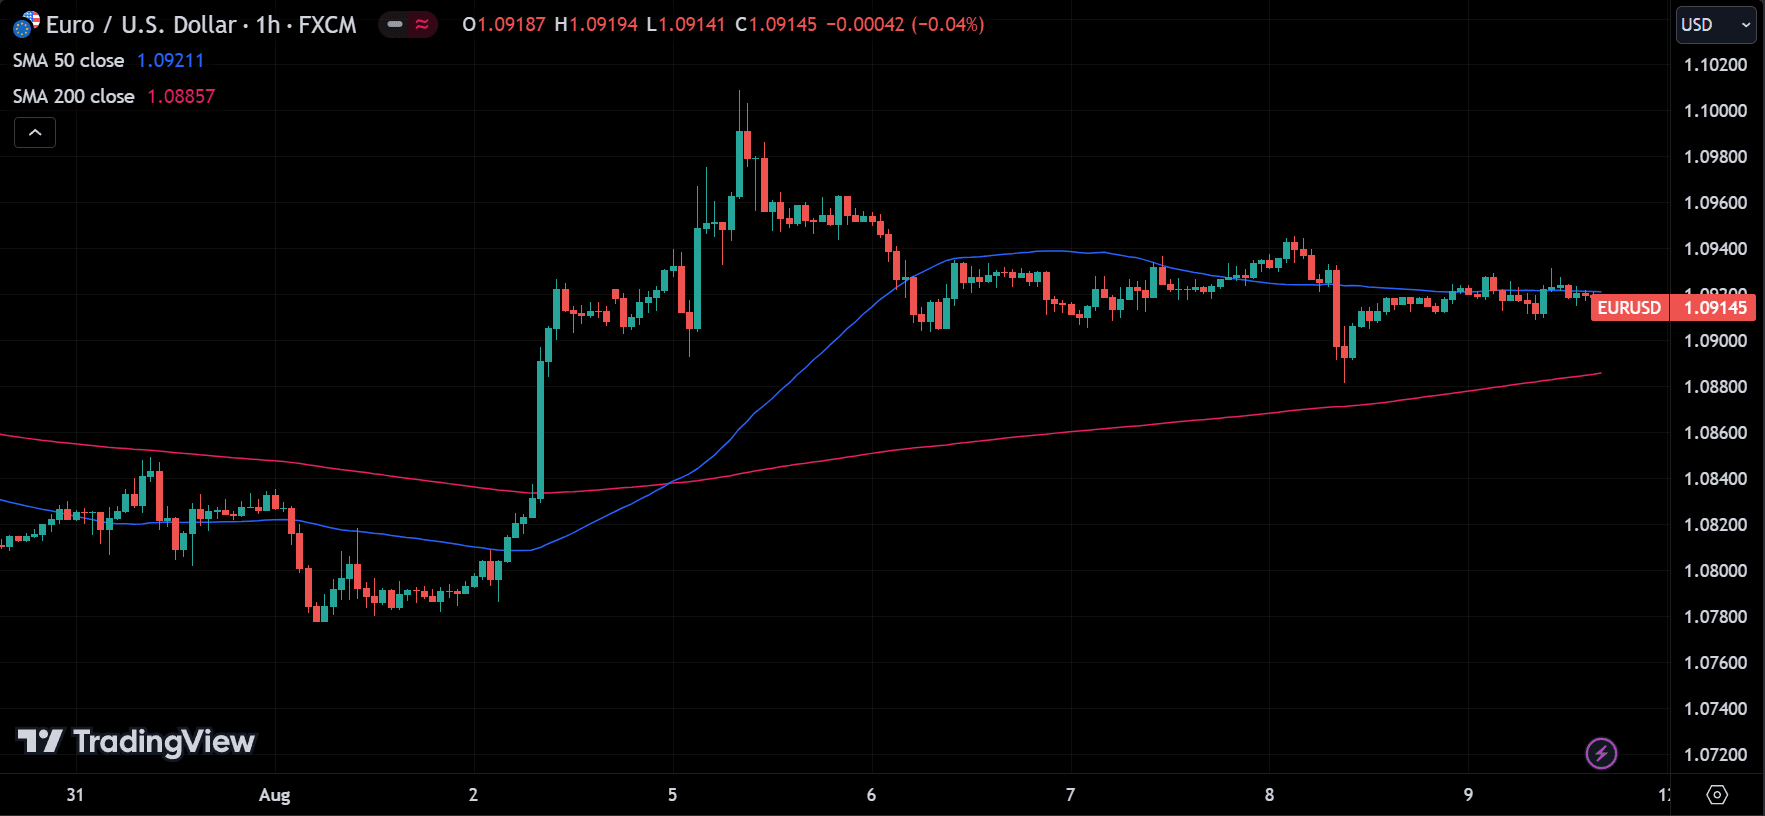
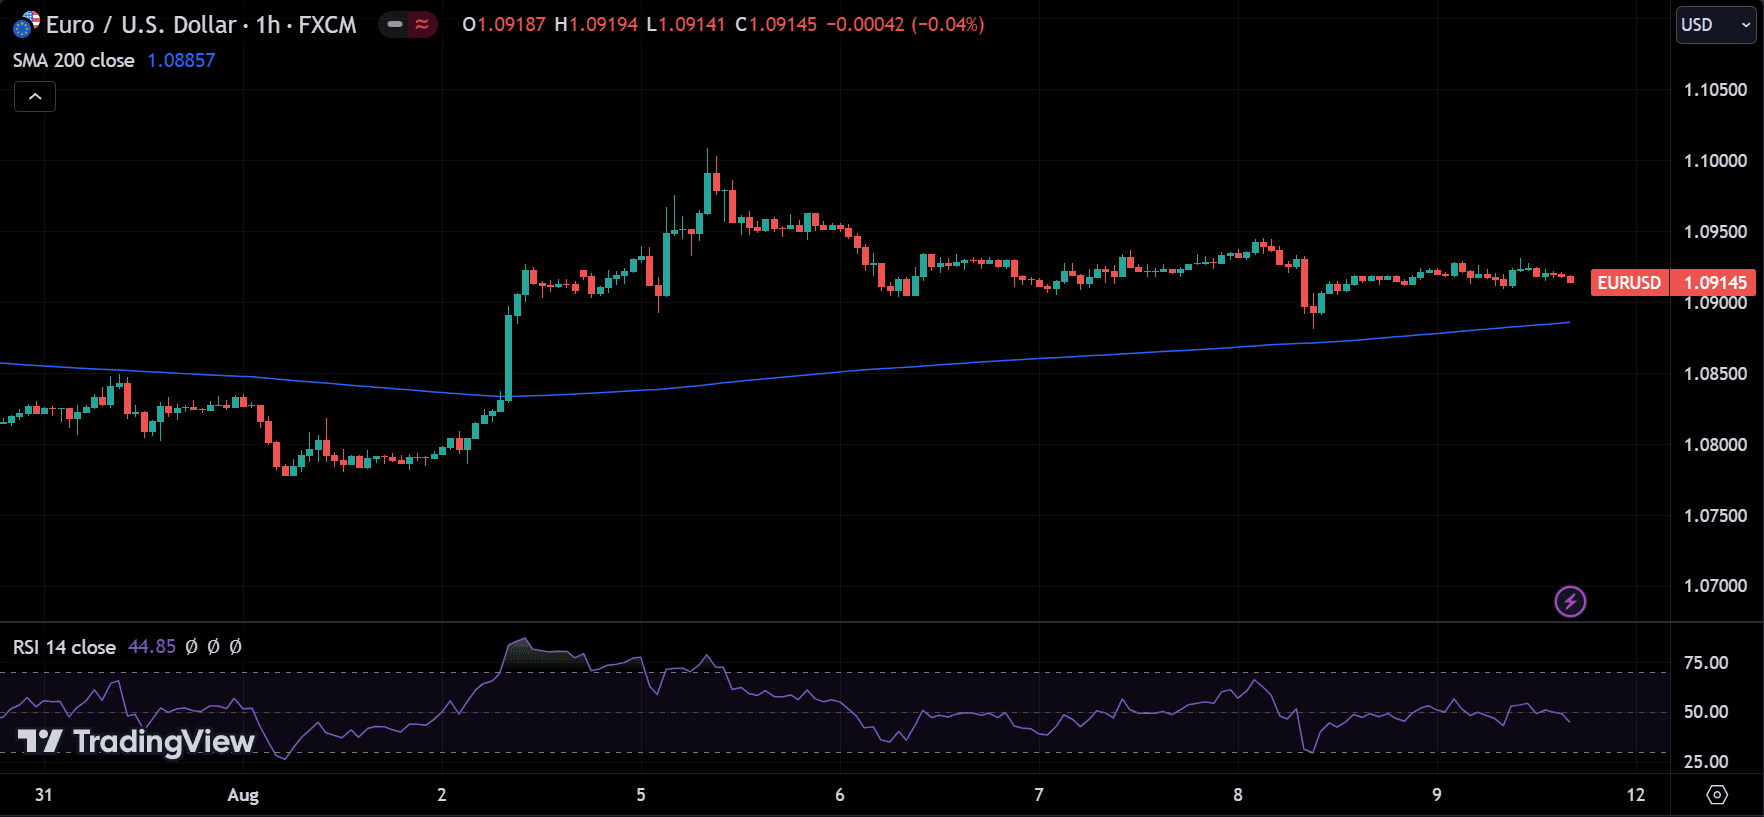
- Moving Averages (MA): Moving averages smooth out price data to create a single flowing line that makes it easier to identify the direction of the trend. Traders often use combinations like the 50-day and 200-day moving averages to spot crossover points that signal potential buy or sell opportunities.
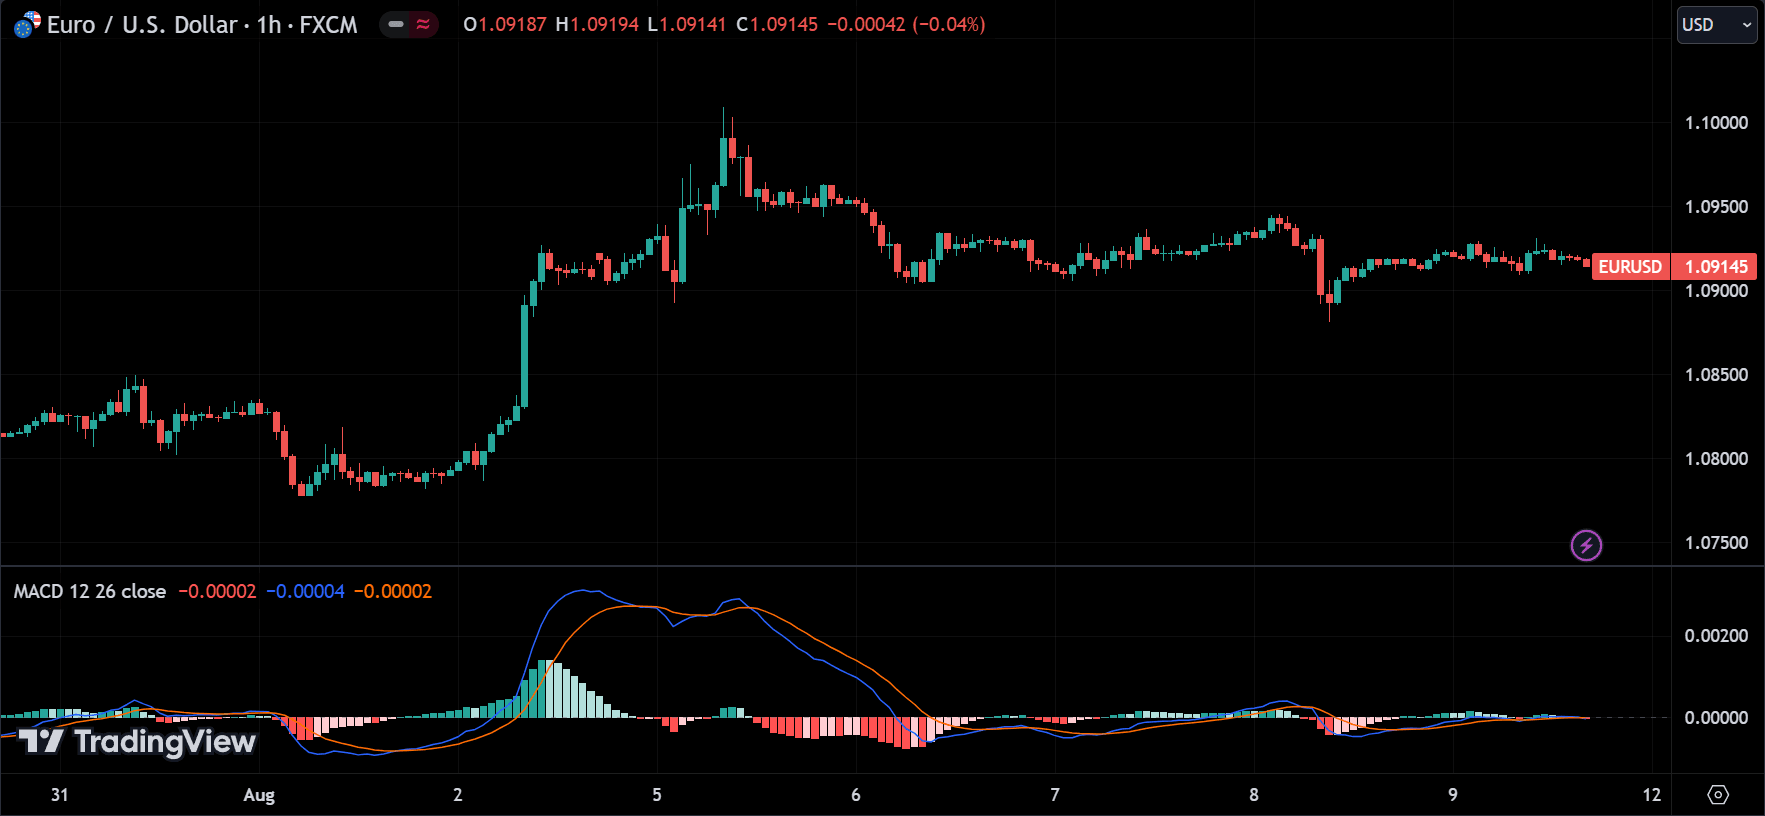
- Moving Average Convergence Divergence (MACD): The MACD is a trend-following indicator that shows the relationship between two moving averages. It is used to identify changes in the strength, direction, momentum, and duration of a trend.
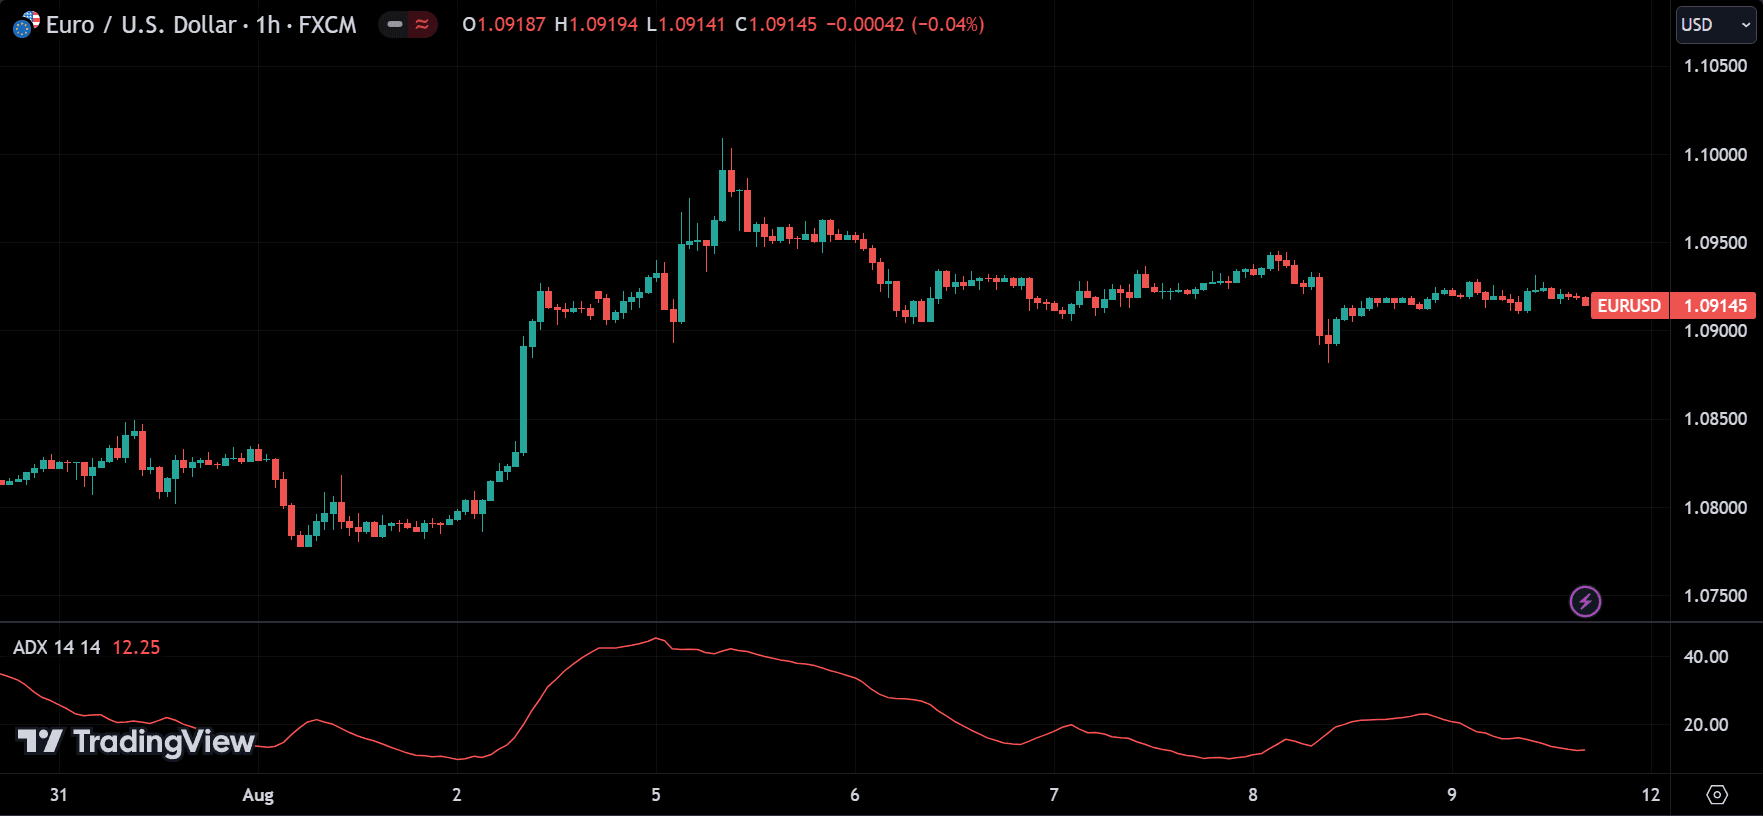
- Average Directional Index (ADX): The ADX measures the strength of a trend. A high ADX value indicates a strong trend, while a low ADX value suggests a weak trend or a sideways market.
Momentum Indicators
Momentum indicators measure the speed at which prices are moving over a specific period. These indicators help traders gauge the strength of a trend and identify potential reversals. Common momentum indicators include:
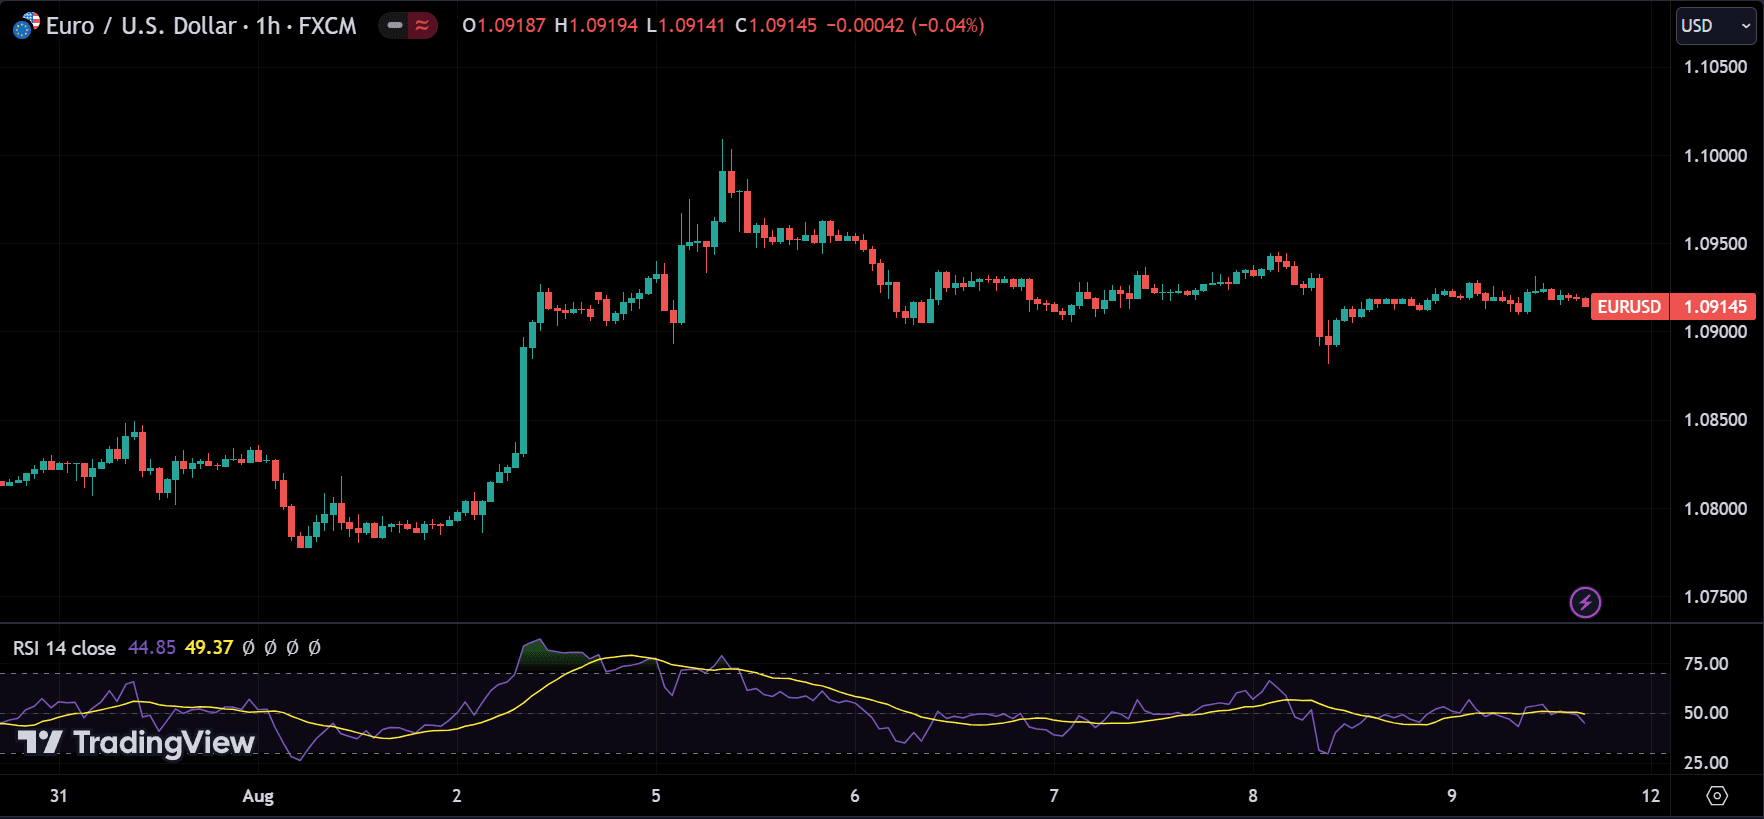
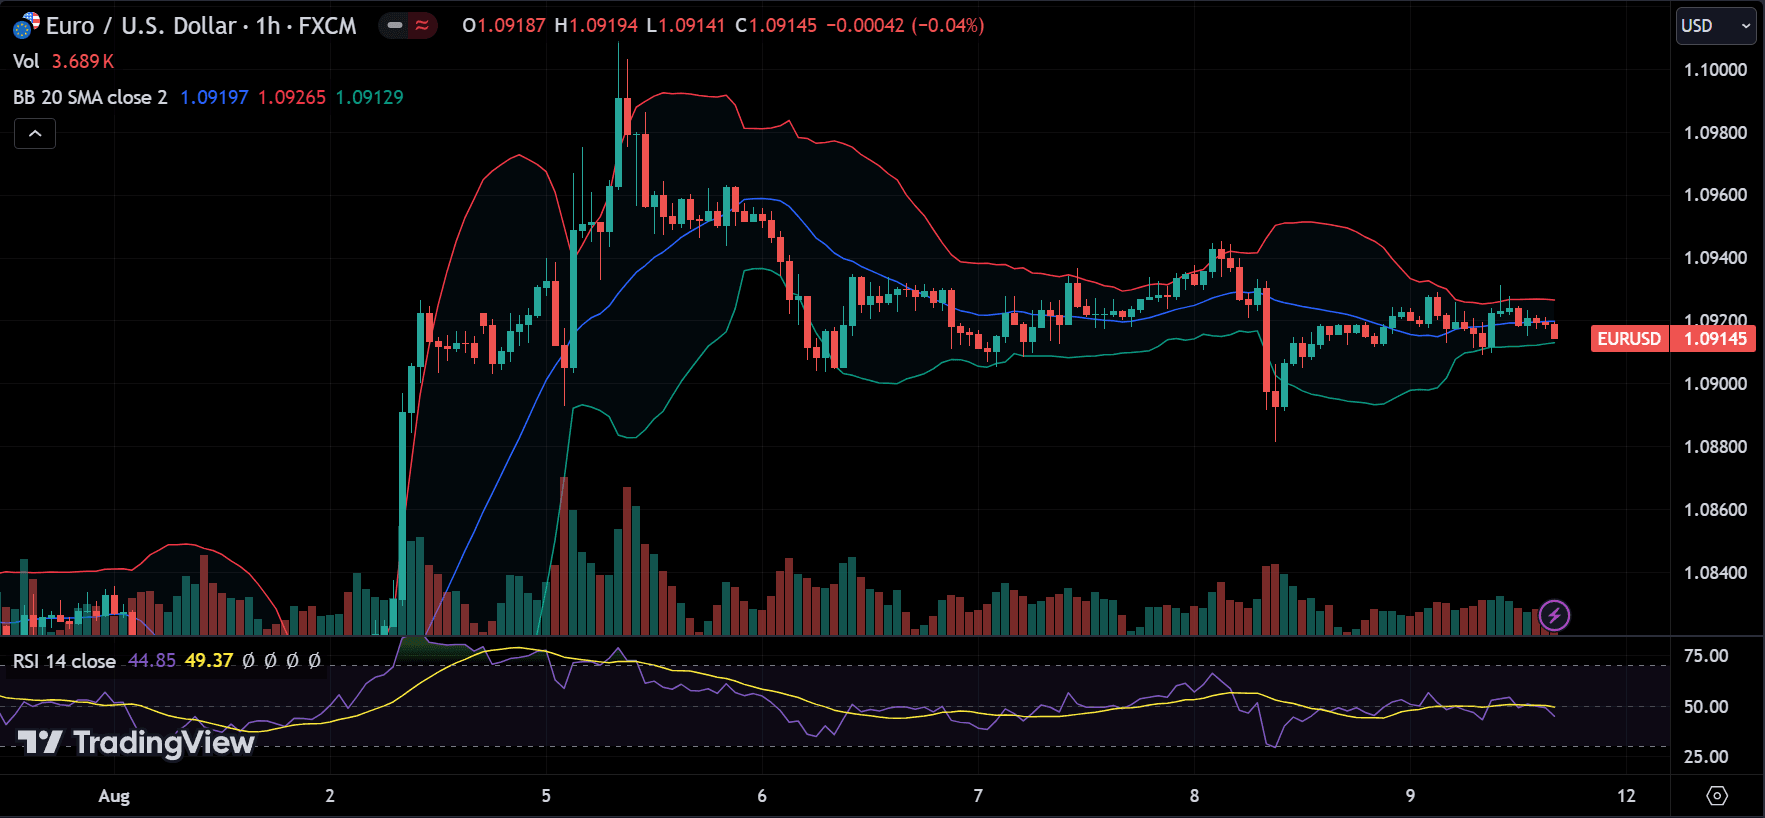
- Relative Strength Index (RSI): The RSI is a momentum oscillator that measures the speed and change of price movements. It ranges from 0 to 100, with values above 70 indicating overbought conditions and values below 30 indicating oversold conditions.
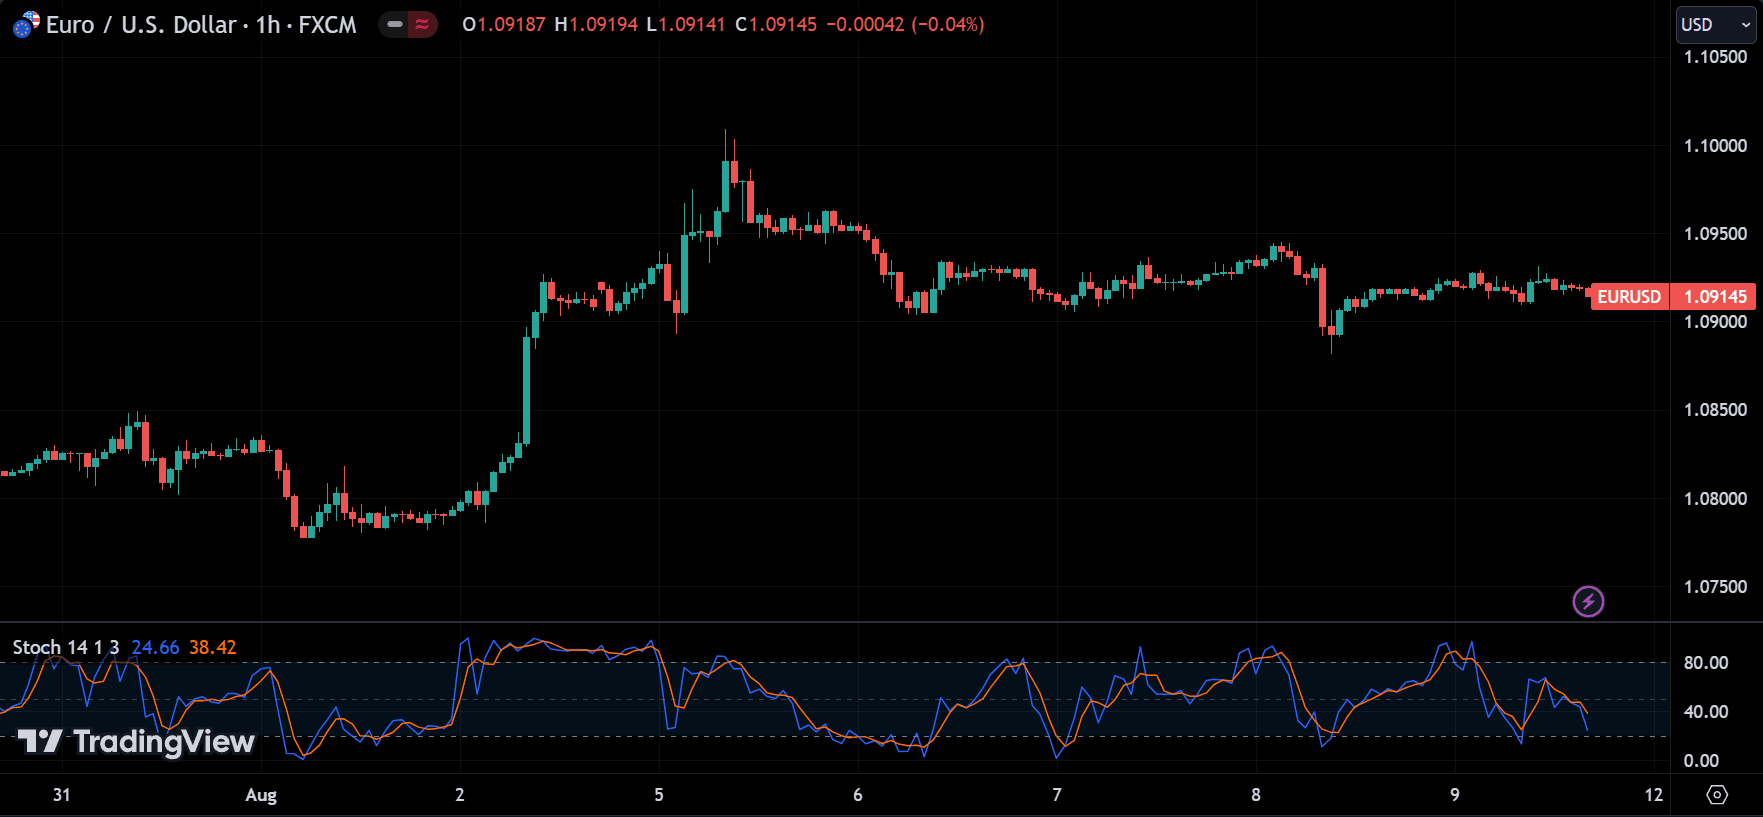
- Stochastic Oscillator: This indicator compares a currency pair’s closing price to its price range over a specific period. It is used to identify overbought and oversold conditions.
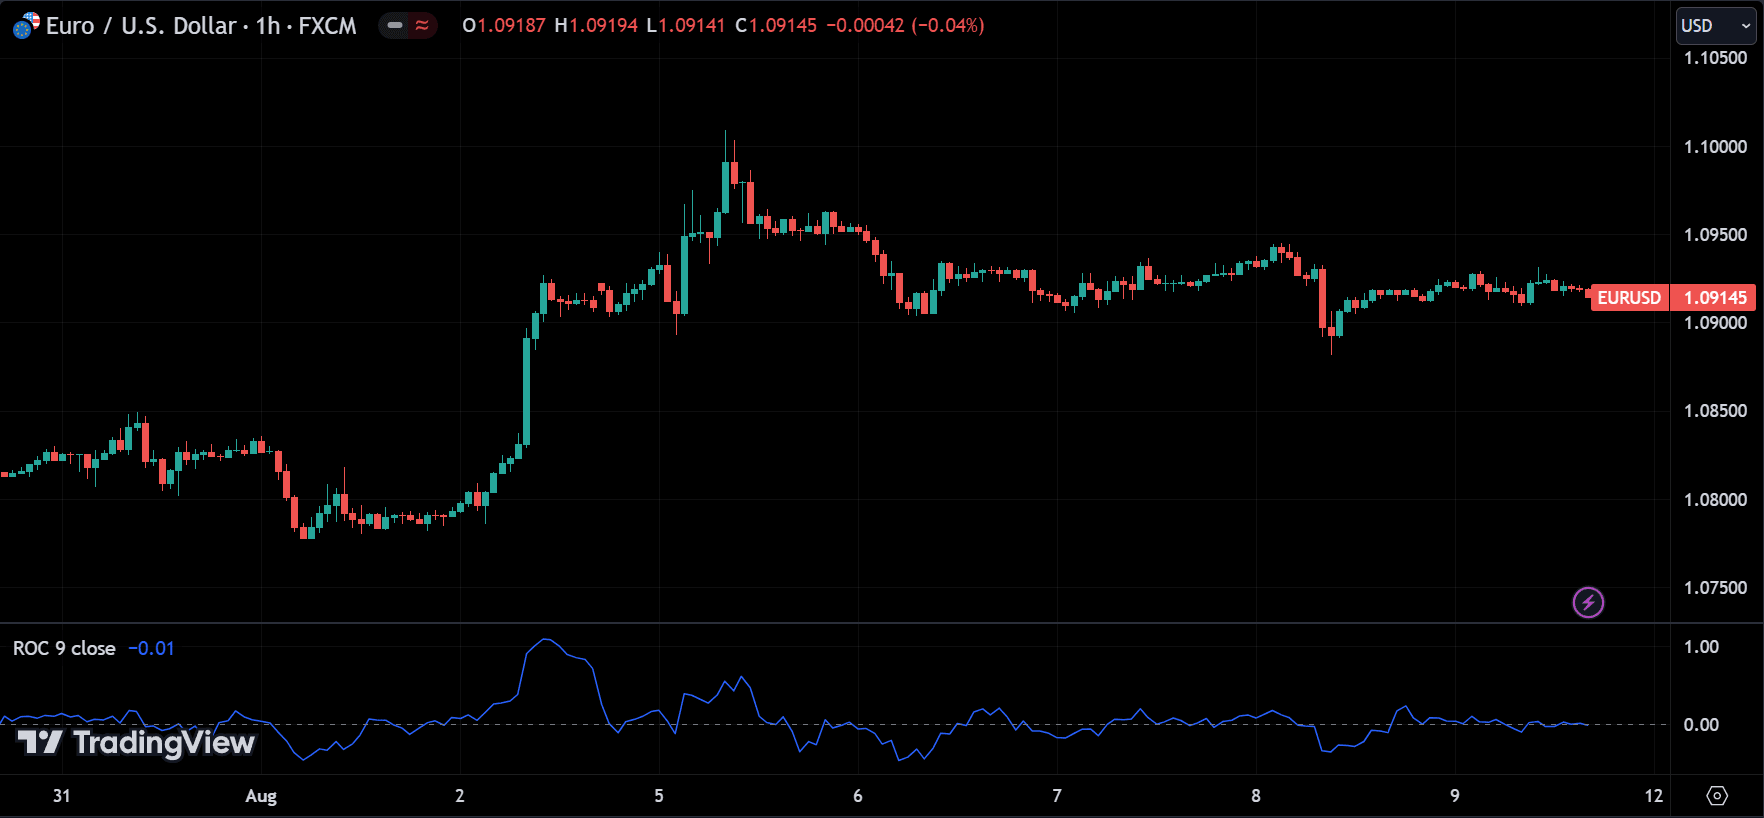
- Rate of Change (ROC): The ROC calculates the percentage change in price over a specified period, helping traders identify the strength of a trend.
Volatility Indicators
Volatility indicators provide insights into the market’s price fluctuations, indicating how much the price of a currency pair is likely to move. High volatility often signals potential trading opportunities. Key volatility indicators include:
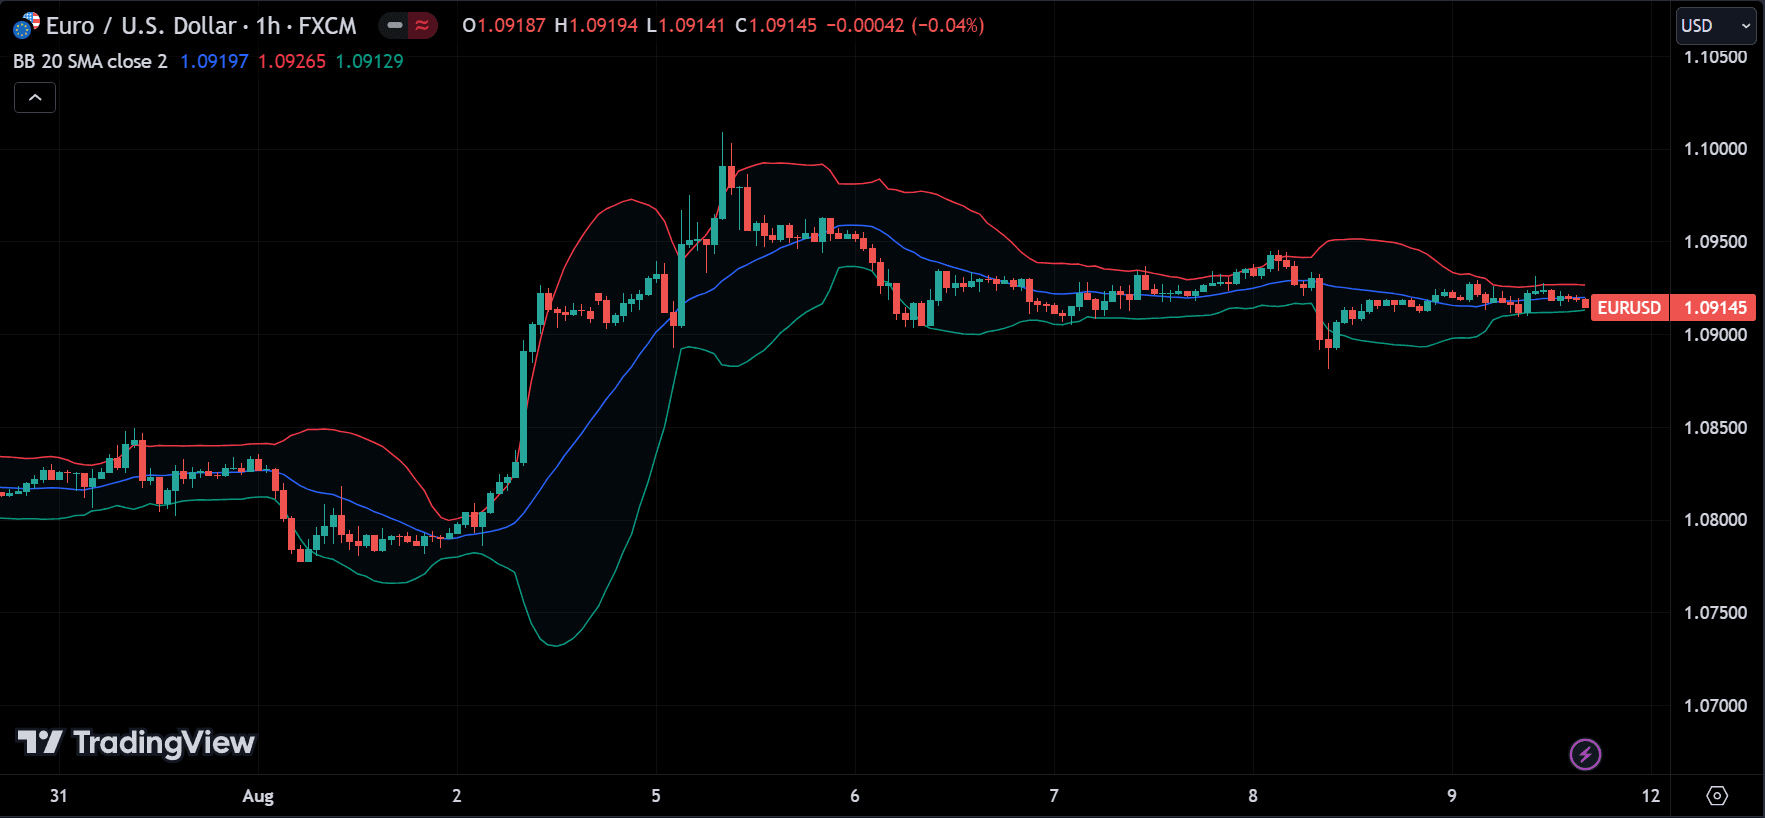
- Bollinger Bands: Bollinger Bands consist of a moving average and two standard deviations plotted above and below it. They help traders identify potential breakout points by highlighting periods of high and low volatility.
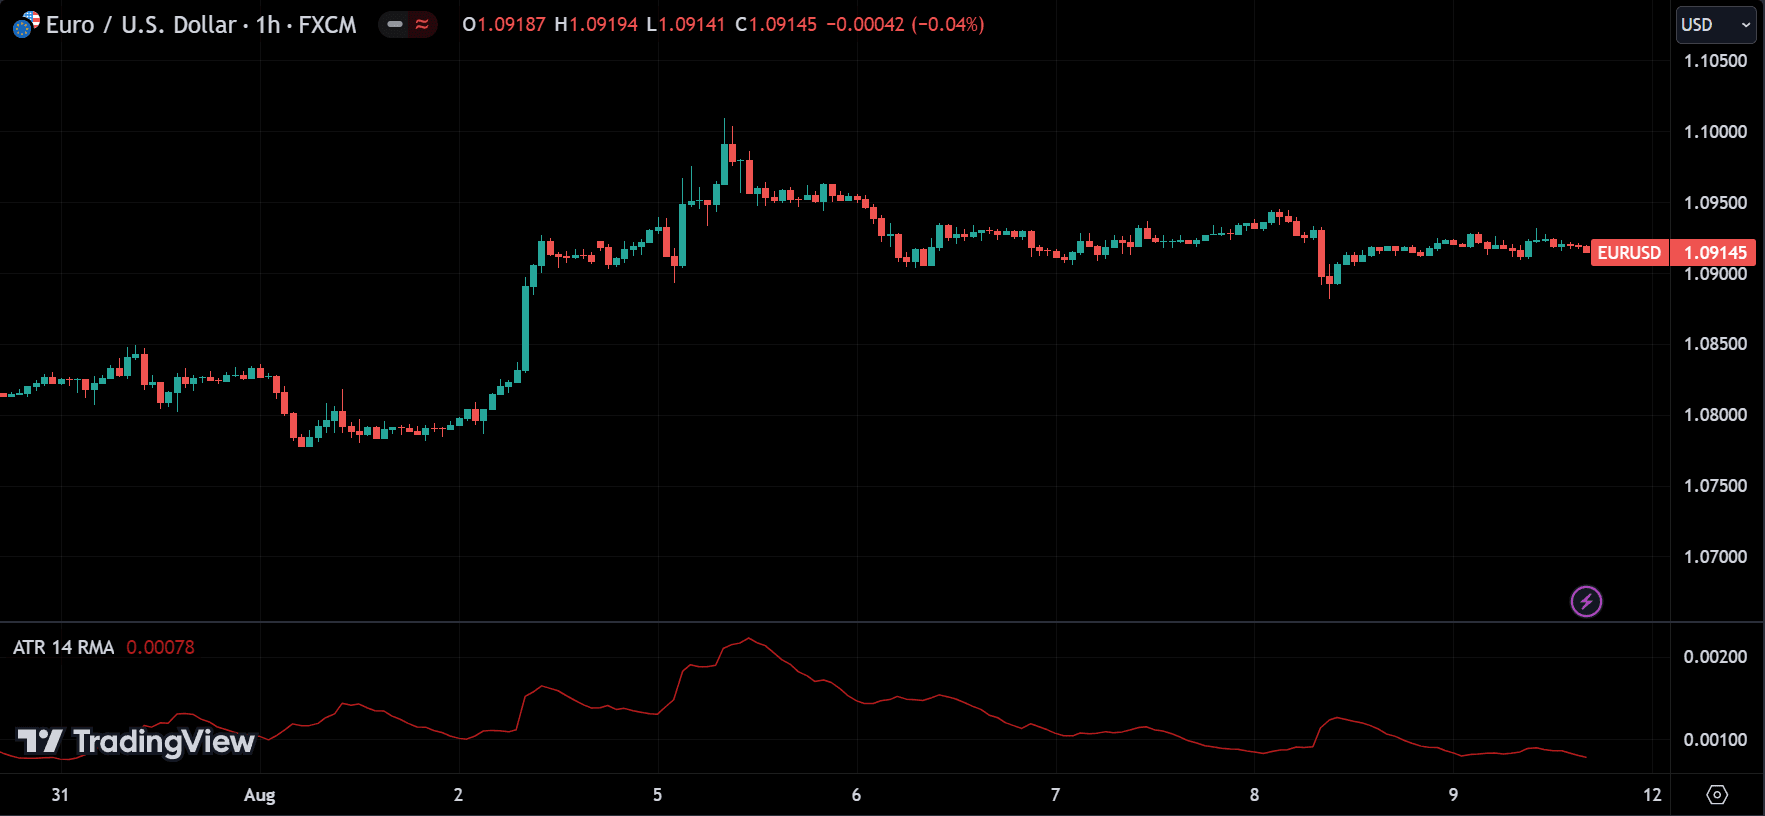
- Average True Range (ATR): The ATR measures market volatility by calculating the average range between the high and low prices over a specific period. It helps traders set stop-loss levels and identify potential price reversals.
Volume Indicators
Volume indicators analyze the number of trades made during a specific period to assess the strength of a price movement. They provide clues about the intensity of buying or selling pressure in the market. Popular volume indicators include:
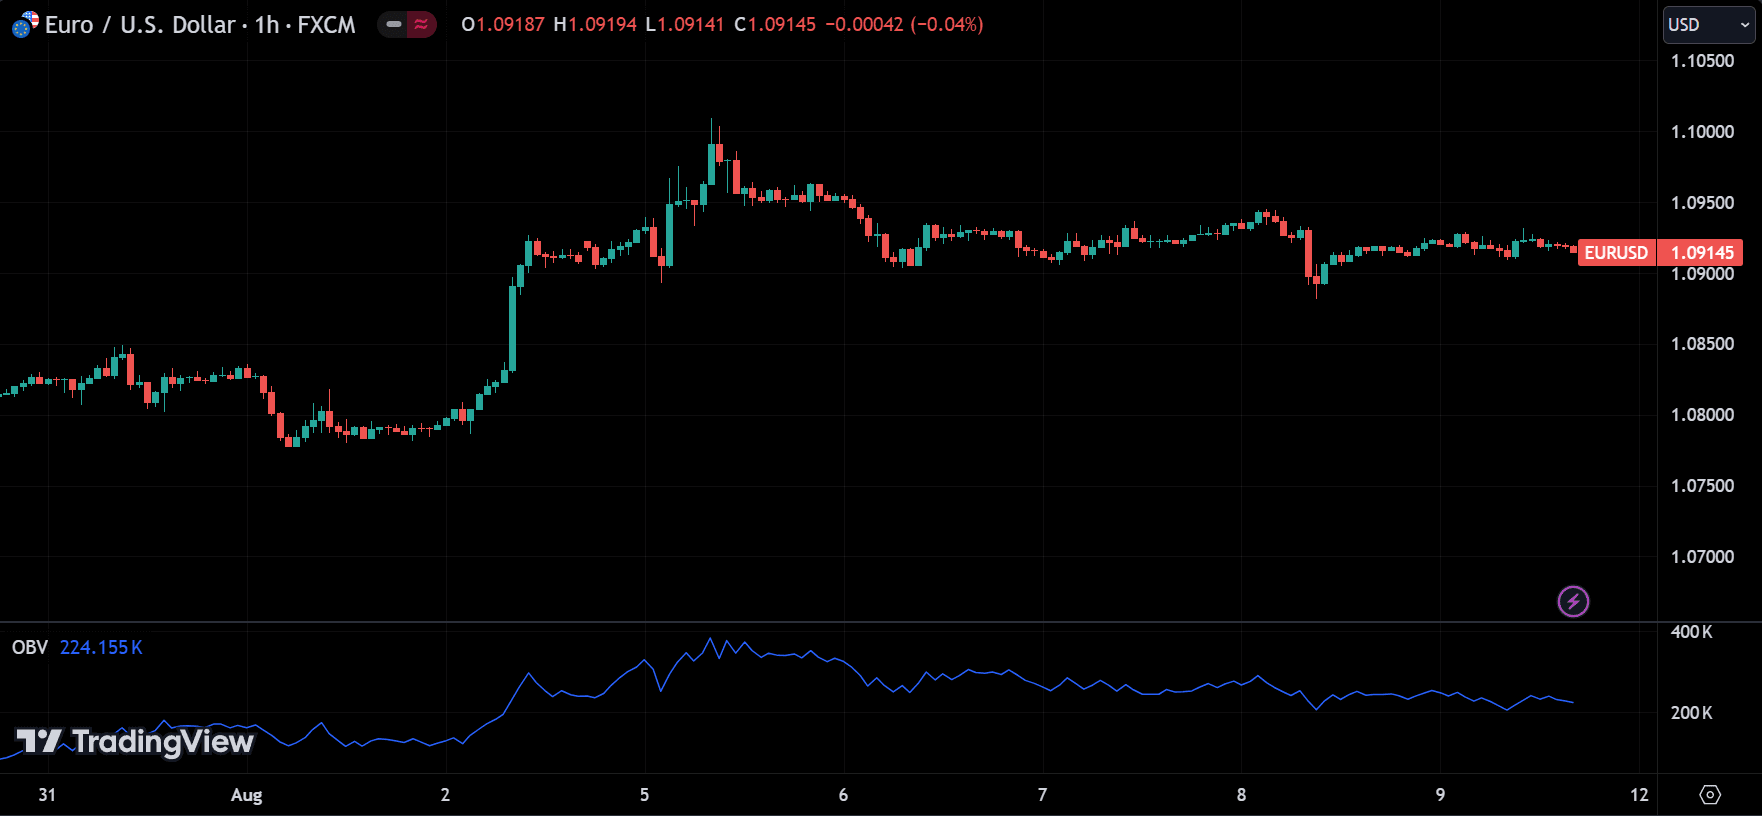
- On-Balance Volume (OBV): The OBV measures the cumulative buying and selling pressure by adding volume on up days and subtracting it on down days. It helps traders confirm trends and potential reversals.
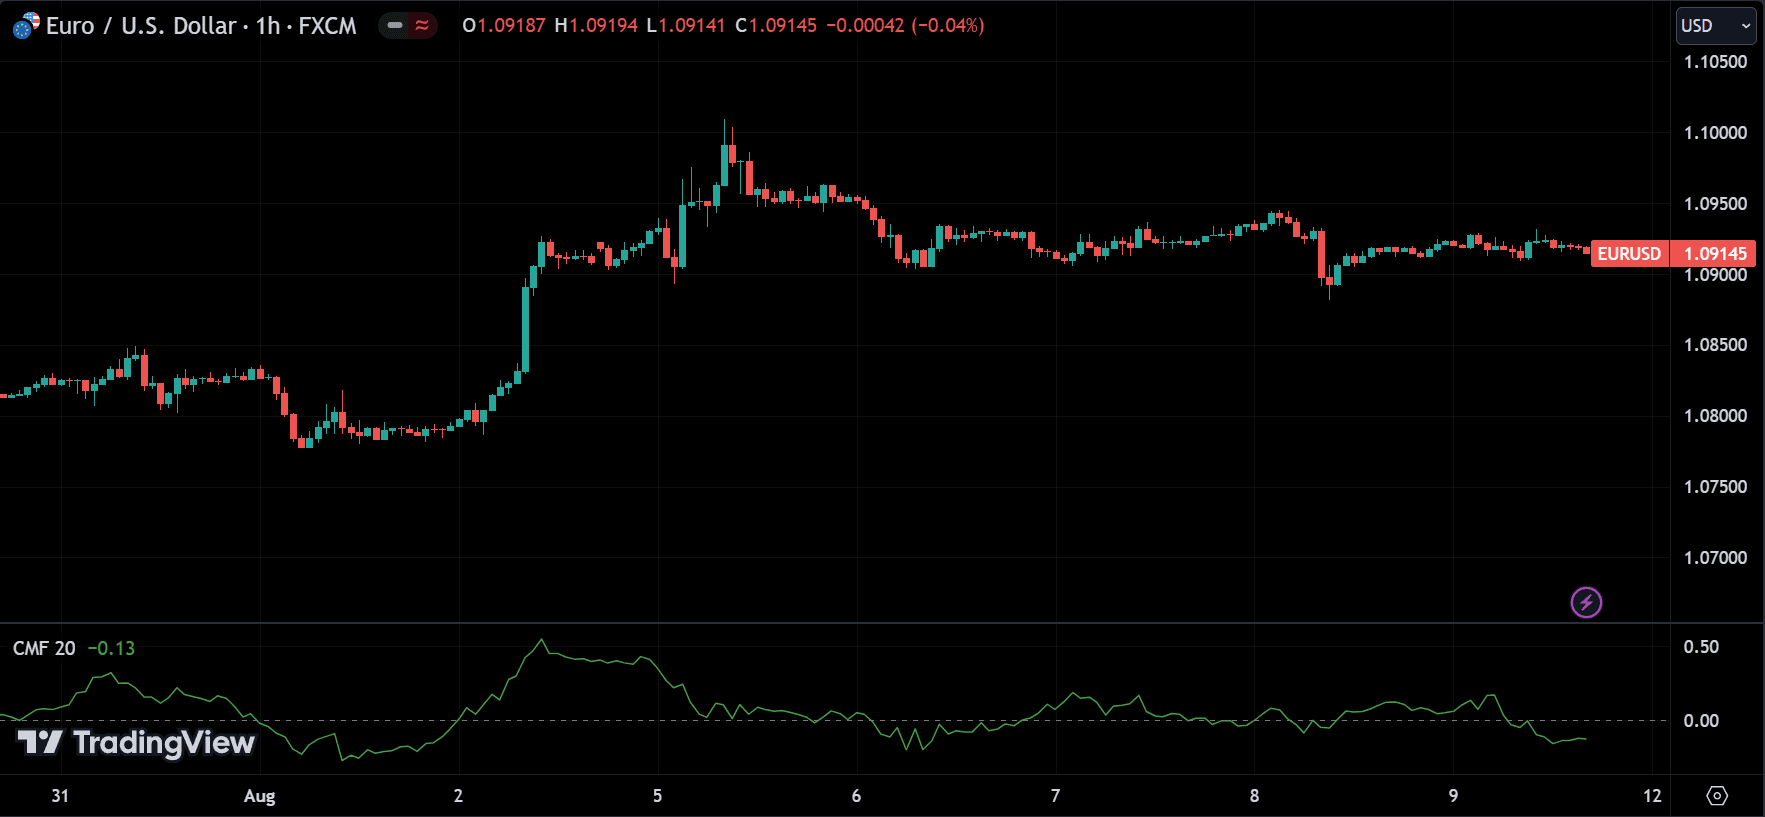
- Chaikin Money Flow (CMF): The CMF calculates the accumulation or distribution of money in a currency pair over a specific period, providing insights into buying and selling pressure.
Support and Resistance Indicators
Support and resistance indicators help traders identify key price levels where a currency pair is likely to reverse direction. These levels act as psychological barriers in the market. Some of the widely used support and resistance indicators include:
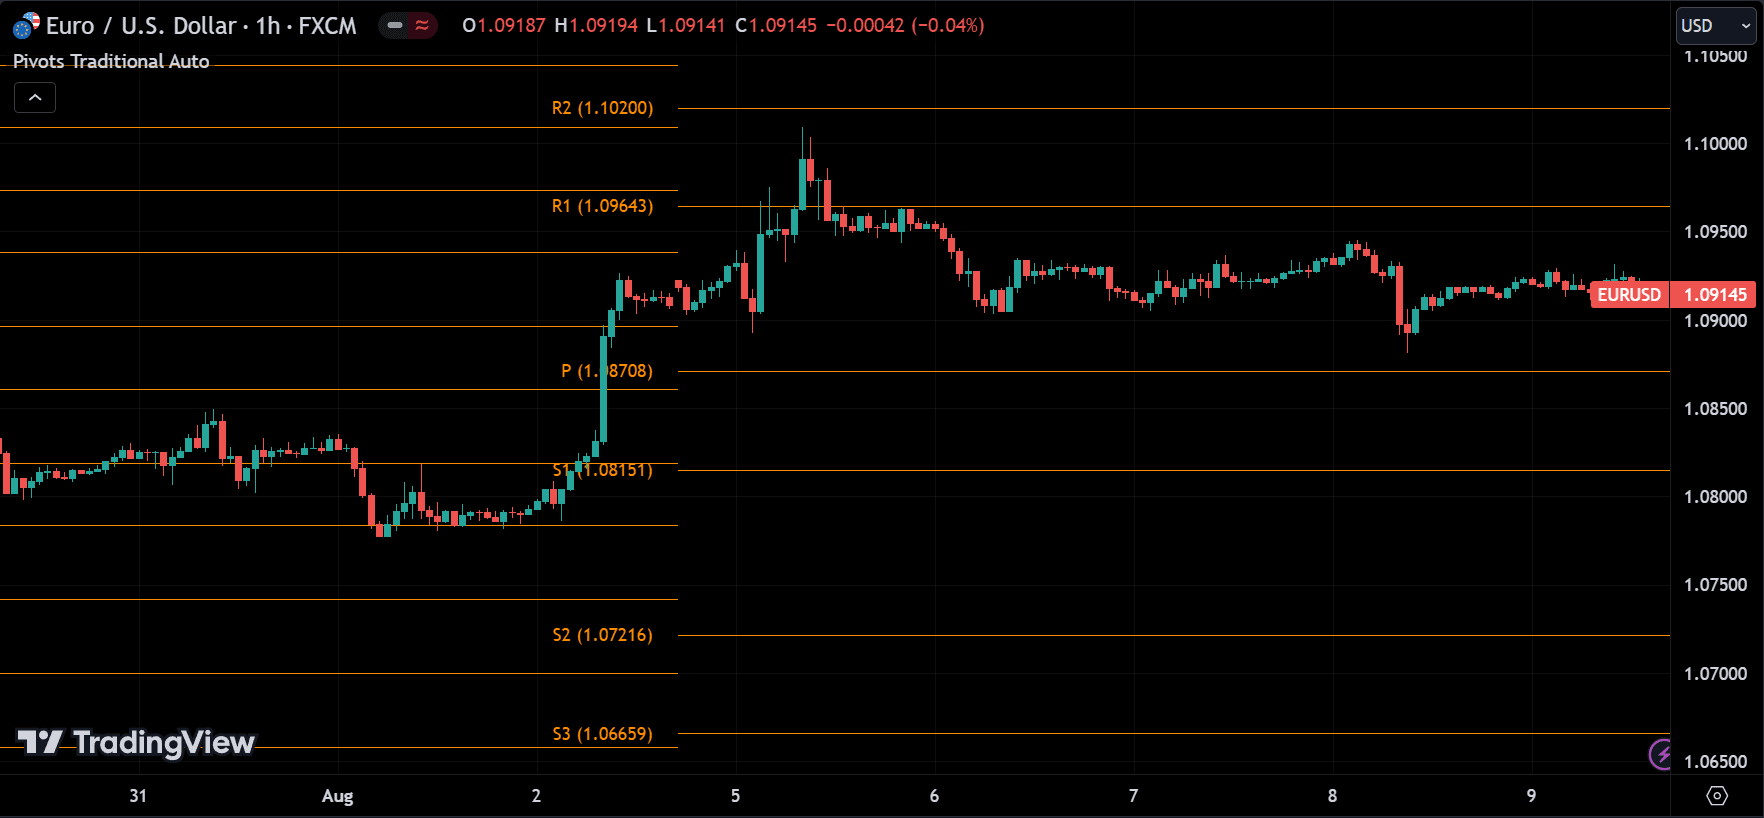
- Pivot Points: Pivot points are calculated based on the previous day’s high, low, and closing prices. They help traders identify potential support and resistance levels for the current trading day.
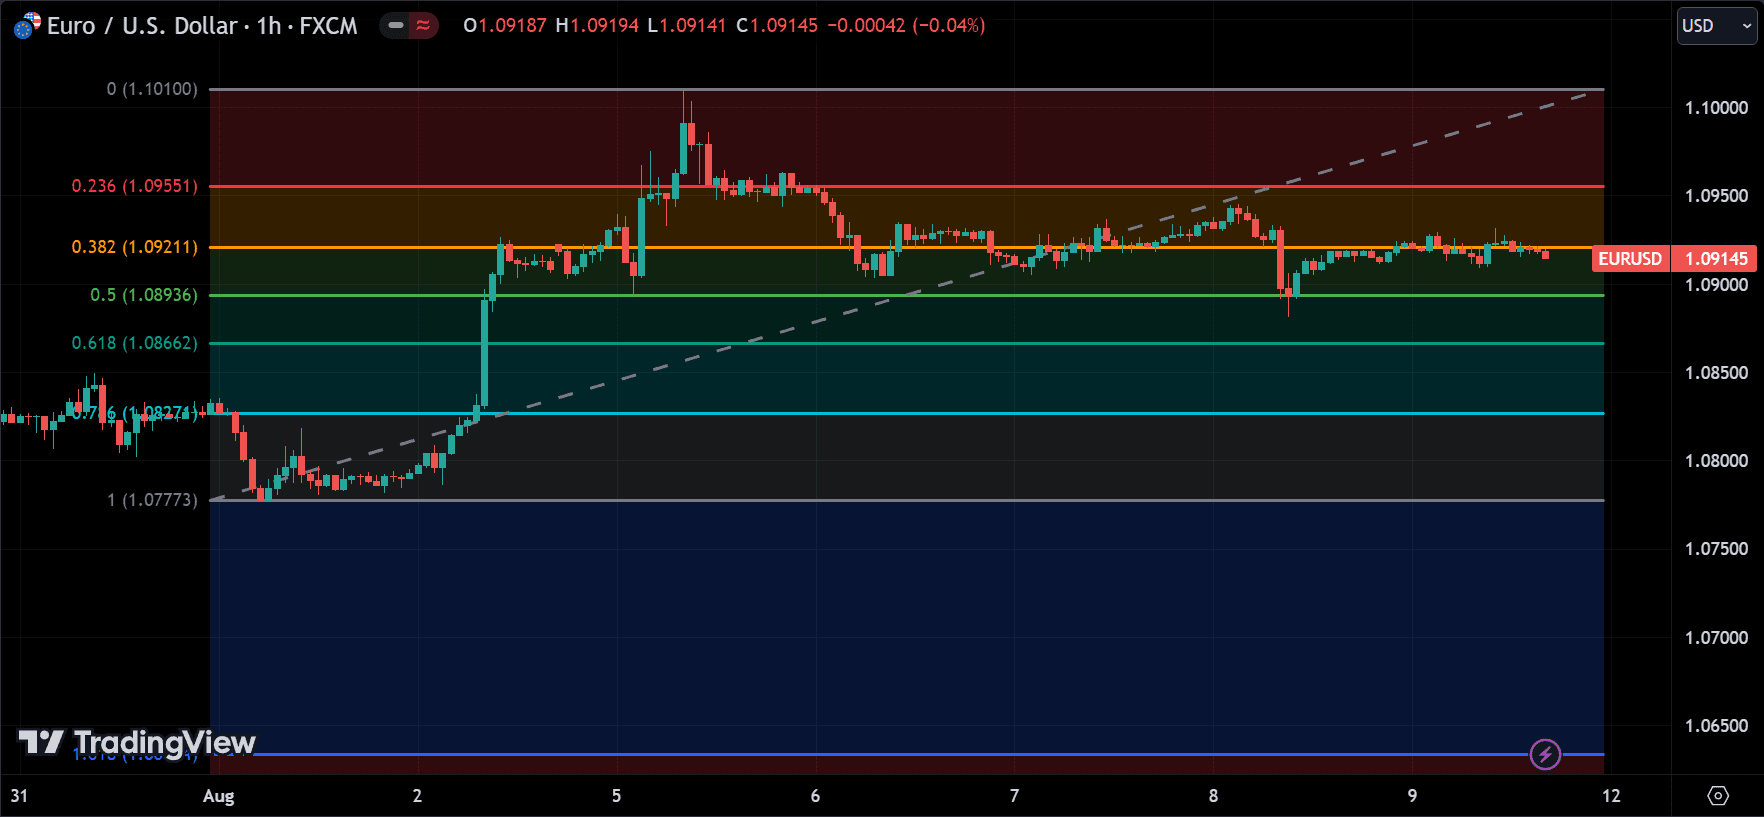
- Fibonacci Retracements: Fibonacci retracements use horizontal lines to indicate areas of support or resistance at the key Fibonacci levels before the price continues in the original direction.
How Technical Indicators Work?
Technical indicators work by applying mathematical formulas to historical price and volume data. The output is then plotted on a chart, either as lines, histograms, or overlays on the price chart.
Here’s how some popular indicators function:
- Moving Averages (MA): Moving averages calculate the average price over a specific period, smoothing out short-term fluctuations and highlighting the overall trend. The simple moving average (SMA) and exponential moving average (EMA) are the two most common types.
- MACD (Moving Average Convergence Divergence): The MACD is derived by subtracting the 26-period EMA from the 12-period EMA. The resulting line is the MACD line, which is plotted alongside a signal line (9-period EMA of the MACD line) and a histogram that shows the difference between the two.
- RSI (Relative Strength Index): The RSI compares the magnitude of recent gains to recent losses to determine overbought or oversold conditions. A reading above 70 suggests that the currency pair may be overbought, while a reading below 30 suggests it may be oversold.
- Bollinger Bands: Bollinger Bands consist of a middle band (SMA) and two outer bands (standard deviations). When the price moves close to the upper band, it may indicate overbought conditions, while a move near the lower band may indicate oversold conditions.
How to Use Technical Indicators in Forex Trading?
Using technical indicators effectively requires a strategic approach. Here are some key tips to make the best of it:
Combining Indicators
Relying on a single indicator can lead to false signals. Many traders combine multiple indicators to confirm trading signals. For example, a trader might use the RSI to assess market momentum and combine it with moving averages to determine the trend direction. The key is to use complementary indicators that provide different types of information.
Adjusting Indicator Settings
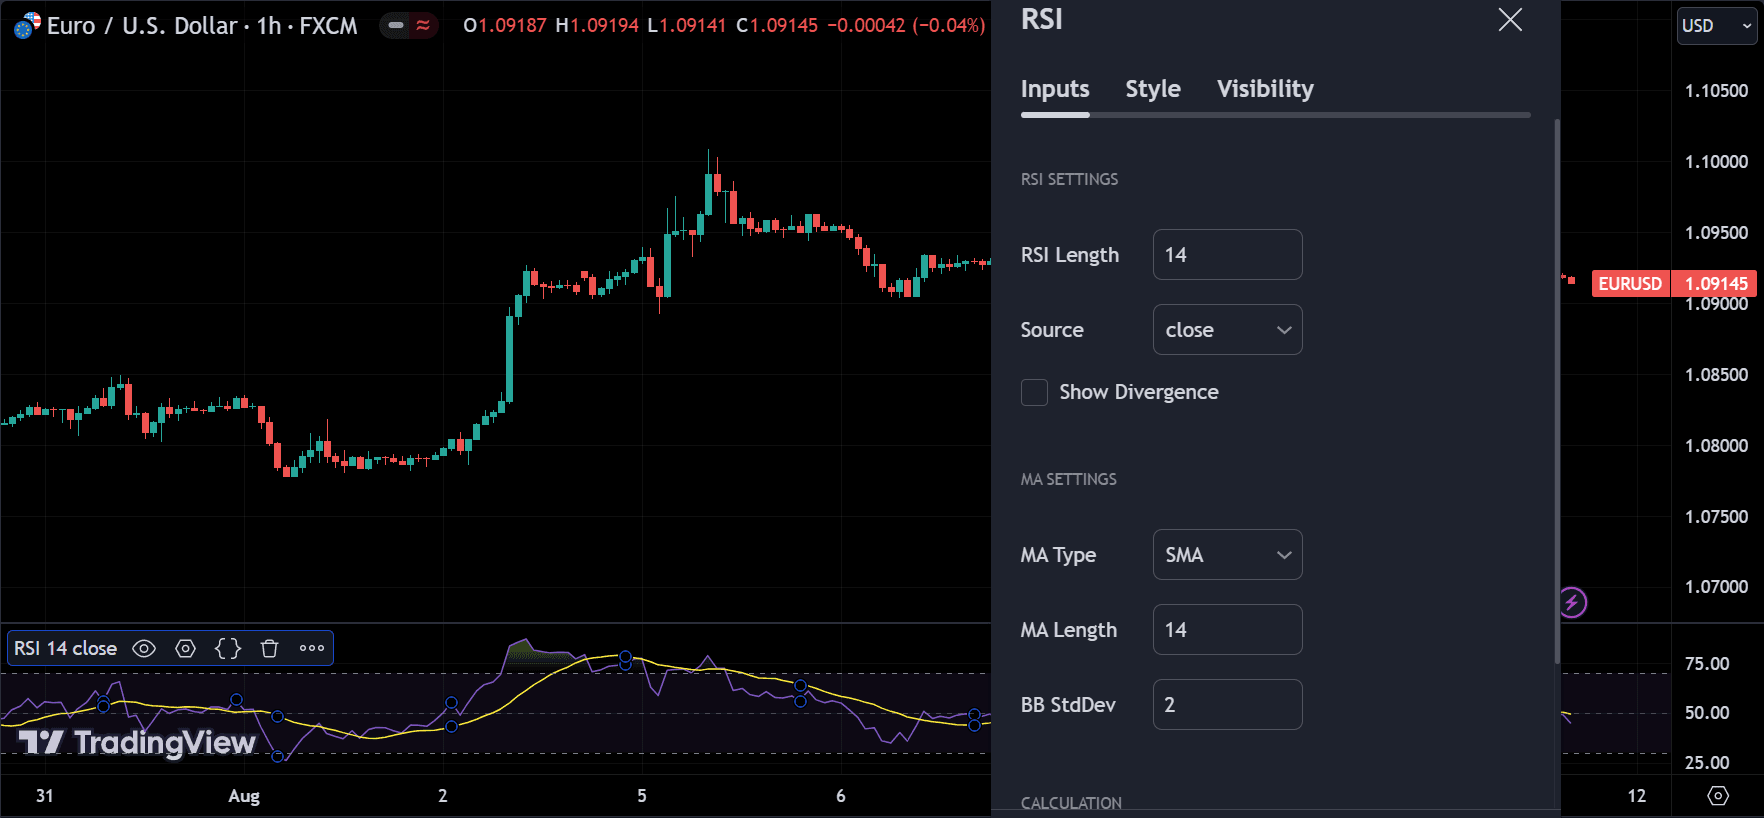
Most technical indicators come with default settings, but these can be adjusted to suit different trading styles and timeframes. For instance, short-term traders might prefer using a 14-period RSI, while long-term traders might opt for a 50-period RSI. It’s important to test different settings to find what works best for your trading strategy.
Backtesting and Forward Testing
Before using an indicator in live trading, it’s crucial to backtest it on historical data to see how it would have performed. Backtesting allows you to identify the best settings and understand the potential risks and rewards. Forward testing, or testing in real-time market conditions, is also essential to validate the indicator’s effectiveness.
Avoiding Over-Reliance on Indicators
While technical indicators are powerful tools, they should not be relied upon exclusively. Market conditions can change rapidly, and indicators may give false signals, especially in volatile or sideways markets. It’s essential to combine technical analysis with other forms of analysis, such as fundamental analysis and market sentiment, to make well-rounded trading decisions.
Common Pitfalls in Using Technical Indicators
Despite their benefits, technical indicators have their limitations. Here are some common pitfalls to be aware of:
- Lagging Indicators: Many indicators, such as moving averages, are lagging indicators, meaning they are based on past data and may not accurately predict future price movements. This can result in late entry or exit points.
- False Signals: Indicators can sometimes produce false signals, especially in volatile or sideways markets. Traders must be cautious and use additional methods, such as confirmation from other indicators, to validate signals.
- Overfitting: Over-adjusting indicator settings to fit historical data can lead to overfitting, where the indicator performs well in backtesting but poorly in live trading. It’s important to strike a balance between sensitivity and reliability.
Conclusion
Technical indicators are essential tools in the arsenal of forex traders, providing valuable insights into market trends, momentum, volatility, and potential support and resistance levels. However, they are not foolproof and should be used in conjunction with other analysis methods to make informed trading decisions. By understanding how these indicators work and applying them judiciously, traders can improve their chances of success in the forex market.
Remember, the key to effective forex trading lies in continuous learning, practice, and adapting to ever-changing market conditions. No single indicator guarantees success, but with the right combination of tools and strategies, you can confidently navigate the forex market.