
Price Action Forex Trading Strategies represent one of the most effective and purest forms of technical analysis in the Forex market. Instead of relying on lagging indicators or complex algorithms, price action traders analyze raw market data, focusing on the open, high, low, and close prices to make informed trading decisions. By studying the patterns and structures formed on the price chart, traders can interpret market sentiment and anticipate future price movements with greater accuracy.
What makes Price Action Forex Trading Strategies so powerful is their ability to simplify the market, stripping away unnecessary noise and focusing solely on price behavior. These strategies revolve around key trading principles such as market psychology, supply and demand dynamics, support and resistance levels, and candlestick patterns. Because price action reflects the collective actions of buyers and sellers, it provides deep insights into market trends, momentum shifts, and potential reversals.
In this comprehensive guide, we will break down everything you need to know about mastering Price Action Forex Trading Strategies from identifying market structure and key levels to implementing high-probability trading setups. Whether you are a beginner or an experienced trader, understanding these strategies can help you refine your approach, enhance your decision-making, and ultimately, achieve consistent profits in Forex trading.
Table of Contents
Why Choose Price Action Over Indicator Based Trading
Many Forex traders start with indicator based systems because they are relatively easy to set up. Indicators like Moving Averages, Relative Strength Index (RSI), and Bollinger Bands can provide signals for entering and exiting trades. However, there are key reasons why experienced traders often shift to price action:
- Simplicity – Price action does not require a cluttered chart filled with multiple indicators. Fewer distractions can help traders focus on key levels and momentum.
- Timeliness – Indicators are often lagging, which means they might give signals after the price has already moved substantially. Price action relies on real-time data (the price itself), enabling more timely decision-making.
- Better Market Insight – Price action traders learn to read the “story” behind the candlesticks, who is in control: buyers or sellers? This understanding can help anticipate shifts in momentum before they are obvious on standard indicators.
- Adaptability – Markets evolve. An indicator-based strategy may lose its edge if market conditions shift. Price action strategies adapt more fluidly because they are based on current price behavior, not historical calculation alone.
- Flexibility Across Timeframes – Price action methods are equally applicable to scalpers (trading on the 1-minute or 5-minute charts), swing traders (trading on the 4-hour or daily charts), and everything in between.
Core Principles of Price Action
Price action trading is built upon several core principles that can guide your analysis:
- Market Psychology – Prices move as a result of supply and demand imbalances. When buyers are in control, the price moves up; when sellers are in control, the price moves down. Price action helps you visualize this dynamic through candlesticks and patterns.
- Support and Resistance – Past price levels where the market has shown reactions (bounced, reversed, or consolidated) are likely to be important levels in the future. Price action traders closely observe these horizontal zones to look for trading opportunities.
- Trend Analysis – The market can only move up, down, or sideways. Recognizing the direction of the trend helps you align trades with the prevailing momentum, thus improving your odds of success.
- Candlestick Patterns – Individual and multi-candlestick formations can provide insights into immediate market psychology. For instance, a “pin bar” might suggest a reversal, while an “engulfing bar” might signal a strong shift in sentiment.
- Volume (If Available) – Although Forex does not have centralized volume data like the stock market, some platforms provide volume indications based on tick activity. Volume can sometimes confirm the strength of a price move. (In equities or futures markets, volume plays a crucial role, but in Forex, it may not be as definitive.)
- Risk Management – Successful price action trading isn’t just about picking the right entries and exits; it’s also about protecting your capital through appropriate position sizing, stop-loss placement, and profit-taking strategies.
Market Structure and Trends
Before placing any trade, a price action trader needs to identify the overarching market structure. Essentially, you need to answer these questions:
- Is the market in an uptrend (series of higher highs and higher lows)?
- Is the market in a downtrend (series of lower highs and lower lows)?
- Is the market ranging (price oscillating between a support level and a resistance level without forming strong trends)?
- Checkout Our list of Market Structure Indicators
Identifying an Uptrend
An uptrend occurs when the market forms higher highs (HH) and higher lows (HL). On a candlestick chart, you’ll see a stair-step pattern moving upward. This indicates that buyers are dominant and pushing the price higher over time.
Key features of an uptrend:
- Consistent bullish candlesticks
- Breakouts above prior swing highs
- Retracements typically find support at previous resistance zones
Identifying a Downtrend
A downtrend occurs when the market forms lower highs (LH) and lower lows (LL). On the chart, price steps downward, indicating that sellers are dominant and pushing the price lower over time.
Key features of a downtrend:
- Consistent bearish candlesticks
- Breakouts below prior swing lows
- Retracements typically find resistance at previous support zones
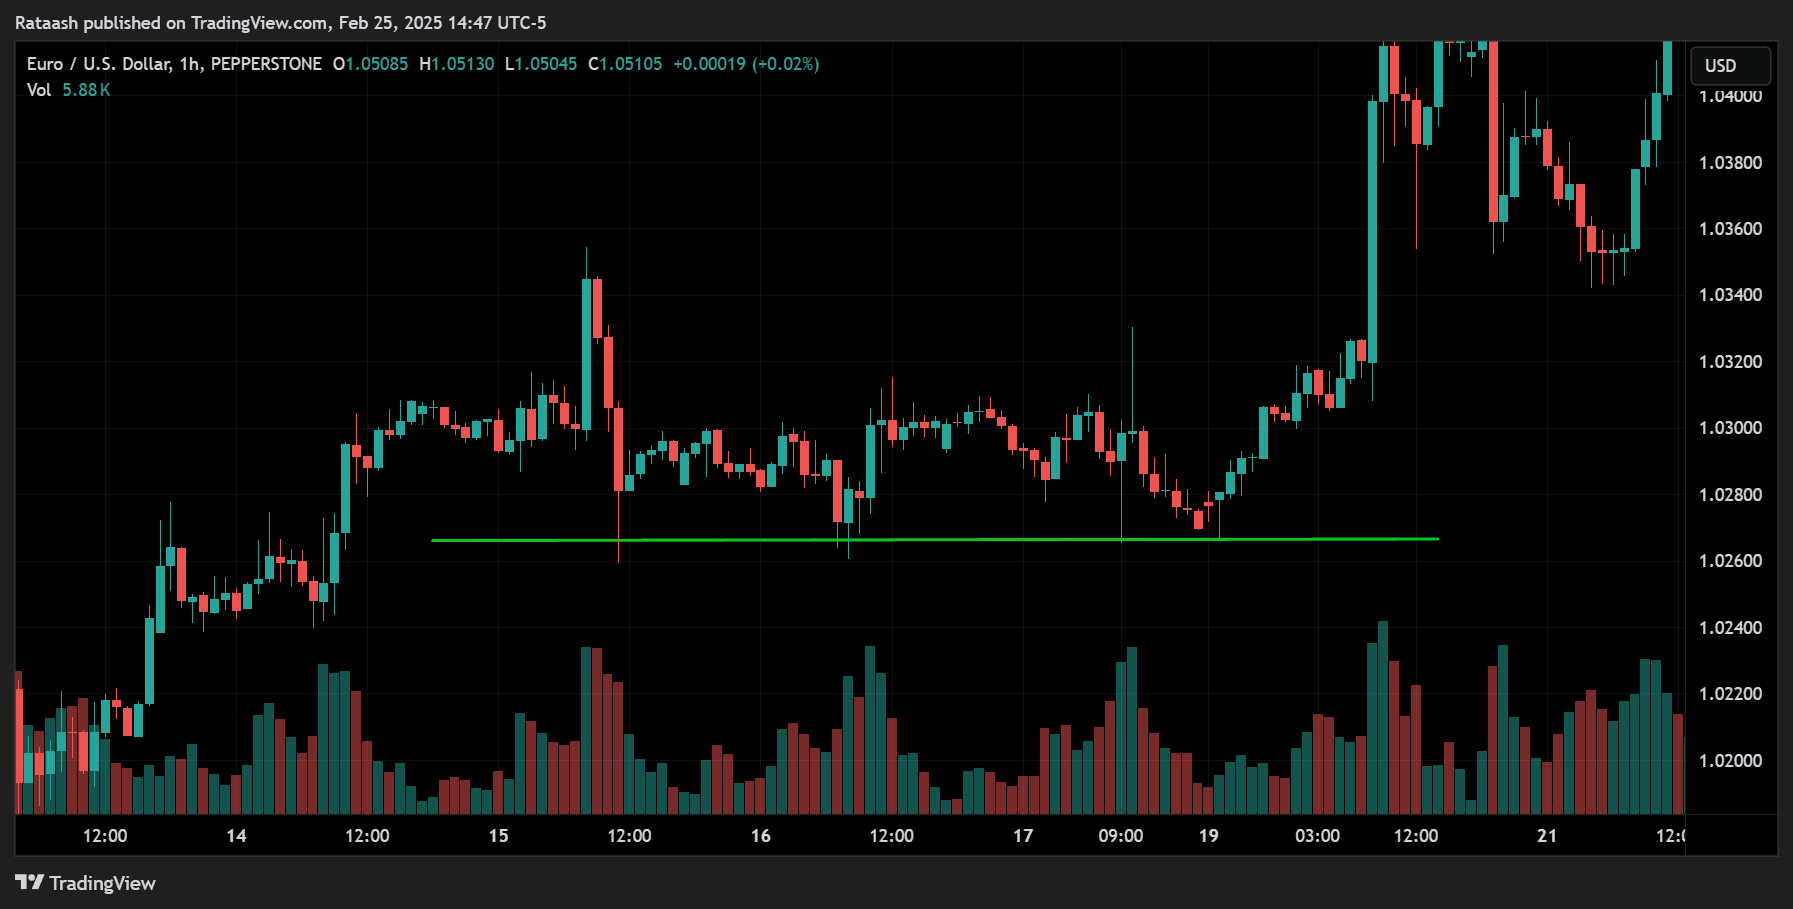
Identifying a Range (Sideways Market)
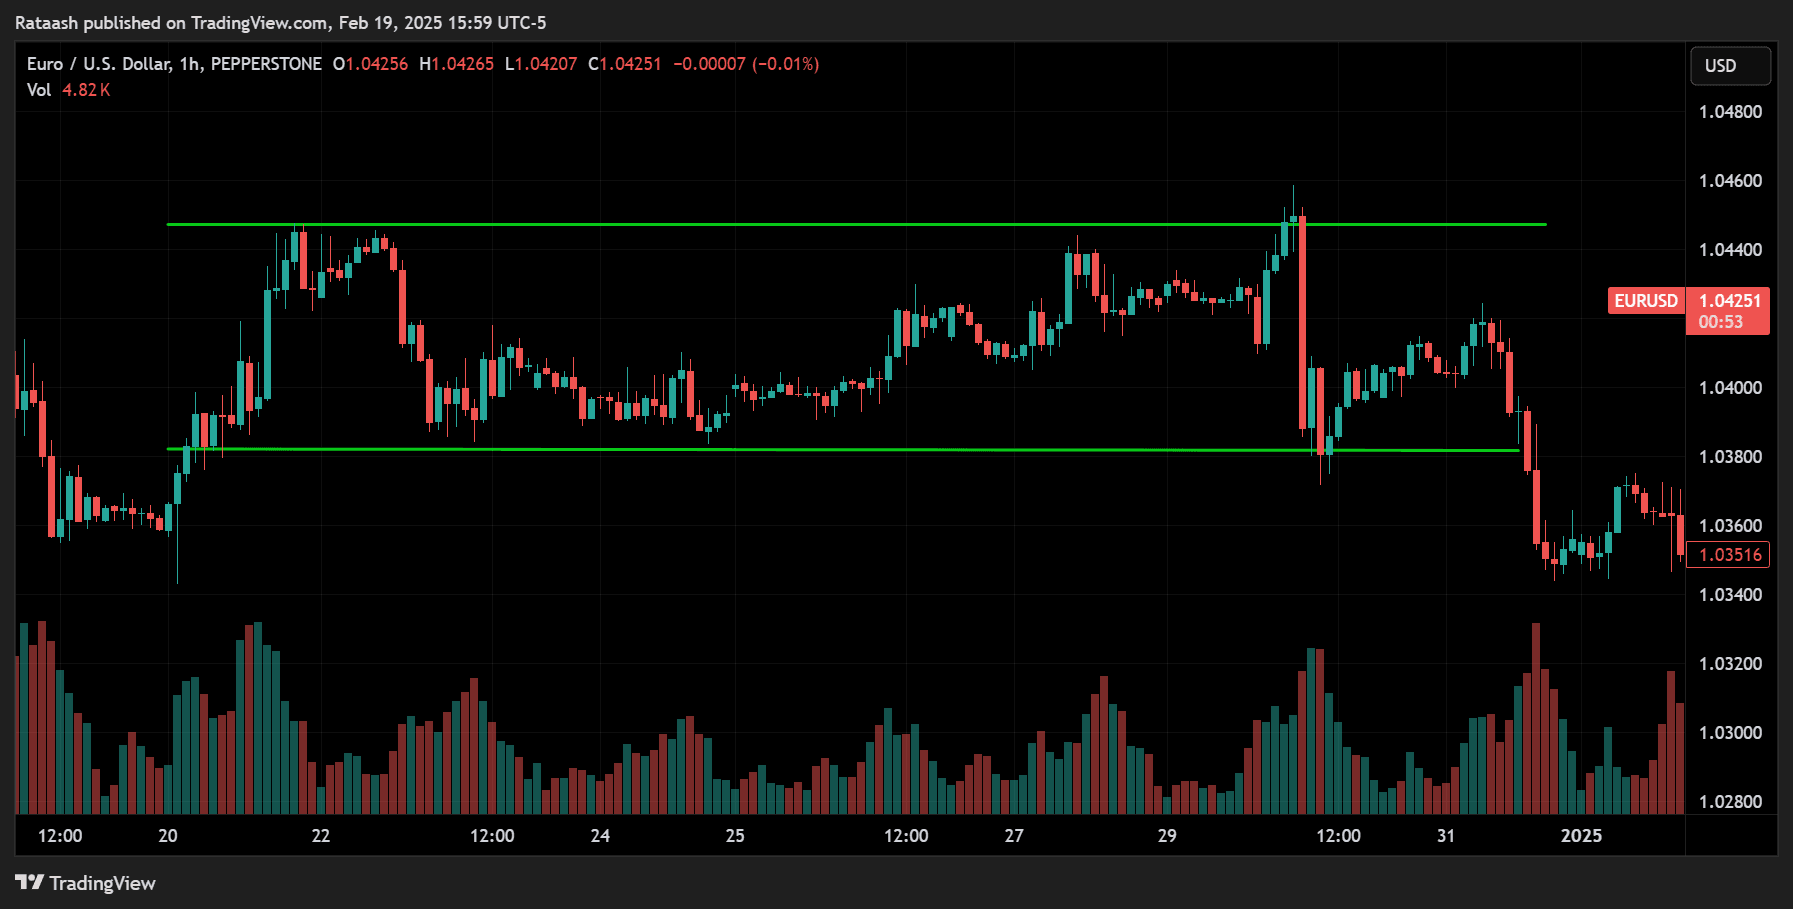
A range occurs when the price is moving horizontally between a well-defined support level and a resistance level. Neither buyers nor sellers have a clear advantage. Traders often refer to this as “consolidation” or a “choppy” market.
Key features of a range:
- Price bounces between horizontal support and resistance
- Lack of clear higher highs or lower lows
- Potential for a breakout when the price eventually exits the range
Why It Matters: Trading in line with market structure can significantly increase your probability of success. For instance, if you notice the market is forming higher highs and higher lows, you’ll look primarily for long (buy) setups in key areas of support.
Support and Resistance Explained
Support and resistance (S&R) levels are among the most foundational concepts in price action trading. They act as potential turning points in the market because they are levels where supply and demand imbalances have historically caused price shifts.
Support
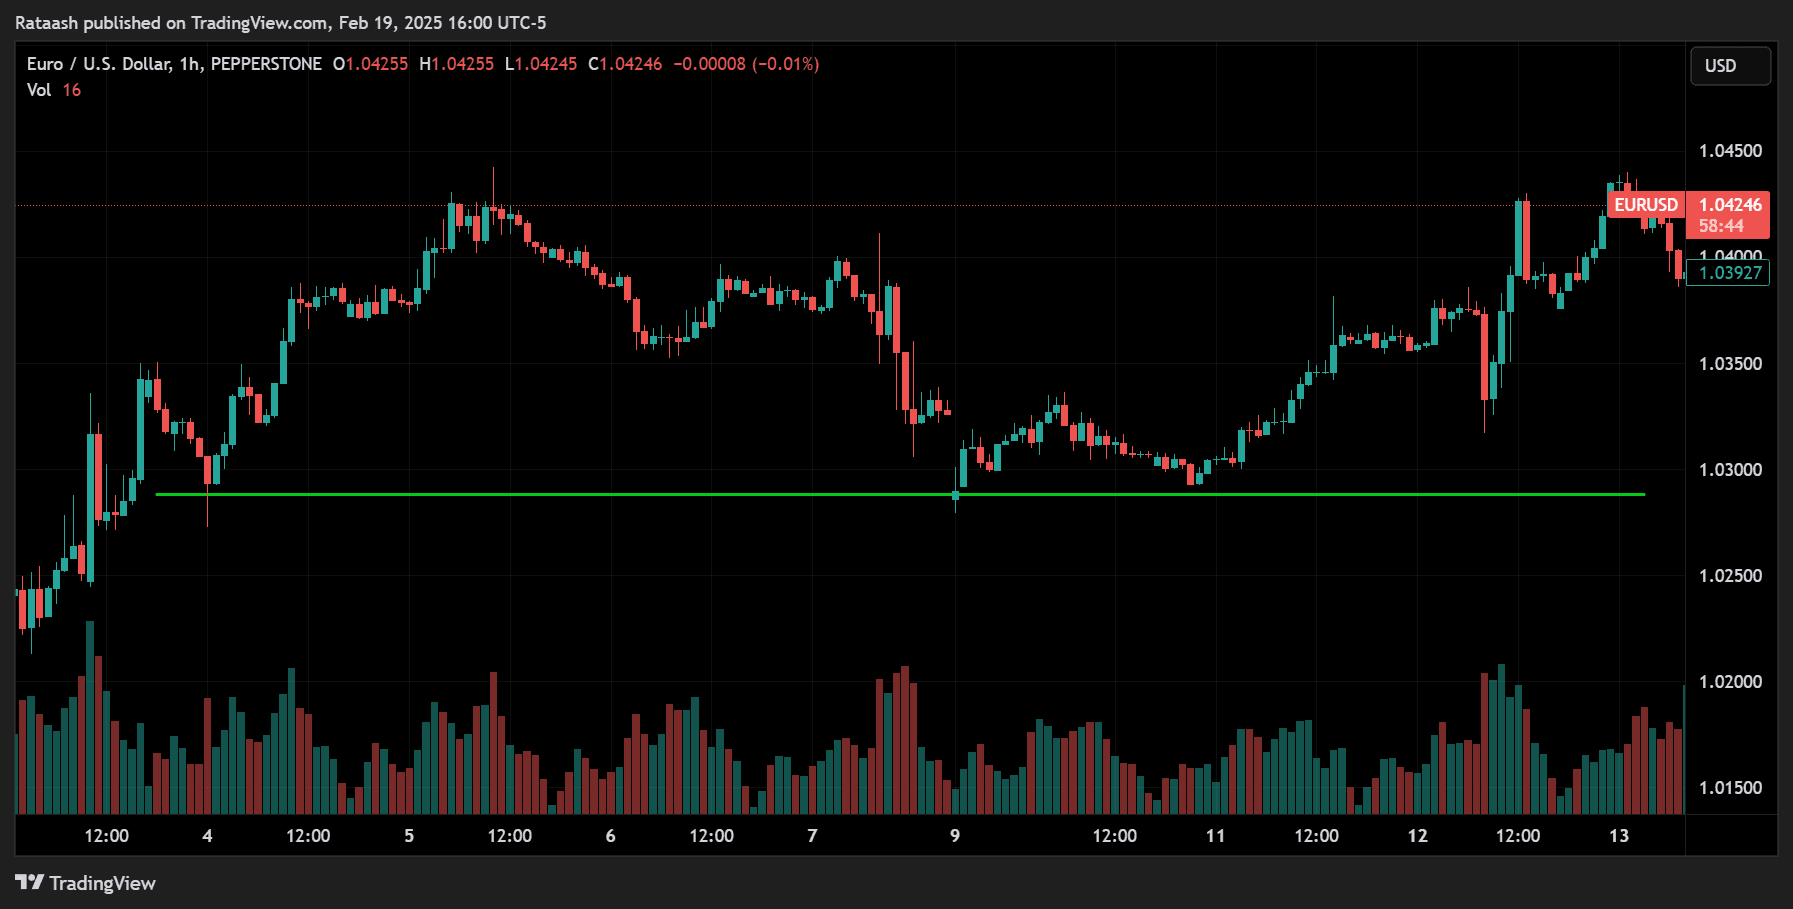
- Definition: A price level or zone where buying pressure has historically been strong enough to halt or reverse a downtrend.
- Identification: Look for areas on the chart where the price previously paused or reversed from a downward move.
- Example: If EUR/USD fell to 1.1000 multiple times and bounced back up, that area around 1.1000 can be considered strong support.
Resistance
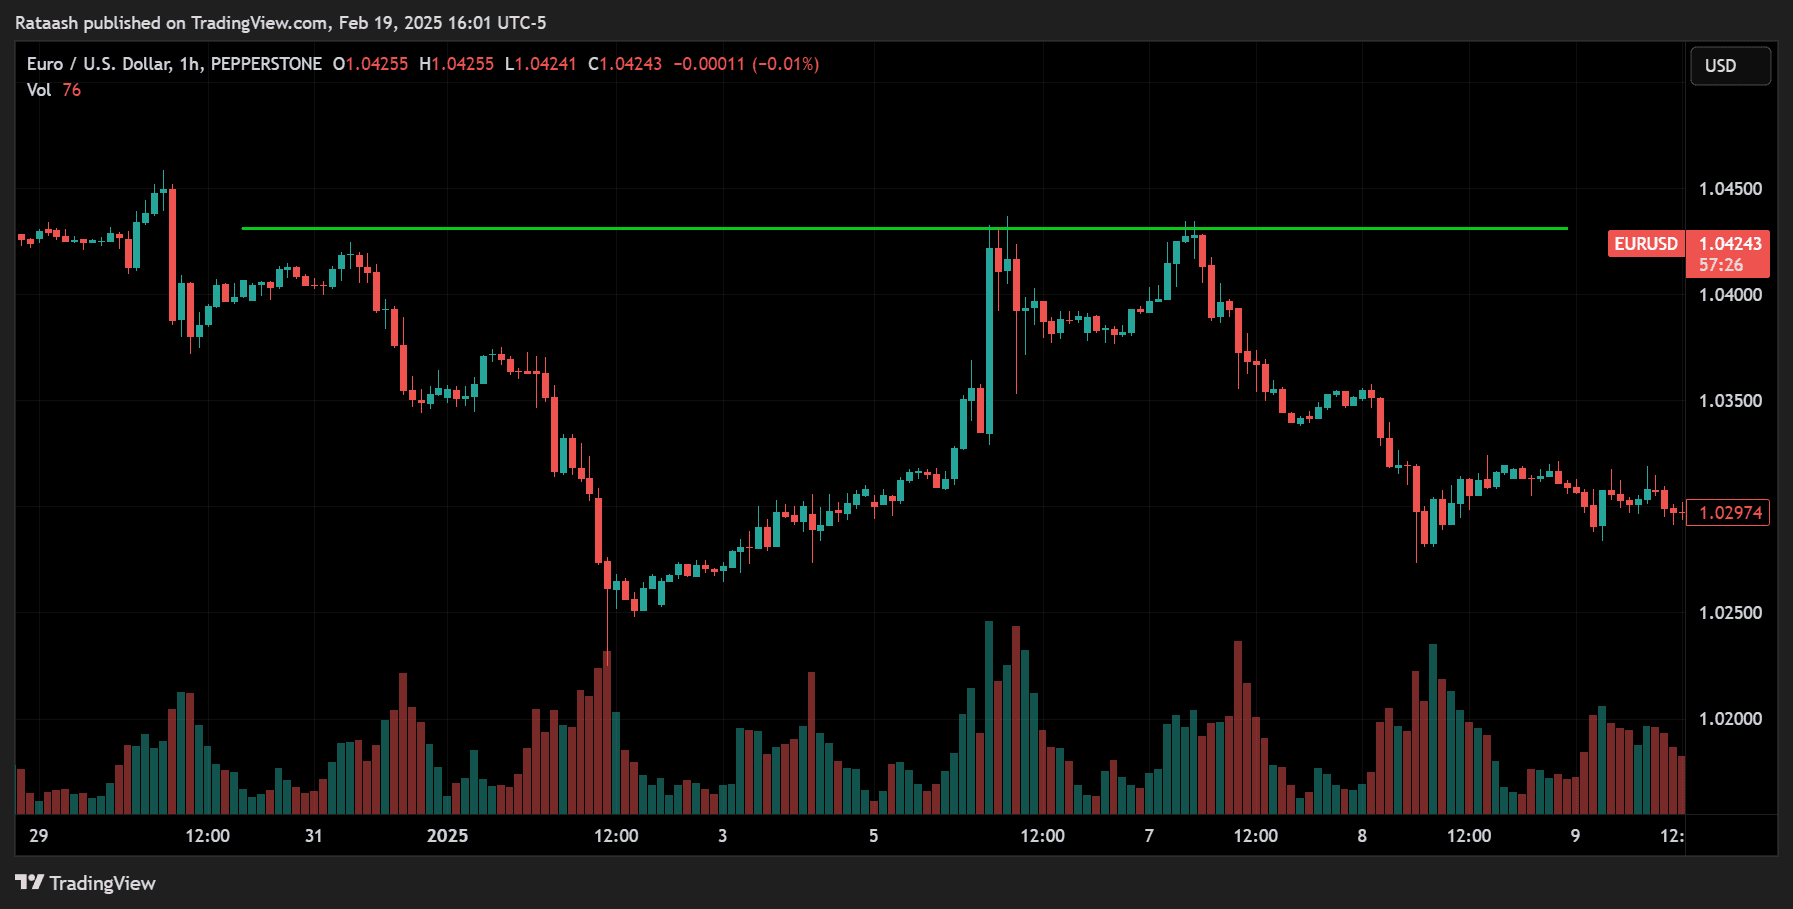
- Definition: A price level or zone where selling pressure has historically been strong enough to halt or reverse an uptrend.
- Identification: Look for areas on the chart where the price previously paused or reversed from an upward move.
- Example: If GBP/USD rallied to 1.2500 multiple times and fell back down, that area around 1.2500 can be considered strong resistance.
Psychological Support and Resistance
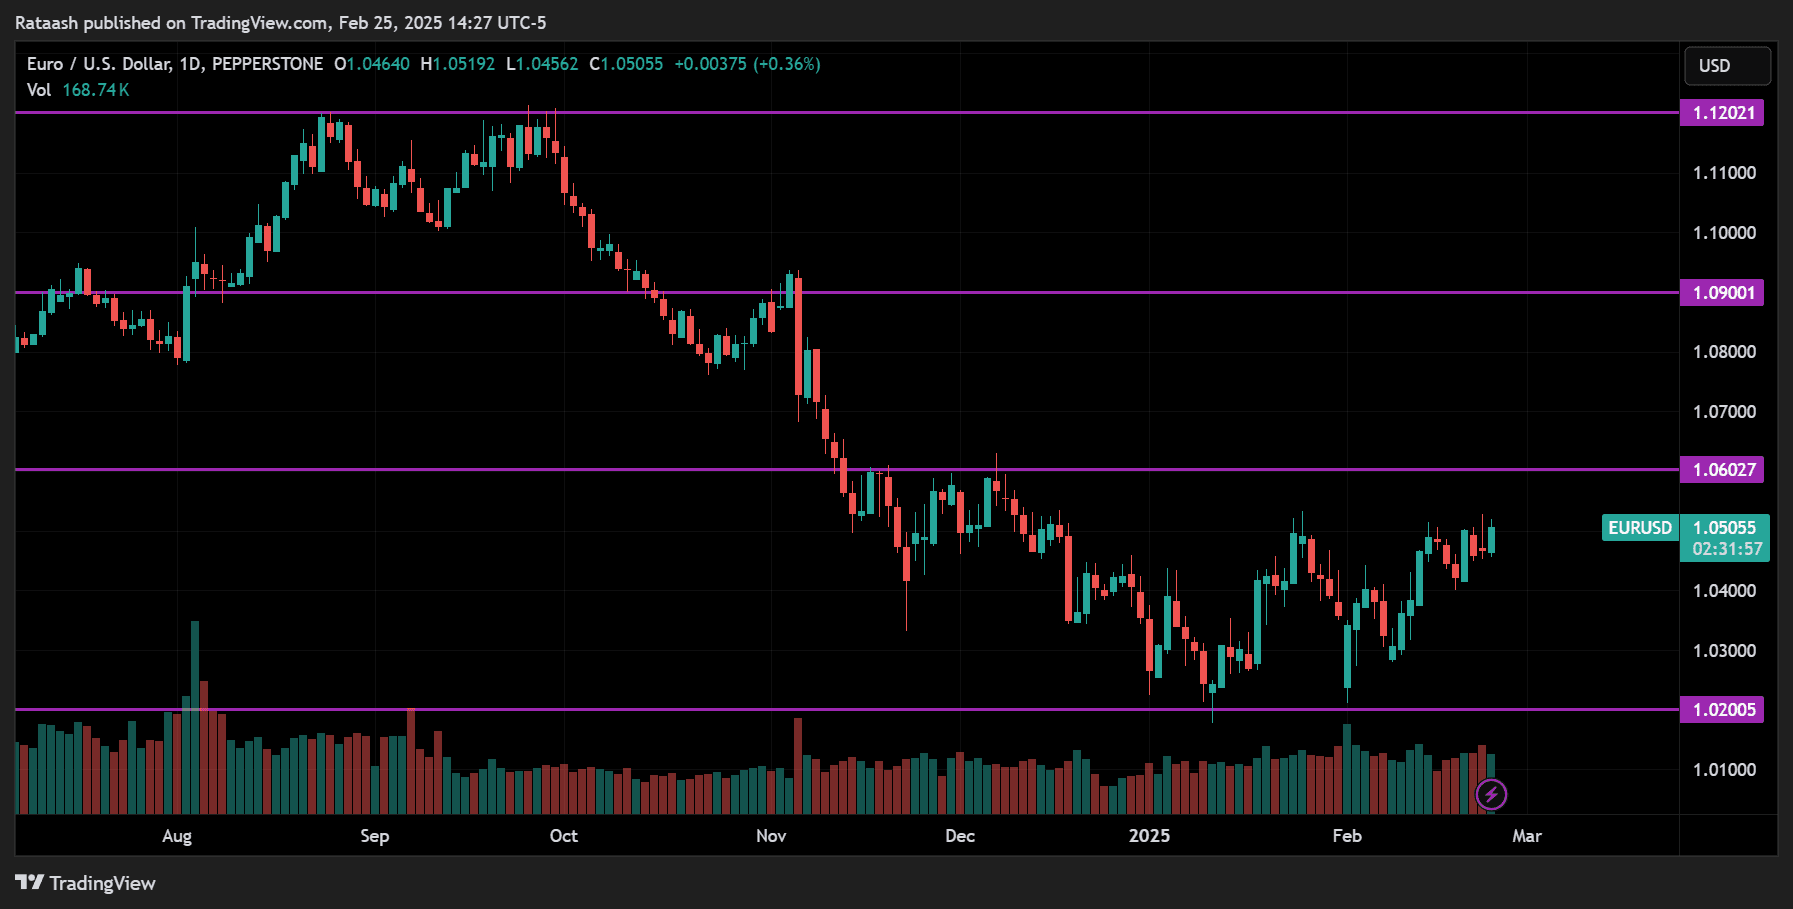
Key psychological levels—often round numbers such as 1.0000, 1.1000, 1.2000, etc.—may act as natural support or resistance because they are easily recognized by a large number of traders. For example, many traders will place stop-loss orders or take-profit orders around these round-number levels.
Candlestick Patterns – The Building Blocks of Price Action
Candlestick patterns reveal valuable insights into market sentiment. By understanding these patterns, you can get a better sense of who controls the market—buyers or sellers—and how strong the momentum is.
Single-Candlestick Patterns
Pin Bar (Hammer / Shooting Star)
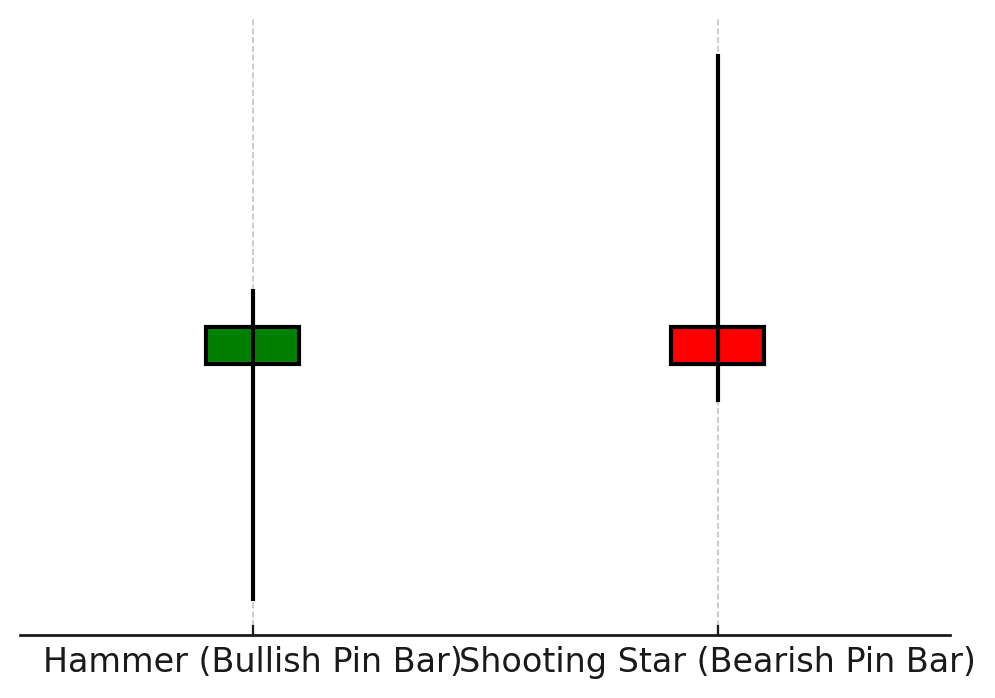
- Appearance – A candlestick with a small body and a long wick (tail) extending from one side.
- Interpretation – The wick indicates a rejection of price from a certain level. A pin bar at support (with a long lower wick) suggests bullish rejection, whereas a pin bar at resistance (with a long upper wick) suggests bearish rejection.
- Example – If EUR/USD forms a pin bar off a key support level, it might indicate a potential reversal to the upside.
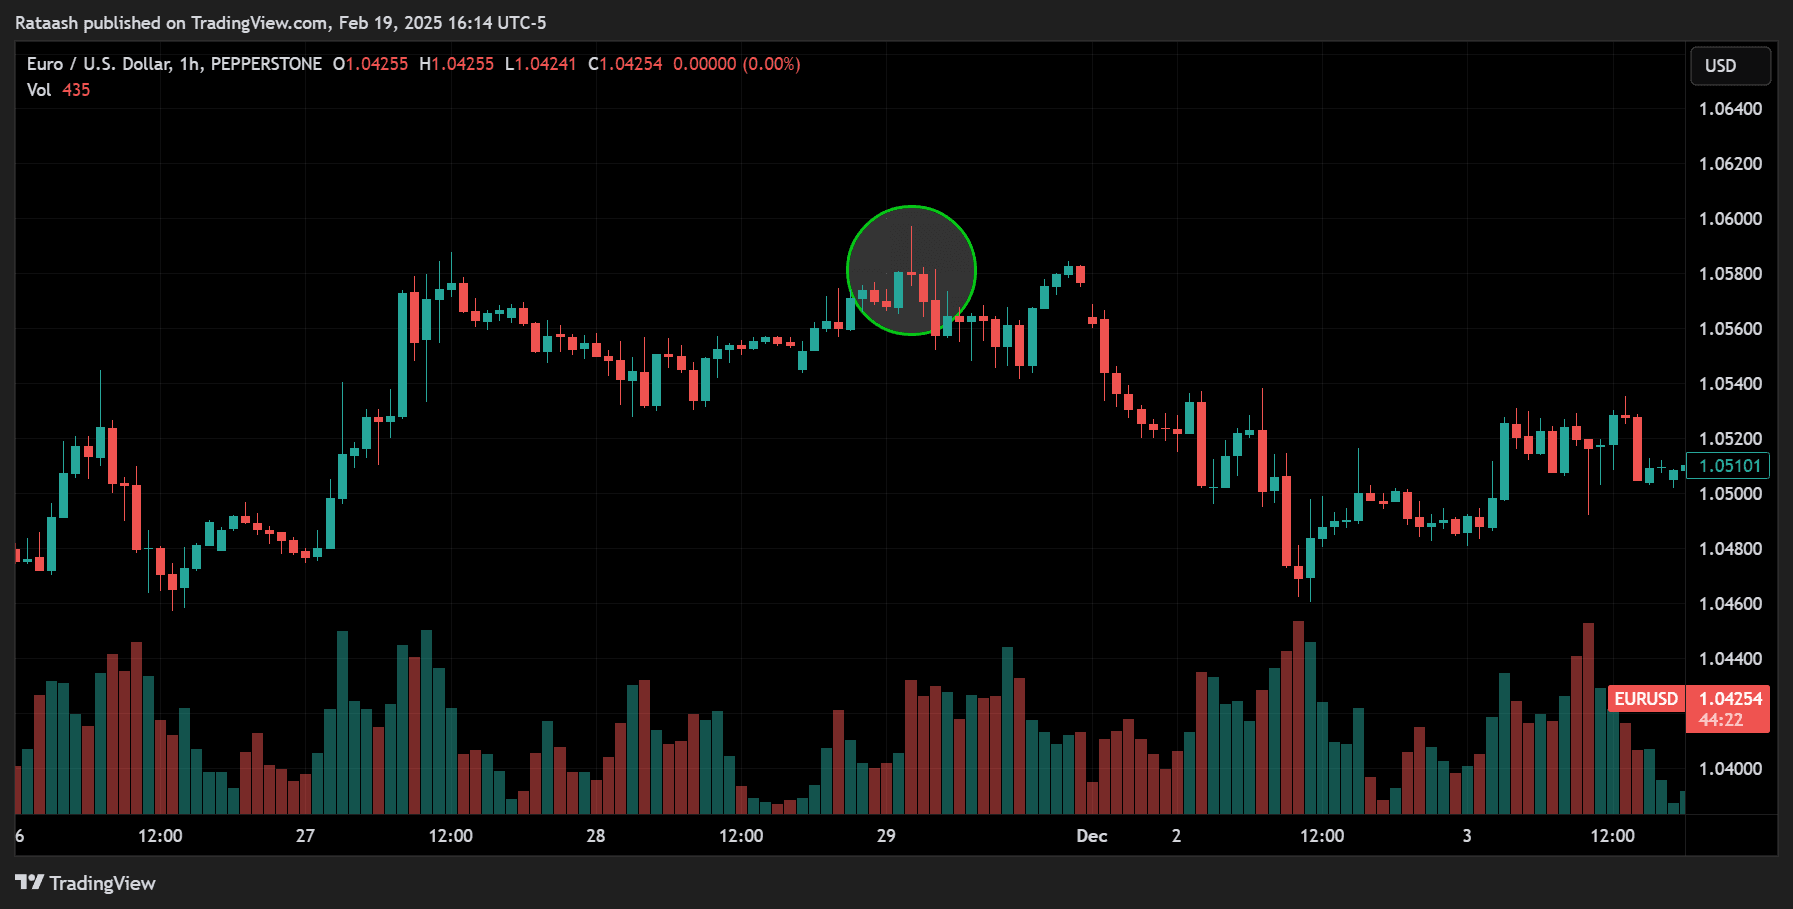
Doji
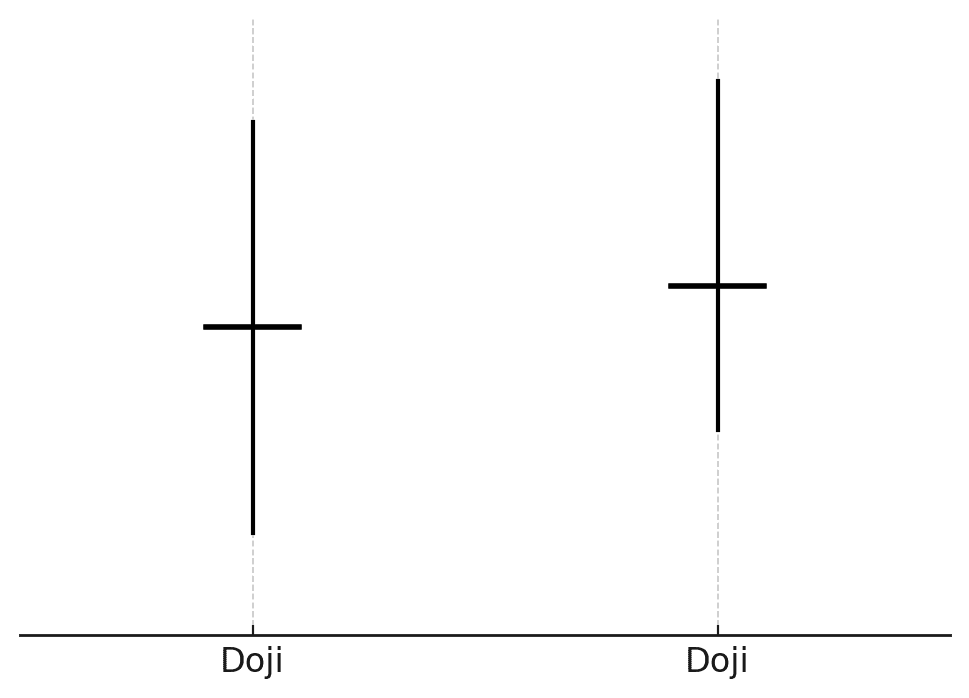
- Appearance – The open and close are nearly the same, creating a candlestick with little to no real body.
- Interpretation – Indicates indecision in the market. The buyers and sellers are at an equilibrium. A doji at a key level can signal a potential reversal if confirmed by subsequent price action.
- Example – A doji at the top of a strong uptrend could hint that buying momentum is weakening.
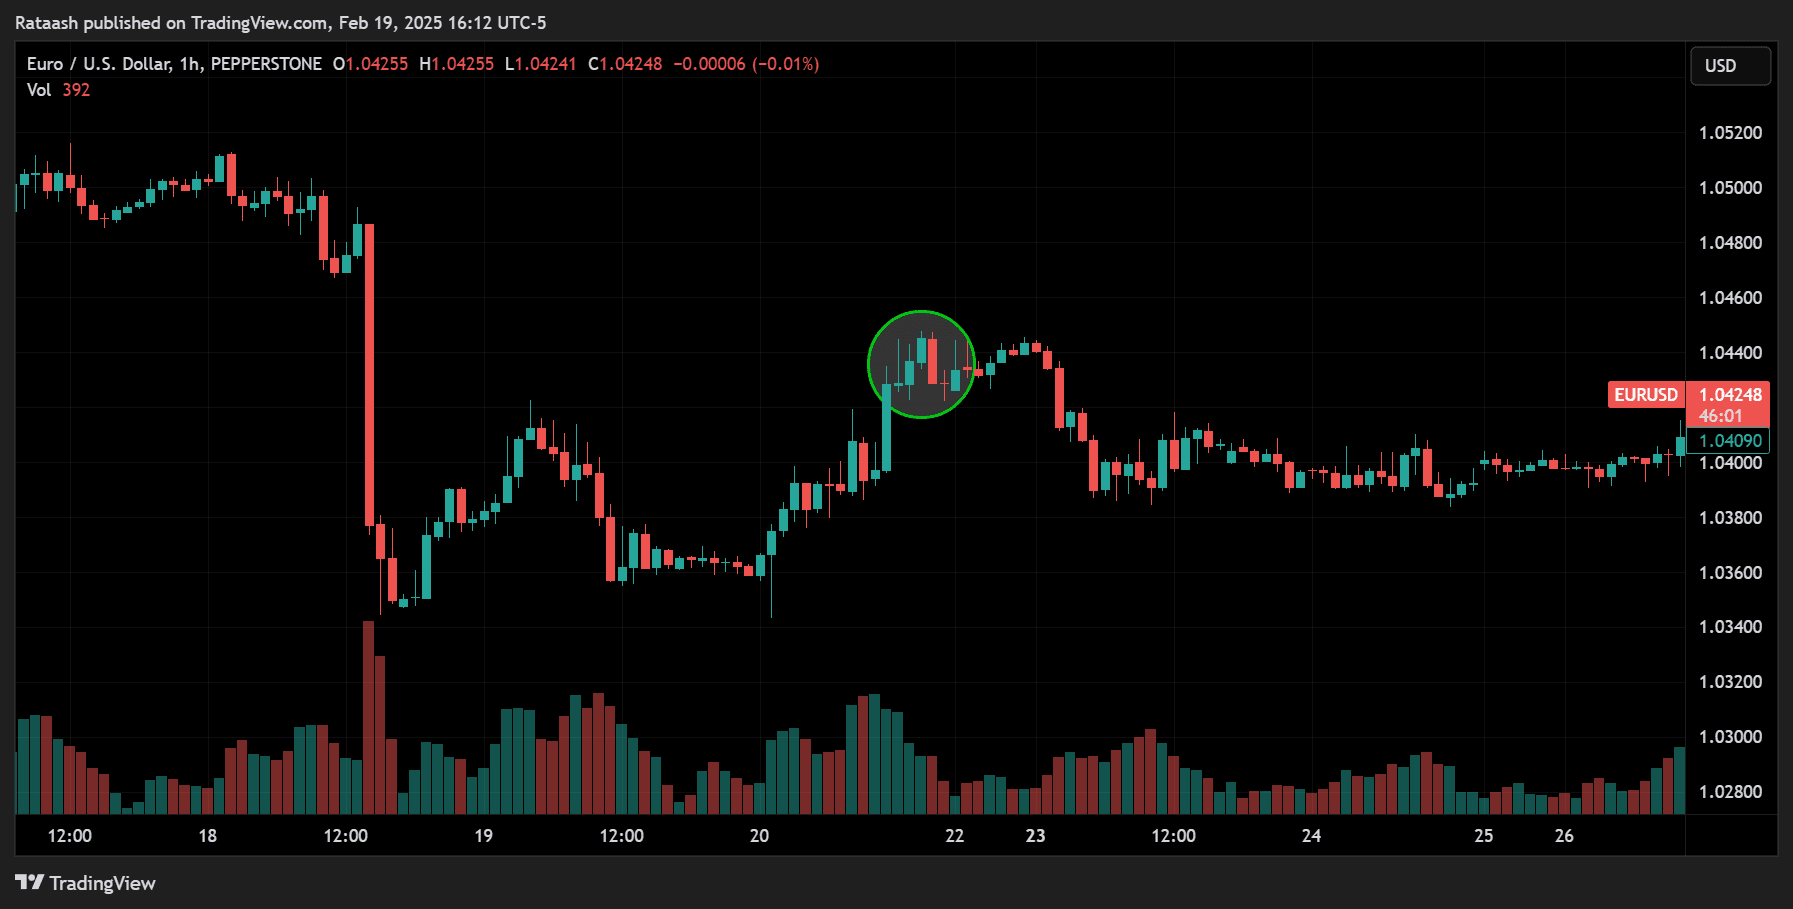
Marubozu
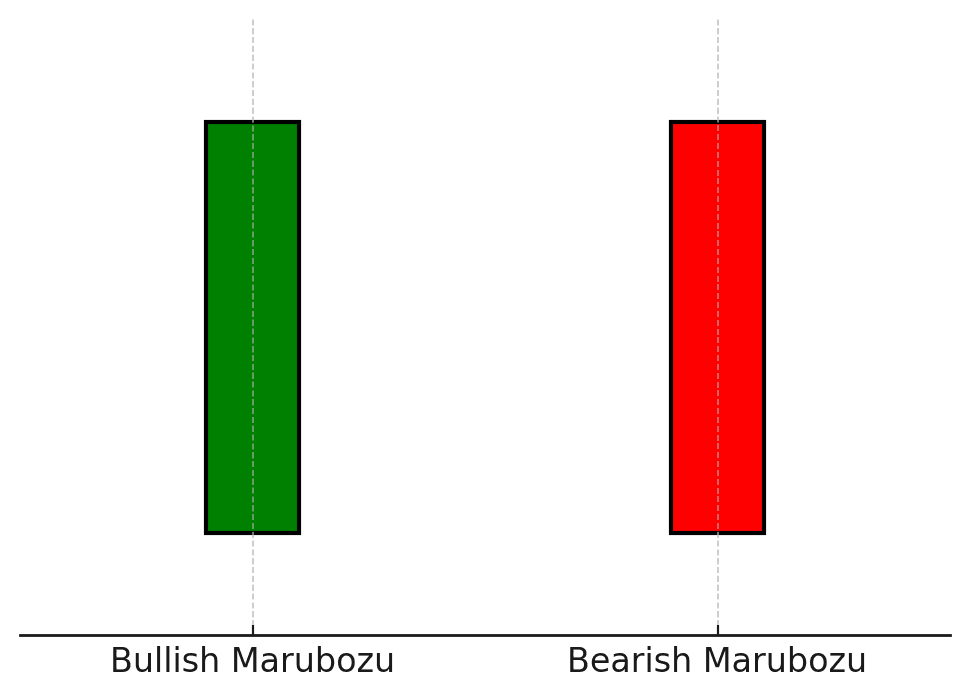
- Appearance – A candlestick with no wicks (or very small wicks), so the candlestick’s open and close are at or near the extremes of its range.
- Interpretation – A strong expression of momentum (either bullish or bearish). If it’s a bullish marubozu, buyers dominated the session. If it’s a bearish marubozu, sellers were firmly in control.
- Example – A bullish marubozu breaking above resistance might suggest a strong breakout.
Multiple-Candlestick Patterns
Engulfing Bars (Bullish/Bearish)
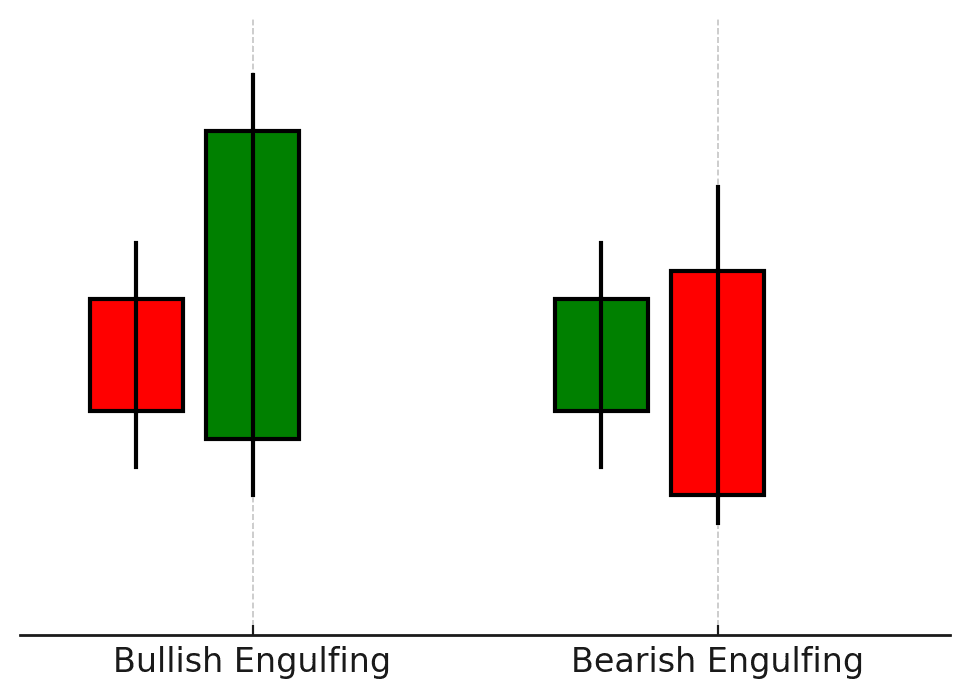
- Appearance – A candlestick that completely “engulfs” the previous candlestick’s range. A bullish engulfing bar opens below and closes above the prior bar. A bearish engulfing bar opens above and closes below the prior bar.
- Interpretation – Strong shift in momentum. A bullish engulfing bar indicates buyers have taken control from sellers, while a bearish engulfing bar indicates sellers have taken control from buyers.
- Example – If USD/JPY was in a small downtrend and you suddenly see a bullish engulfing candle at a key support, it may signal a reversal to the upside.
Inside Bar
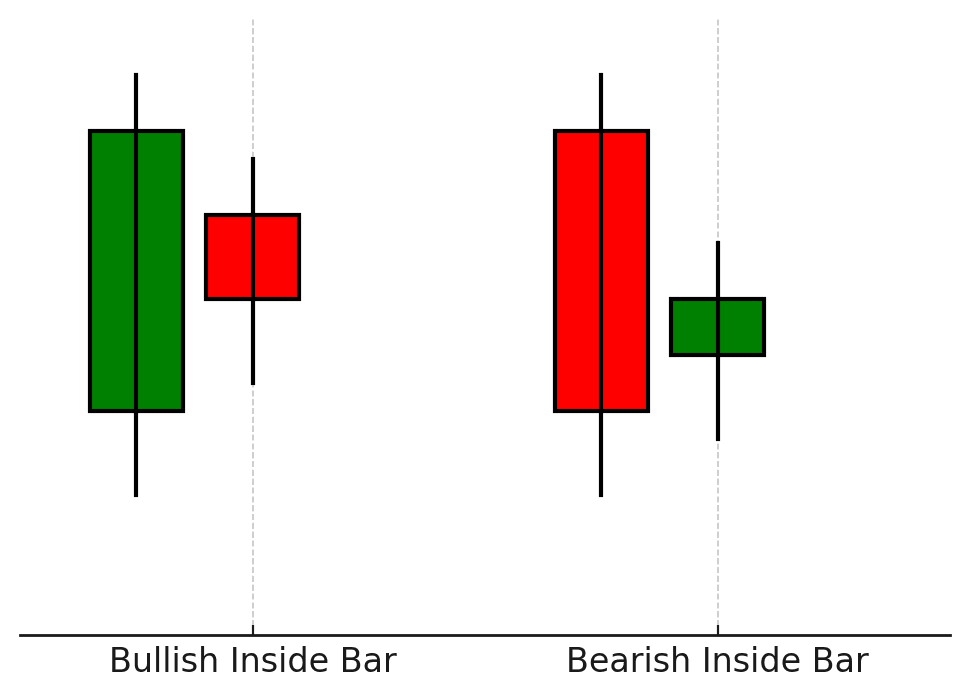
- Appearance – A candlestick whose high and low are completely “inside” the range of the previous candlestick.
- Interpretation – A period of consolidation or indecision. Traders often wait for a breakout of the inside bar’s range to determine the direction of the next move.
- Example – An inside bar forming after a strong upward move could mean the market is pausing before continuing the trend or reversing.
Harami
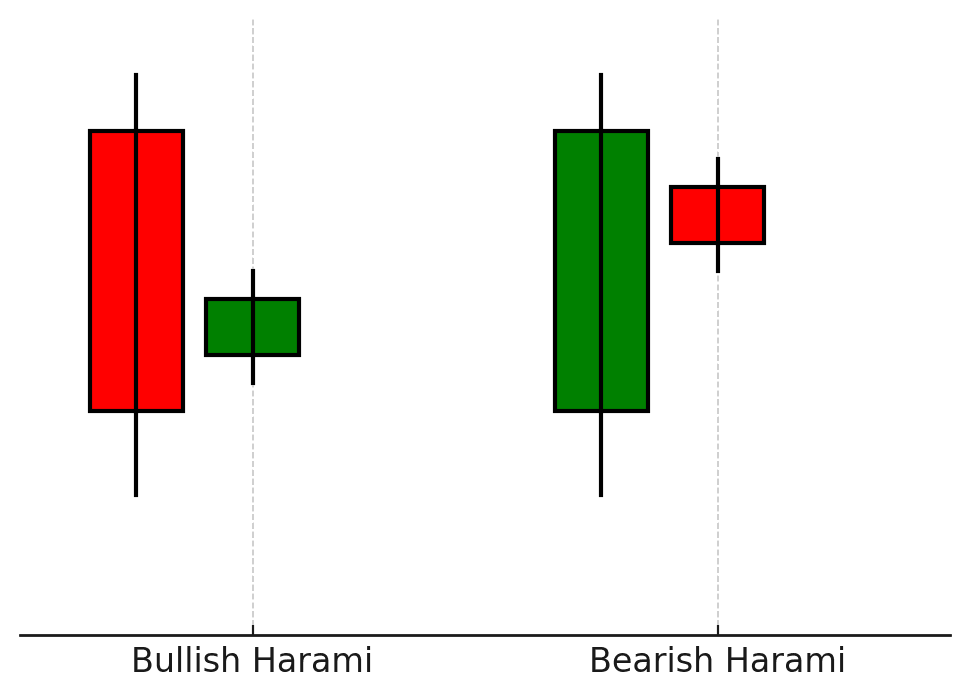
- Appearance – Similar to an inside bar, but typically the real body of the second candlestick is smaller and contained within the real body of the previous candlestick.
- Interpretation – Potential reversal or indecision. Confirmation is often needed from subsequent candlesticks or breaks of key levels.
- Example – A bearish harami near major resistance could warn of an upcoming downward move.
Chart Patterns and Their Significance
Chart patterns are broader formations of price action that span multiple candlesticks. They help traders identify potential trend reversals or continuations.
Reversal Patterns
Head and Shoulders / Inverse Head and Shoulders
- Appearance – Three peaks, with the middle peak (the “head”) being taller than the two side peaks (the “shoulders”). For an inverse head and shoulders, the pattern is flipped upside down.
- Interpretation – A head and shoulders often signals a potential move from uptrend to downtrend. Conversely, an inverse head and shoulders indicates a move from downtrend to uptrend.
- Example – If you see an inverse head and shoulders on GBP/USD, it could mean that sellers are losing strength and buyers are ready to push the price higher.
- Read More Head And Shoulders Pattern Indicator MT4 Free Download
Double Top / Double Bottom
- Appearance – Price forms two distinct peaks (double top) or two distinct troughs (double bottom) at or near the same level.
- Interpretation – Signals that the price has failed to break through a level (double top) or failed to drop a support (double bottom) below twice, suggesting a potential reversal.
- Example – EUR/USD forming a double top at 1.2000 might indicate a shift from an uptrend to a downtrend.
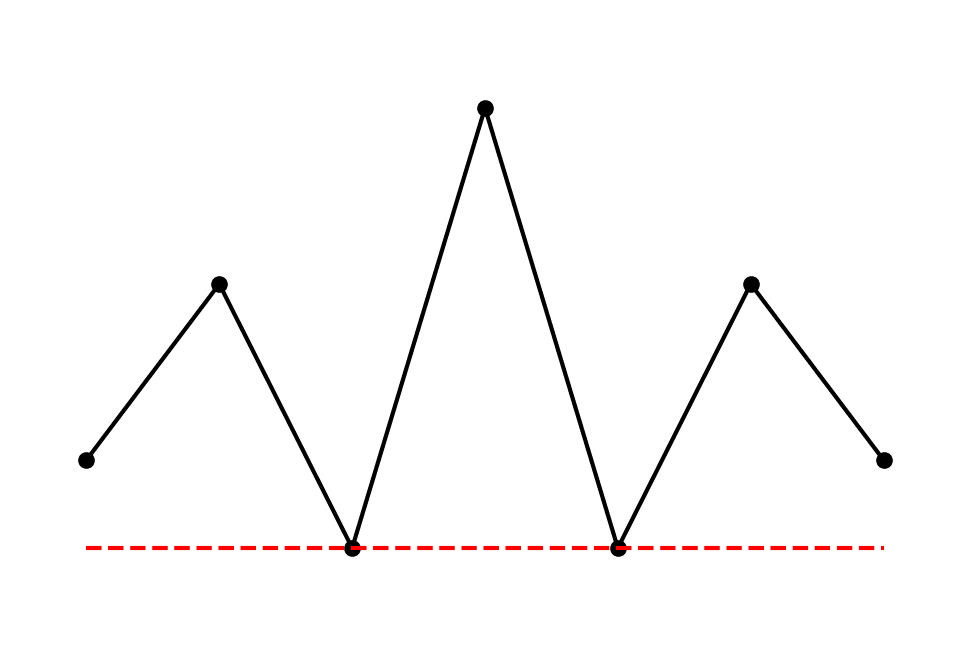
Triple Top / Triple Bottom
- Appearance – Price forms three distinct peaks (triple top) or three distinct troughs (triple bottom) at roughly the same level.
- Interpretation – An even stronger indication of a potential reversal compared to the double top/bottom pattern.
- Example – Seeing a triple top in a major pair like USD/CHF near an important resistance level could be a strong signal of upcoming bearish movement.
Continuation Patterns
Triangles (Ascending, Descending, Symmetrical)
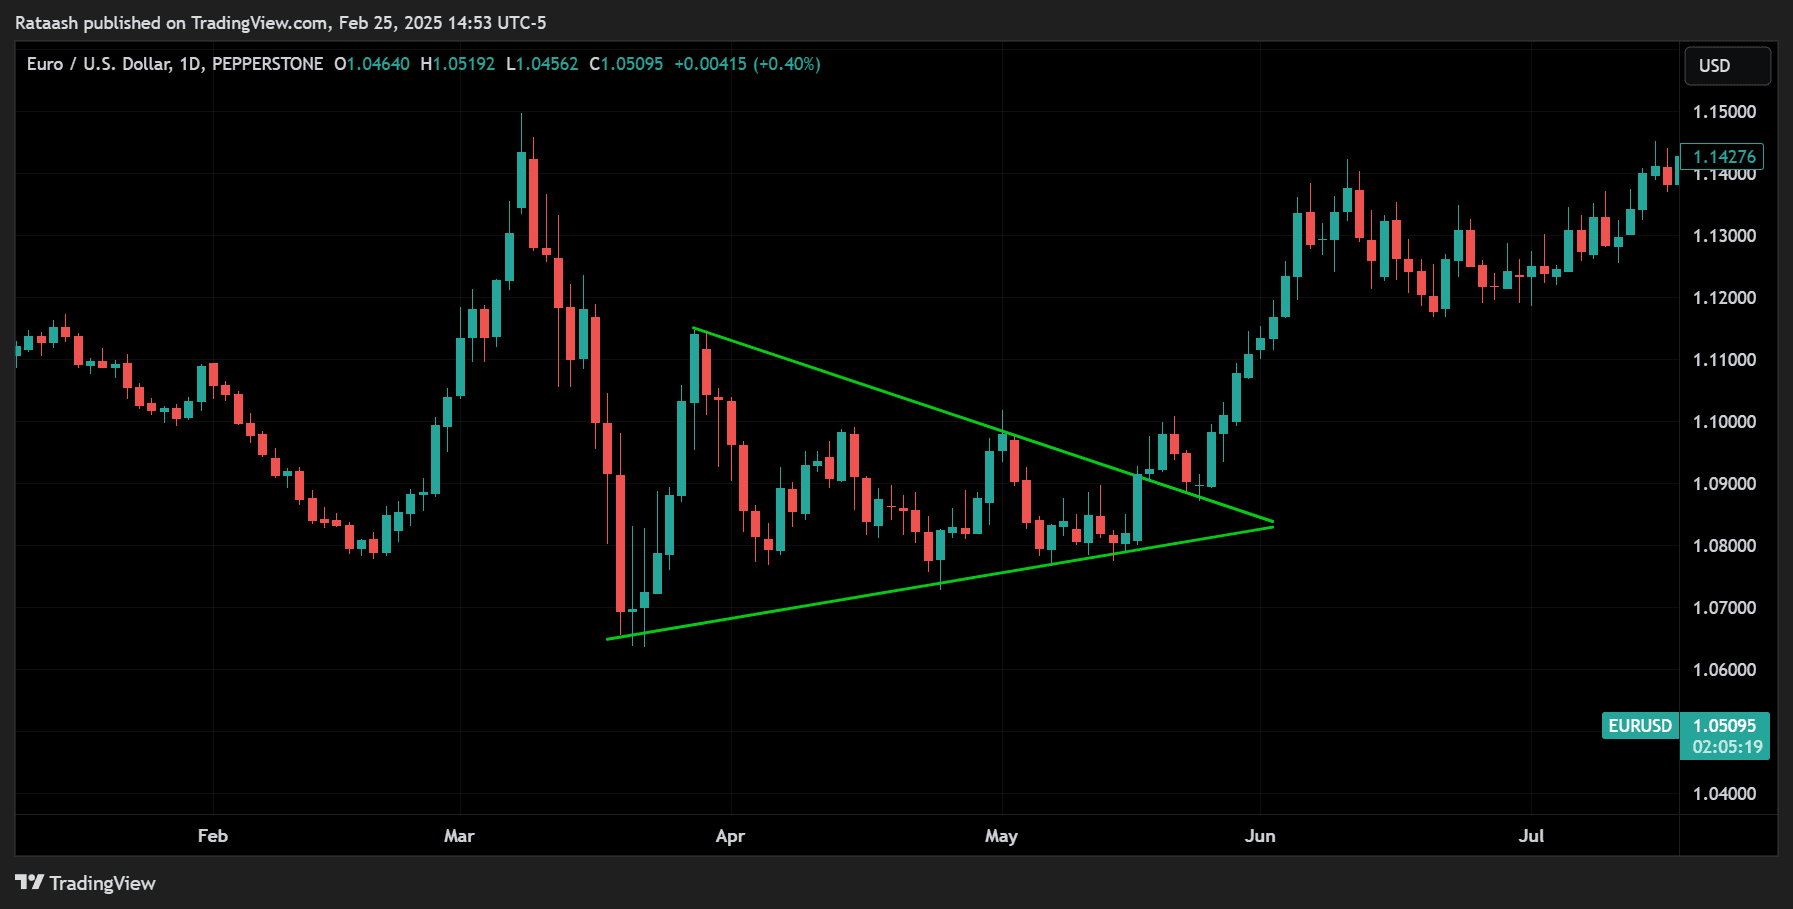
- Appearance – Price converges into a triangular shape. Ascending triangles have a flat resistance and rising trendline support. Descending triangles have a flat support and falling trendline resistance. Symmetrical triangles have both a falling trendline from above and a rising trendline from below, forming a more symmetrical shape.
- Interpretation – Triangles often indicate consolidation before the price continues in the original trend direction. A breakout in either direction can signal the next big move.
- Example – A symmetrical triangle in the middle of an uptrend on the EUR/JPY chart might precede a breakout continuation to the upside.
Flags and Pennants
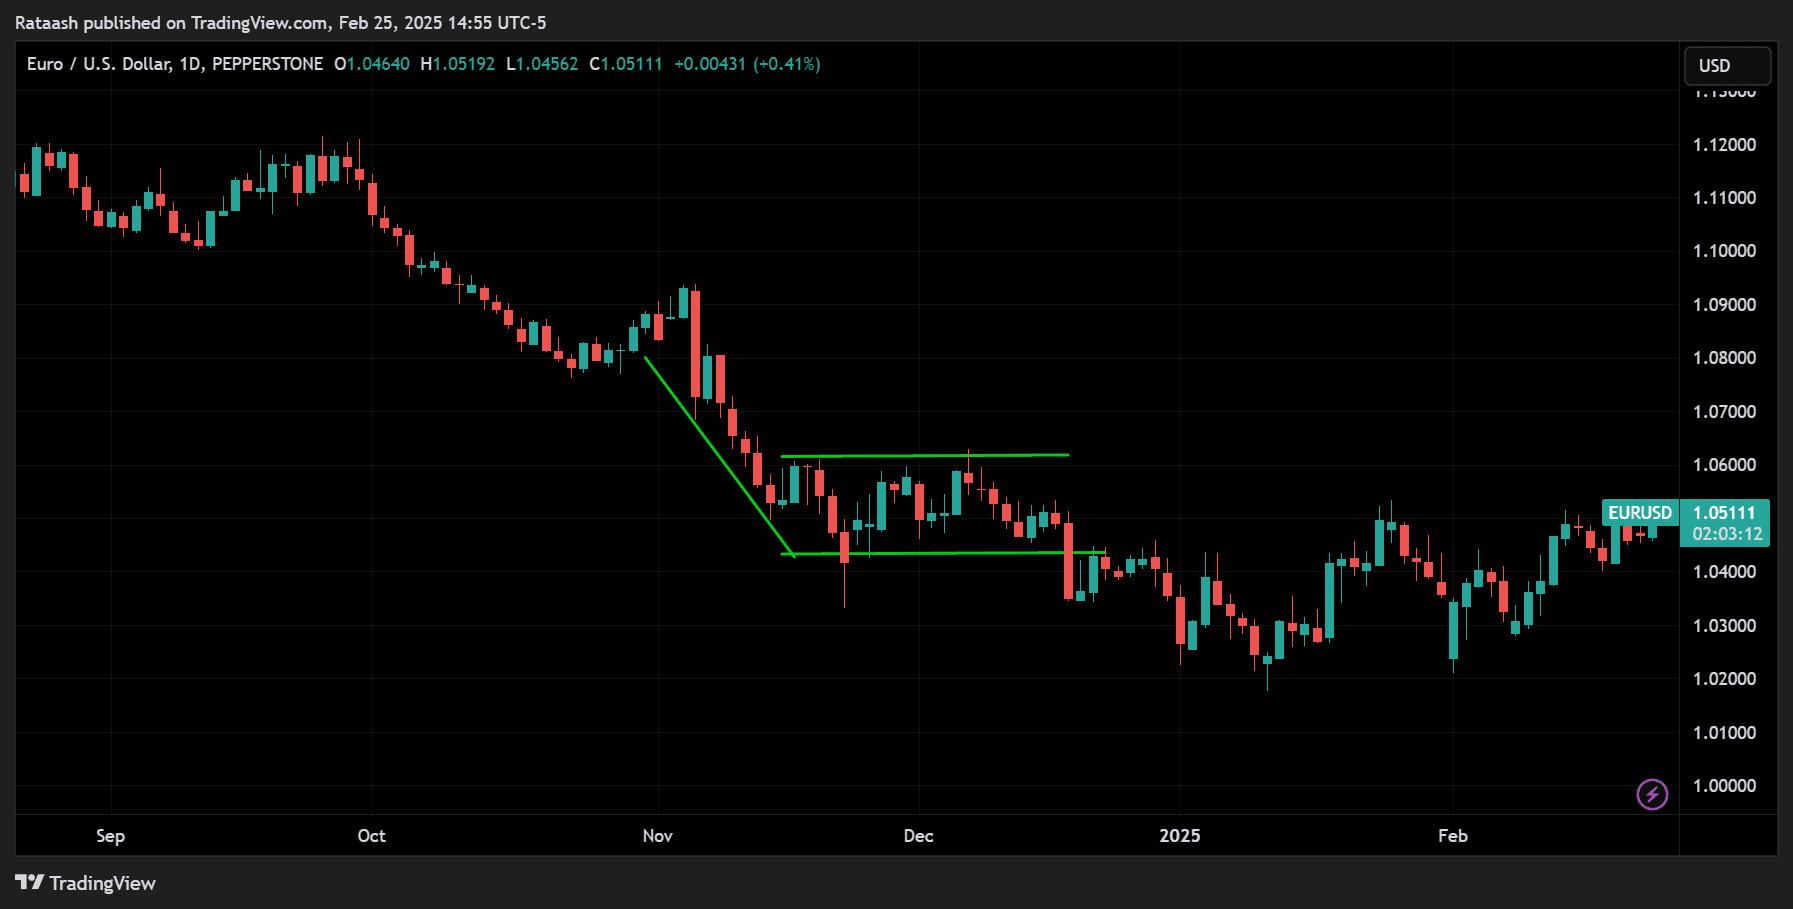
- Appearance – A strong impulse move (the “flagpole”) followed by a small, angled rectangular pattern (flag) or a small triangle-like pattern (pennant).
- Interpretation – Flags and pennants generally indicate a pause in the market before continuing in the same direction as the initial flagpole.
- Example – If GBP/USD sees a sharp move up followed by a tight consolidation channel (a flag), traders will look for a break above the channel as a sign that the uptrend is likely to continue.
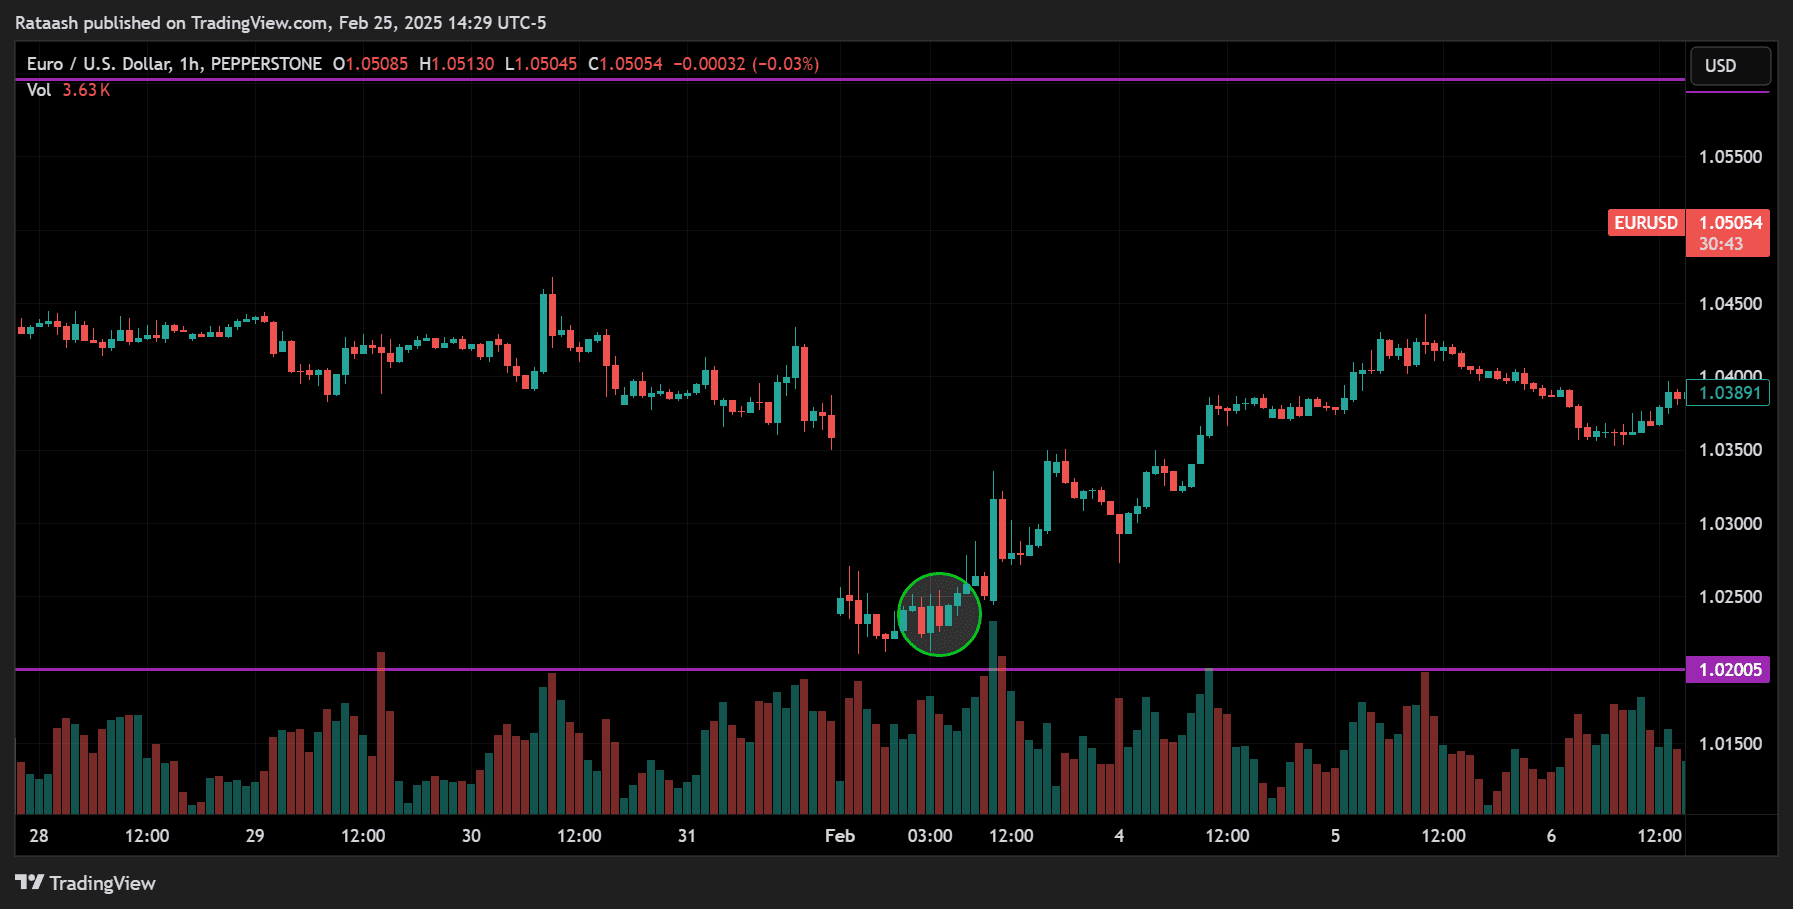
Supply and Demand Zones: Identifying Key Price Areas
While support and resistance levels are typically drawn as horizontal lines, supply and demand zones are often depicted as “zones” or “regions” on the chart. They represent areas where large institutional orders may exist.
- Supply Zone: An area where sellers overwhelmed buyers, causing a sharp move down. Traders watch for price to return to this area, anticipating a potential reversal or strong selling pressure again.
- Demand Zone: An area where buyers overwhelmed sellers, causing a sharp move up. Traders watch for price to revisit this zone, anticipating a potential reversal or strong buying pressure again.
Identifying Supply and Demand Zones:
- Look for strong, impulsive moves in price—long bullish or bearish candlesticks that break out of a consolidation zone.
- Mark the origin of these impulsive moves as potential supply (if the move was downward) or demand (if the move was upward).
- Wait for the price to return to these zones to confirm if buyers or sellers step in again.
Supply and demand trading is a popular subset of price action because it aligns well with how major financial institutions, hedge funds, and big banks place large orders in the market.
- Checkout More Supply and Demand EA and Indicators
Developing Price Action Forex Strategies
Below are three popular price action trading strategies. Each can be customized to your risk appetite, time availability, and preferred currency pairs.
Pin Bar Strategy
A pin bar is a single-candlestick pattern indicating rejection of price from a certain level. It often signals a potential reversal.
Steps to Trade the Pin Bar Strategy:
- Identify Key Levels: Mark major support or resistance zones. Look for pin bars forming at or near these zones.
- Confirm with Market Structure: If the market is in an uptrend, look for bullish pin bars forming at support. If the market is in a downtrend, look for bearish pin bars forming at resistance.
- Entry: For a bullish pin bar, place a buy stop order just above the pin bar’s high. For a bearish pin bar, place a sell stop order just below the pin bar’s low.
- Stop-Loss Placement: Typically, place your stop-loss below the pin bar’s wick for a bullish setup or above the pin bar’s wick for a bearish setup. This ensures that your trade is protected if the market reverses.
- Take-Profit: Aim for a favorable risk-to-reward ratio (e.g., 1:2 or 1:3). You can also scale out or trail your stop-loss as the trade moves in your favor.
Example: If EUR/USD has been in a steady uptrend and you spot a bullish pin bar at a well-established support around 1.1500, you might enter a buy trade once the price breaks the high of the pin bar. Your stop-loss would be placed below the pin bar’s low, and you’d target a move back toward the previous swing high, around 1.1600 or higher.
- Checkout More Pin Bar Indicators and Strategies
Engulfing Bar Strategy
An engulfing bar consists of a candlestick that completely engulfs the previous candlestick’s range, signifying a strong shift in sentiment.
Steps to Trade the Engulfing Bar Strategy:
- Identify Market Bias: Determine if the market is trending up, down, or ranging. Engulfing bars can appear in any market condition but are most potent in trending or key support/resistance levels.
- Locate Engulfing Candle: Wait for a bullish engulfing at support or in an uptrend, or a bearish engulfing at resistance or in a downtrend.
- Entry: Place a buy stop order above the high of a bullish engulfing bar, or a sell stop order below the low of a bearish engulfing bar.
- Stop-Loss: For a bullish engulfing, place the stop-loss below the engulfing candle’s low. For a bearish engulfing, place it above the engulfing candle’s high.
- Take-Profit: Use a suitable risk-to-reward ratio. Some traders also use trailing stops to lock in gains if the market continues to move in their favor.
Example: Suppose GBP/USD is rebounding off a major support level at 1.2200. You notice a bullish engulfing candle that engulfs the prior day’s bearish candle. This setup can provide confidence to buy, with a stop-loss below the engulfing candle’s low and a profit target at the next key resistance, such as 1.2300.
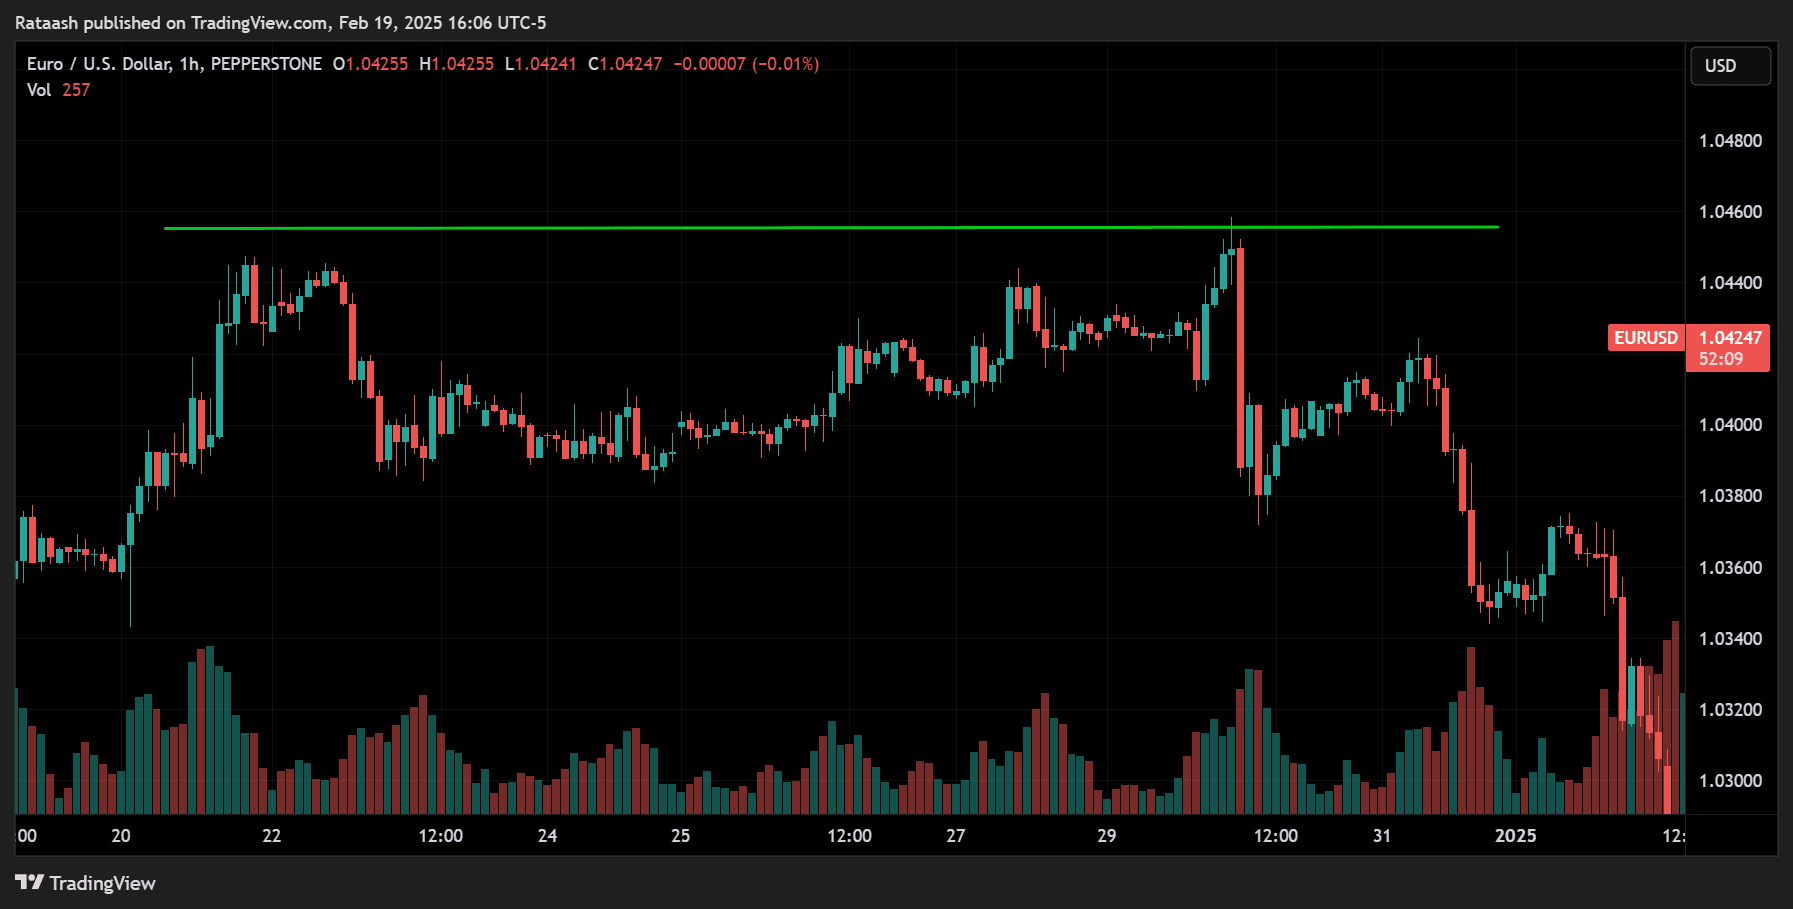
Breakout and Retest Strategy
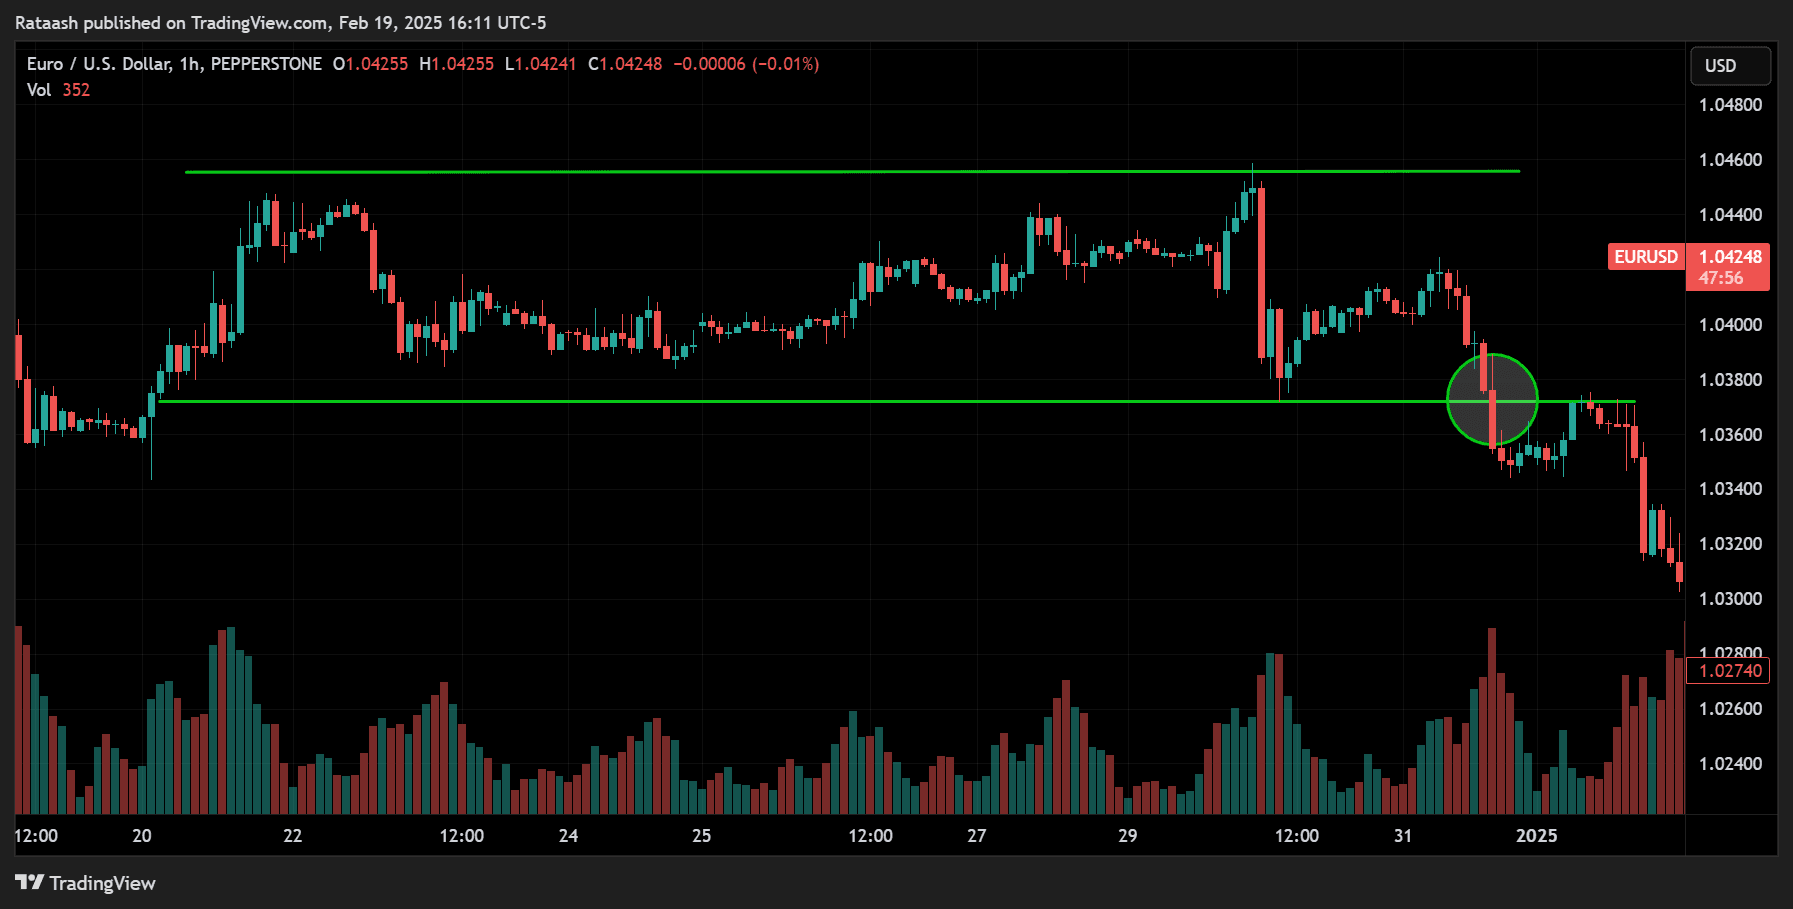
Markets often consolidate before making significant moves. When the price finally breaks out of the consolidation zone (range), a common approach is to wait for a retest of that broken level.
Steps to Trade Breakout and Retest:
- Identify Consolidation: Draw support and resistance around the range or consolidation area.
- Breakout Confirmation: Wait for a strong candlestick close beyond the support or resistance line, signifying a breakout.
- Retest: Price often returns to the breakout zone to test it. A former resistance can become new support (and vice versa).
- Entry: Once the retest occurs and a bullish or bearish confirmation candle appears, you enter the trade in the direction of the breakout.
- Stop-Loss: Place your stop-loss below the new support for a bullish breakout or above the new resistance for a bearish breakout.
- Take-Profit: You can target the next major support/resistance zone or use a measured move approach (the height of the range projected from the breakout point).
Example: EUR/JPY is ranging between 130.00 (support) and 131.00 (resistance). When it breaks above 131.00, you wait for the price to come back to 131.00 to retest. If the retest holds with bullish price action (like a pin bar or bullish engulfing), you enter long with a stop-loss below 131.00 and target 132.00 or higher.
Risk Management and Position Sizing

Even the most accurate strategy can fail without proper risk management. Protecting your capital is paramount to long-term success in Forex trading.
- Risk Per Trade – Many professional traders risk 1% or less of their account balance on each trade. This way, a series of losing trades does not decimate their account.
- Stop-Loss Orders – Always place a stop-loss at a logical level—such as beyond a swing high/low or significant support/resistance. This ensures you exit the trade if the market moves against you.
- Position Sizing – Use a position size calculator or a formula to determine how many lots you should trade, given your risk tolerance and stop-loss distance.
- Example – If you have a $10,000 account and decide to risk 1% ($100) per trade, and your stop-loss is 50 pips, you can calculate your lot size accordingly.
- Risk-to-Reward Ratio – Aim for trades that offer at least a 1:2 risk-to-reward ratio. This means that for every $1 you risk, you aim to make $2 in profit.
By strictly following a risk management plan, you ensure that no single trade (or even a series of trades) will ruin your trading account.
Trading Psychology and Discipline
Psychology often separates profitable traders from those who constantly struggle. Emotional decision-making can lead to overtrading, revenge trading, or cutting winners short and letting losers run.
- Emotional Control – Recognize and manage emotions like greed, fear, and hope. Stick to a well-defined trading plan.
- Patience – Waiting for the best setups is crucial. Not every candlestick formation is a trade; high-quality setups at significant levels often yield better risk-to-reward opportunities.
- Consistency and Routine – Develop a daily or weekly routine—analyze charts, check economic calendars, and update trading journals. Consistency in approach often leads to consistent results.
- Positive Mindset – Losses are part of the game. View them as feedback, not failures. Adapt and refine your strategy as you learn.
Combining Confluences for Higher Probability Trades
A single price action signal can sometimes work, but combining multiple confluences can significantly increase the odds of success. Confluences are factors that align in your favor, such as:
- Candlestick pattern at a key support/resistance level
- Trend alignment (i.e., trading in the direction of the overall trend)
- A Fibonacci retracement lining up with support/resistance or a supply/demand zone
- A breakout/retest aligning with a candlestick signal
Example of Confluence: You spot a bullish pin bar at a demand zone that also coincides with the 61.8% Fibonacci retracement of a prior uptrend. The market’s overall trend is bullish. This alignment of multiple factors increases the likelihood that the market will bounce from that zone.
Example Step-by-Step Price Action Trade
Let’s walk through a hypothetical scenario to see how you might combine several elements of price action:
- Market Overview – You check the daily chart of EUR/USD and notice a clear uptrend (higher highs, higher lows).
- Identify Key Support – You find a previous swing high around 1.2000 that was broken and now might act as support.
- Wait for Pullback – Price starts to retrace from 1.2100 down towards 1.2000.
- Look for Candlestick Pattern – A bullish pin bar forms right at 1.2000. The wick dips slightly below 1.2000 but closes above it, indicating rejection of lower prices.
- Check Confluences –
- Uptrend on the daily chart
- 1.2000 is a strong round-number level
- Pin bar forms at a previous resistance-turned-support zone
- Enter Long – You place a buy stop order just above the pin bar’s high.
- Stop-Loss Placement – Your stop-loss goes below the pin bar’s wick, ensuring enough breathing room.
- Take-Profit Strategy –
- Aim for a 1:3 risk-to-reward ratio, targeting 1.2100 or higher.
- Alternatively, you might trail your stop-loss as the price moves in your favor.
- Trade Management –
- If price moves in your favor, you may shift your stop-loss to break-even once you reach a 1:1 risk-to-reward ratio, eliminating further risk.
- If the market hits your take-profit, you book your gains. If it reverses and hits your stop-loss, you accept a small, controlled loss and move on to the next opportunity.
This example illustrates how you can stack multiple pieces of price action evidence to formulate a robust trading setup.
Common Mistakes to Avoid
- Overtrading – Taking trades on every minor signal can lead to inconsistent performance. Wait for clear setups at key levels.
- Ignoring Larger Timeframes – Always analyze higher timeframes for overall trend direction and key levels. Entering solely off a 5-minute chart without referencing the daily or 4-hour charts is risky.
- No Stop-Loss – Trading without a stop-loss can lead to catastrophic losses.
- Moving Stop-Loss Arbitrarily – If you move your stop-loss further away to “give the trade room to breathe,” you could be increasing your risk disproportionately.
- Risking Too Much – Poor risk management often results in blowing up your account due to a few bad trades. Stick to a consistent risk percentage (like 1% or 2%) per trade.
- Lack of Discipline – Inconsistent application of your strategy—exiting trades prematurely, taking impulsive trades—undermines your long-term profitability.
Frequently Asked Questions
Is Price Action Suitable for Beginners?
Yes. Price action is a great way to understand market movements without relying on multiple indicators. However, it requires practice and patience to develop the skill of reading charts effectively.
Which Timeframe is Best for Price Action Trading?
There is no single “best” timeframe. Scalpers may prefer 1-minute or 5-minute charts, while swing traders lean toward 4-hour or daily charts. Always confirm signals on at least one higher timeframe to understand market context.
How Do I Know if a Breakout is Real or False?
Look for a strong candlestick close beyond the breakout level, ideally accompanied by higher volume if your trading platform provides reliable volume data. Additionally, watch for a successful retest of the breakout level.
Can I Use Indicators with Price Action?
Yes, many traders supplement price action with simple tools like Moving Averages to gauge trend direction or RSI to spot divergences. However, the core decisions are still based on price behavior.
How Long Does It Take to Master Price Action?
Mastery varies by individual. Some traders become consistently profitable within a year or two, while others might take longer. Practice on a demo account or trade with small position sizes until you build confidence.
Is Price Action Only Applicable to Forex?
No. Price action methods apply to all liquid markets, including stocks, commodities, and cryptocurrencies. However, different assets may have unique behaviors or volatility patterns.
Conclusion
Price action offers a clear and direct way to interpret market movements, free from the noise often introduced by numerous technical indicators. By mastering candlestick patterns, chart formations, support and resistance, and understanding the overarching market structure, you position yourself to spot high-probability trading opportunities in Forex.
Key Takeaways:
- Study Candlestick Patterns – Learn to read pin bars, engulfing bars, and other key signals for potential entries.
- Identify Key Levels – Support, resistance, supply, and demand zones give you logical areas to anticipate reversals or continuations.
- Align with the Trend – Trading in the same direction as the overall trend can significantly boost your edge.
- Use Proper Risk Management – Protecting your capital is more important than any single trade. Employ stop-losses and position-sizing rules diligently.
- Maintain Trading Discipline: Emotional control and a well-structured routine often separate profitable traders from those who struggle.
Remember, trading is not a get-rich-quick scheme. It demands consistent effort, ongoing education, and disciplined execution. By focusing on price action principles and solid risk management, you can build a robust foundation for generating consistent profits over the long term. Practice, review your trades, stay updated with market news, and continue honing your price action skills. Over time, the market will reward your diligence with better and more consistent results.
Final Thoughts on Your Journey
Whether you are a novice trader transitioning from indicator-heavy setups to more streamlined price action charts, or an intermediate trader refining your skills, patience and persistence are key. Embrace a growth mindset—learn from mistakes, adapt, and strive for consistent incremental improvements. Price action is a skill that grows more intuitive with each chart you analyze and each trade you manage.
Stay committed, keep learning, and remember: the market rewards those who balance knowledge with discipline and patience. Here’s to your journey towards mastering price action Forex trading strategies—and achieving the consistent profits you aim for.